|
-- Weekly Market Update for the Week Commencing 24th August 2009
Big Picture
View
Here is a summary of our big picture
view of the markets. Note that our short-term views may differ from our
big picture view.
In nominal dollar terms, the BULL market in US Treasury Bonds
that began in the early 1980s will end by mid-2010. In real (gold)
terms, bonds commenced a secular BEAR market in 2001 that will continue
until 2014-2020. (Last
update: 09 February 2009)
The stock market, as represented by the S&P500 Index, commenced
a secular BEAR market during the first quarter of 2000, where "secular
bear market" is defined as a long-term downward trend in valuations
(P/E ratios, etc.) and gold-denominated prices. This secular trend will bottom sometime between 2014 and 2020. (Last update: 22 October 2007)
A secular BEAR market in the Dollar
began during the final quarter of 2000 and ended in July of 2008. This
secular bear market will be followed by a multi-year period of range
trading. (Last
update: 09 February 2009)
Gold commenced a
secular bull market relative to all fiat currencies, the CRB Index,
bonds and most stock market indices during 1999-2001. This secular trend will peak sometime between 2014 and 2020. (Last update: 22 October 2007)
Commodities,
as represented by the Continuous Commodity Index (CCI), commenced a
secular BULL market in 2001 in nominal dollar terms. The first major
upward leg in this bull market ended during the first half of 2008, but
a long-term peak won't occur until 2014-2020. In real (gold) terms,
commodities commenced a secular BEAR market in 2001 that will continue
until 2014-2020. (Last
update: 09 February 2009)
Copyright
Reminder
The commentaries that appear at TSI
may not be distributed, in full or in part, without our written permission.
In particular, please note that the posting of extracts from TSI commentaries
at other web sites or providing links to TSI commentaries at other web
sites (for example, at discussion boards) without our written permission
is prohibited.
We reserve the right to immediately
terminate the subscription of any TSI subscriber who distributes the TSI
commentaries without our written permission.
Outlook Summary
Market
|
Short-Term
(0-3 month)
|
Intermediate-Term
(3-12 month)
|
Long-Term
(1-5 Year)
|
Gold
|
Neutral
(25-May-09)
|
Bullish
(12-May-08)
|
Bullish
|
US$ (Dollar Index)
|
Bullish
(10-Aug-09)
| Bullish
(25-May-09)
|
Neutral
(19-Sep-07)
|
Bonds (US T-Bond)
|
Bullish
(10-Aug-09)
|
Bullish
(08-Jun-09)
|
Bearish
|
Stock Market (S&P500)
|
Neutral
(27-Jul-09)
|
Bearish
(11-May-09)
|
Bearish
|
Gold Stocks (HUI)
|
Neutral
(20-May-09)
|
Bullish
(17-Jun-09)
|
Bullish
|
| Oil | Bearish
(17-Aug-09)
| Bearish
(25-May-09)
| Bullish
|
Industrial Metals (GYX)
| Bearish
(17-Aug-09)
| Bearish
(25-May-09)
| Bullish
|
Notes:
1. In those cases where we have been able to identify the commentary in
which the most recent outlook change occurred we've put the date of the
commentary below the current outlook.
2. "Neutral", in the above table, means that we either don't have a
firm opinion or that we think risk and reward are roughly in balance with respect to the timeframe in question.
3. Long-term views are determined almost completely by fundamentals,
intermediate-term views by giving an approximately equal weighting to
fundmental and technical factors, and short-term views almost
completely by technicals.
Bank Reserves and Inflation
Recent arguments between
deflationists (those who are forecasting deflation) and inflationists
(those who are forecasting inflation) often boil down to opposing views
about what will happen to the huge quantity of reserves that the Fed
has supplied to the US banking industry over the past year. The
inflationists claim that these reserves will, in the not-too-distant
future, support a massive increase in the money supply via the famous
"money multiplier" (for every additional dollar of reserves, the
banking industry can supposedly create an additional 10 dollars of
deposits). The deflationists, on the other hand, claim that this won't
happen because the banking industry's collective balance sheet is now
so grossly impaired that there will be no meaningful expansion in the
total volume of bank lending for a long time to come. And in any case
(according to the deflationists), even if the banks did want to lend
there is now a dearth of credit-worthy borrowers to lend to. There is
also a third group, that we'll call the 'just-rightists', who believe
that the Fed has done a wonderful job of staving off deflation, and
will, at the appropriate time in the future, remove the excess bank
reserves before an inflation problem arises.
Our view, which will undoubtedly be considered sacrilegious in some
quarters, is that the level of reserves within the banking system is
not central to the inflation/deflation issue. We will explain why in a
moment, but first we'll present charts that clearly illustrate the lack
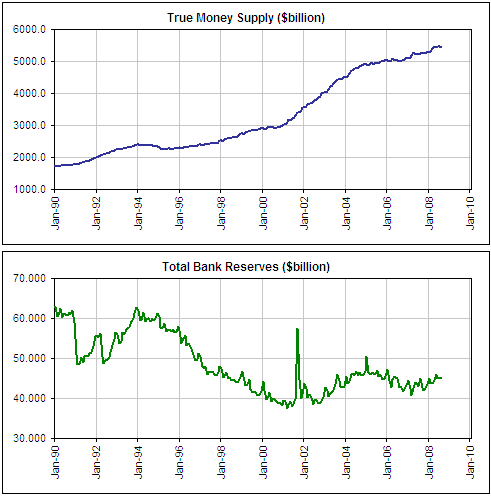
of any relationship between bank reserves and monetary inflation.
The first of the following charts shows the upward trend in True Money
Supply (TMS) between January of 1990 and August of 2008. Specifically,
it shows that TMS rose from $1,725B in Jan-1990 to $5,444B in Aug-2008
-- a percentage gain of 215% over the period in question. The second
chart shows that the total quantity of bank reserves FELL from $63B to
$45B over the same period. Taken together, the charts show that a 215%
rise in total money supply was accompanied by a 28% decline in bank
reserves. (By the way, TMS does not include bank reserves. It comprises
currency in circulation plus demand deposits plus savings deposits).
The main reason that
the money supply could grow to such an extent in the face of declining
reserves is that US regulatory changes implemented during the early
1990s effectively removed the requirement for banks to hold reserves
(they must hold reserves for "demand deposits", but through the process
known as "sweeping" they are able to get around this requirement). To
put it another way, any amount of bank reserves can now support any
amount of bank deposits. This, in a nutshell, is why it makes no sense
to agonise over what will happen to today's unusually large quantity of
bank reserves as if the inflation/deflation issue hinged on the result.
It is also why, in TSI commentaries over the years, we have only ever
mentioned the "money multiplier" taught in economics courses to point
out that it no longer exists in any meaningful way.
Given the above, why do so many analysts believe that bank reserves
determine total money supply via a 10:1 (or some other) "money
multiplier"? The answer, we guess, is that this was the way the
monetary world worked once upon a time. The rules have changed, but old
habits -- like assuming that the Fed prompts an increase in the
economy-wide supply of money by boosting bank reserves -- die hard. The
Fed does exert considerable influence over the money supply, but it
does so by distorting interest rates and by simply being there (the
Fed's existence enables the private banks and the government to do
things they would not otherwise dare to do or be able to do).
With regard to the inflation/deflation issue, we think the smart
deflationists (those who define deflation in terms of money supply, not
prices) are right about most things. In particular, they are probably
right that the banking industry won't contribute significantly to
growth in the economy-wide supplies of money and credit over the years
ahead, almost regardless of what happens to bank reserves. However, we
think their overarching conclusion is wrong.
They are wrong, in our opinion, because they are failing to account for
the fact that during prolonged periods of economic weakness the primary
engine of inflation will be the government, not the banking
establishment. The government, using the tool known as the central
bank, can borrow a virtually unlimited* amount of new money into
existence. For its part, the central bank can help things along through
not only monetising (buying with money created out of nothing) whatever
amount of government debt is not absorbed by other investors, but also
through lending new money directly into the economy.
The past year has yielded solid evidence in support of our view that
the inflationary efforts of the government will overwhelm the
deflationary effects of private sector de-leveraging. For example, US
bank lending has been stagnant since August of last year, and yet the
economy-wide supply of credit has continued to expand and TMS is up by
around 13%. The inflation is being driven primarily by a dramatic
increase in government borrowing and secondarily by the Fed's**
implementation of programs that bypass the commercial banks and inject
new money directly into the economy.
In conclusion, while there is certainly a risk that the banking
system's massive infusion of reserves will eventually contribute to the
overall inflation problem, our inflation forecast in no way depends on
such an eventuality. Over the past decade we have consistently
maintained that if/when private banks and private borrowers became
unwilling or unable to expand their respective balance sheets and debt
burdens, the government would take control and borrow into existence
whatever amount of new money was needed to perpetuate the inflation.
There is no good reason for us to step away from this forecast now
because the evidence of the past year strongly supports it.
*The bond and
currency markets impose the only practical limitation, in that monetary
inflation will become counterproductive (from the government's
perspective) once bond yields begin to rocket upward and/or the
currency's foreign exchange value begins to tank. As long as the bond
and currency markets remain cooperative, the government will
effectively have carte blanche on the monetary inflation front.
**Like
the balance sheets of the private banks, the Fed's balance sheet is
grossly impaired. However, although the Fed's shareholders are private
banks (every bank operating within the US technically has an ownership
stake in the Fed), the Fed does not operate under the same constraints
as the private banks. If there was ever any doubt about this it should
have been removed over the past year by the Fed's demonstrable
willingness to obliterate its own balance sheet for the sake of adding
money and credit to the economy. In effect, the Fed operates in similar
fashion to a branch of the federal government. When a branch of the
federal government gets into trouble it is often allocated more
resources and more power.
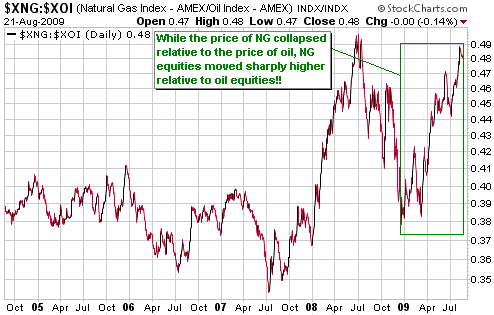
Oil and Gas
Natural gas is relatively cheap, but natural gas stocks are relatively expensive
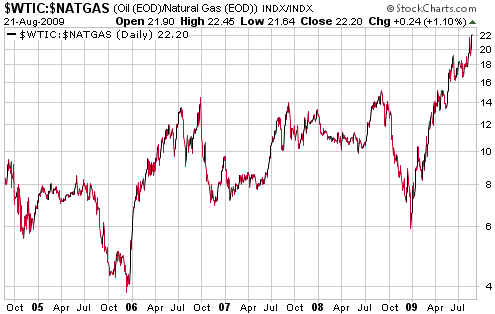
The following three charts tell an interesting story.
The first chart shows that the oil/natgas ratio (the price of oil
relative to the price of natural gas) hit a new multi-year high -- and
perhaps a new all-time high -- last Friday. The ratio would be around 6
if oil and natgas were trading at their energy-equivalent levels, so
with the ratio near its current level of 22 it means that oil is
effectively trading at a 250% premium to natural gas.
When markets move way beyond rational valuations and stay there for a
prolonged period, people will become accustomed to the new valuation
level and explanations will emerge as to why the new valuation really
does make sense. However, a while later it will be discovered that the
new valuation was as nonsensical as it originally appeared.
Clearly, stock market participants are convinced that the price of
natural gas is slated to move much higher over the coming 12 months. We
agree, but we are concerned that a doubling or tripling of the natgas
price is already discounted in the current prices of natgas equities.
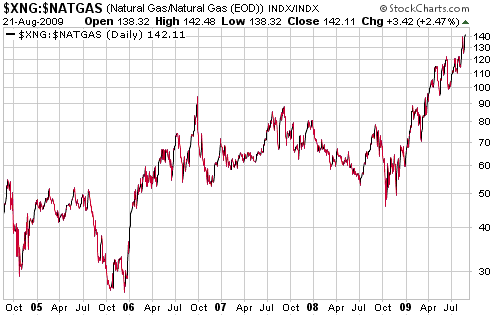
The third chart is the most interesting, or at least the most
surprising, because it shows that natural gas equities have
outperformed oil equities by a wide margin over the past 8 months. In
other words, it shows that even though natural gas has tanked relative
to oil, the stocks of natural gas producers have risen sharply relative
to the stocks of oil producers. We challenge devotees of the "Efficient
Market Hypothesis" to explain that one!
Further to the above, there is a lot of downside risk in natural gas
equities right now. We were buyers of natgas stocks in late February
and early March (as noted in TSI commentaries at the time) and then
scaled back to our core exposure to this sector during May (as also
noted at the time). Our core exposure is, by definition, the minimum
exposure that we maintain while we are long-term bullish, but our
concern about the downside risk in natural gas equities has us looking
for opportunities to either replace equity exposure with direct
commodity exposure (via a natural gas ETF) or hedge via put options on
natural gas stocks (FCG put options, for example).
Two things to consider: First and as explained in a previous
commentary, seasonality and the effects of contract rollovers could
make the second halves of September and October the optimum times to
accumulate an ETF that tracks the natural gas price. Some money should
therefore be kept in reserve for this purpose. Second, the possibility
that impending government regulations will restrict the number of
futures contracts it can hold has recently prevented the United States
Natural Gas Fund (NYSE: UNG) from issuing new shares to meet increased
demand, the result being that UNG now trades at a substantial (15% or
so) premium to its net asset value. This effectively makes UNG
'unbuyable' at this time. Until UNG's market price drops back to near
its net asset value, the Canada-listed Claymore Natural Gas Commodity
ETF (TSX: GAS) would be a better way to obtain natural gas exposure.
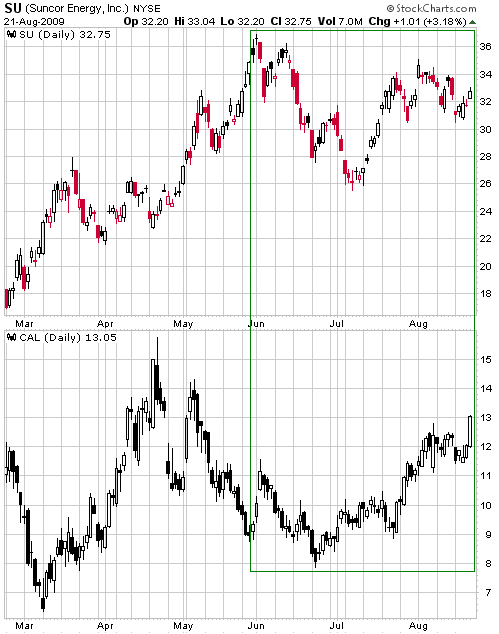
The stock market as an oil market indicator
Below is a chart comparison of Suncorp Energy (NYSE: SU) and
Continental Airlines (NYSE: CAL). We are using SU to represent the oil
sector because it is one of the few large-cap oil stocks that actually
provides leverage to changes in the oil price, and we are comparing it
with CAL because CAL provides INVERSE leverage to the oil price (it
benefits from a weak oil market and is hurt by a strong oil market).
Sometimes these stocks move in the same direction due to either extreme
strength or extreme weakness in the broad stock market, but most of the
time they move in opposite directions in response to oil's price trend.
From early July through to the end of July both stocks were pushed
upward by a strong rally in the broad stock market, but notice that CAL
has moved well above its early-June peak and ended Friday's session at
a new 3-month high, whereas SU remains below its early-June peak and
has been working its way downward since the beginning of this month. It
is possible that SU is just consolidating ahead of a break to new highs
for the year, but the stock market is currently acting as if the oil
price made an intermediate-term PEAK in early June and has just
completed a successful test of its peak.
A Good Article
The recent WSJ article "Big Government, Big Recession" is worth reading. Here's the conclusion:
"...recessions have
become longer as the U.S. government (and the Fed) became larger, more
expensive, and more involved in the economy. Foreign countries in which
government spending accounts for about half of the economy have also
suffered the deepest recessions lately, while economic recovery is well
established in countries where government spending is a smaller share
of GDP than in the U.S.
In short, bigger government appears to produce only bigger and longer recessions."
The Stock
Market
The US stock market rallied
to a new high for the year last Friday. That's the good news (unless
you happen to be short). The bad news is that the market's recent
pullback was not deep enough to put a meaningful dent in the bullish
enthusiasm that now prevails.
We do not believe that there is a realistic chance of a crash over the
next couple of months. Crashes are always low-probability events, and
as far as we know there is no historical precedent for the stock market
crashing one year and then crashing again the next. However, there is a
high probability that the market is experiencing nothing more than a
post-crash rebound within a bear market, and under such conditions in
the past the crash lows have always ended up being tested and have
usually ended up being breached.
We are now approaching the middle of the most likely time window for a
post-crash rebound high (the window extends from August through to
October), but the S&P500 Index is still about 10% shy of a fairly
typical 50% 'retracement' of the preceding decline.
This week's
important US economic events
| Date |
Description |
Monday Aug 24
| No important events scheduled
| | Tuesday Aug 25 | S&P Case-Shiller HPI
Consumer Confidence
FHFA House Price Index
| | Wednesday Aug 26
| Durable Goods Orders
New Home Sales
| | Thursday Aug 27
| Q2 GDP (revised)
| | Friday Aug 28
| Personal Income and Spending
Consumer Sentiment
|
Gold and
the Dollar
Currency Market Update
We'll deal with the currency market before the gold market today
because the Dollar Index closed just above important support last
Friday, and its ability, or inability as the case may be, to remain
above this support will very likely determine what happens to gold and
gold stocks over the weeks ahead.
The following daily Dollar Index chart shows that:
a) Important support, defined by the Aug-2009 and Dec-2008 lows, lies at 77.5.
b) The Dollar's daily Price Momentum Oscillator (PMO) has been trending
upward since early June, creating a positive divergence between
momentum and price. Despite last week's drop by the Dollar Index to
near its low for the year, the PMO ended the week above its 10-day
moving average.
c) A daily close above 80 would clearly break the Dollar Index out of
its downward-sloping channel and signal that an intermediate-term low
is in place.
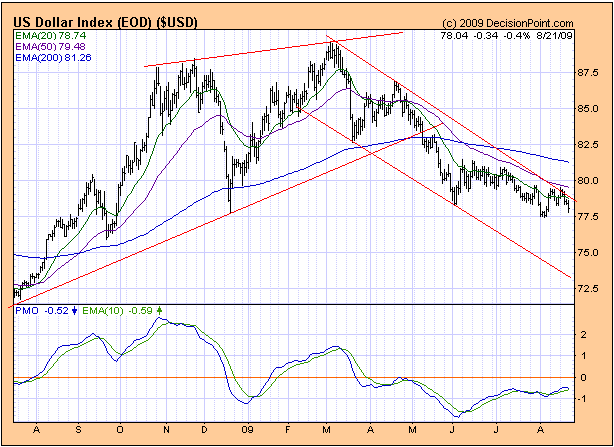
We recently turned
short-term bullish on the US$ based on the assumption that downside
risk was defined by the early-August low. With the Baltic Dry Index
having declined to a new 3-month low last week, with oil having failed
to break above its early-June peak and with gold remaining in
consolidation mode, the bulk of the evidence is still consistent with
this assumption. However, the situation is finely balanced because it
wouldn't take much additional weakness from here to break the dollar
below support. If support at 77.5 gives way then the low-70s will
become the most logical short-term target for the Dollar Index, and
sharp 1-2 month up-moves in most commodities, with gold and silver
leading the way, will probably occur.
In summary, the currency market and, therefore, most other markets have
reached an inflection point. The odds are in favour of the Dollar Index
holding above support, but if it doesn't then our short-term outlooks
for most markets will change.
Gold
Current Market Situation
Gold's price action, as illustrated by the following daily chart of
December gold futures, is consistent with the idea that the markets
have reached an inflection point. Gold will soon break out of its
triangular price pattern, one way or the other.
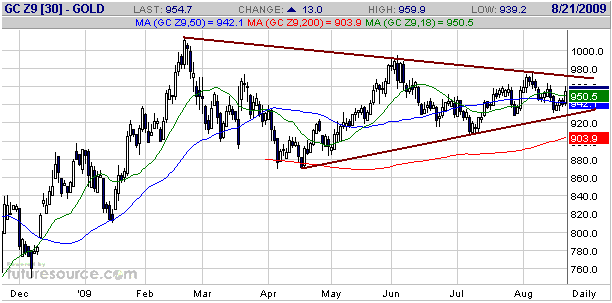
The way we have drawn
the trend-lines on the above chart, a daily close above $980 or below
$920 would constitute a breakout. However, a trend line drawn on a
chart is always somewhat arbitrary. What isn't arbitrary is a support
or resistance level based on a previous high or low. In gold's case,
the most recent high of note occurred in early June and the most recent
low of note occurred in early July. A daily close above the June high
or below the July low would break the sequence of declining tops or
rising bottoms, and would therefore constitute more definitive evidence
of a breakout than a move beyond the trend-lines.
There's a good chance that gold will make a substantial 1-2 month move
in the direction of its breakout, especially if the breakout is to the
upside.
China
A number of subscribers have asked us to comment on a recent Stockhouse.com article entitled "Why China is about to buy a lot more silver".
Our view is that the buying of Chinese citizens will not have a
significant effect on the silver market anytime soon, because the
amount involved will be too small. As far as we can tell, at this time
very few people in China are interested in using silver (or gold) as a
store of value. The situation could change in the future if the RMB
(China's currency) begins to lose purchasing power at faster pace, but
Chinese buying is unlikely to be a meaningful factor over the next 12
months.
Gold Stocks
The AMEX Gold BUGS Index (HUI) plunged last Monday and then spent the
rest of the week recovering Monday's loss. As a result it was almost
unchanged over the course of the week.
The following daily chart shows that last week's decline tested support
in the 330s. A drop to the lower support level at around 310 would have
created a short-term buying opportunity with a very attractive
risk/reward, but the market has decided not to make it easy.
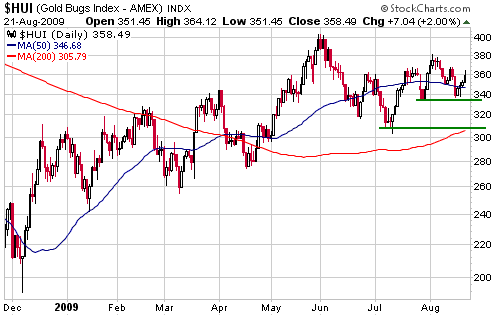
The currency market's
inflection point will naturally have important short-term implications
for the gold sector. If the Dollar Index is about to break below
support then any near-term pullback in the HUI will probably be limited
by its 50-day moving average (currently at 346) and a rally to new
highs for the year will soon begin. However, if the Dollar Index is in
the process of successfully testing support then the HUI will probably
drop to the low-300s within the next couple of weeks.
Most of our short-term views have been linked in some way to the
assumption that the Dollar Index has been undergoing a bottoming
process since early June and that the US dollar's next move of
consequence would be to the upside. For example, our view that the HUI
made an intermediate-term peak at the beginning of June and would work
its way down to a correction low during October-November (with,
perhaps, an intervening lower peak during September), was consistent
with our expectation that gold would be weak during the INITIAL phase
of the next intermediate-term US$ advance. If, however, there is going
to be another leg to the dollar's downward trend then the anticipated
October-November turning point in the gold sector will change from a
low to a high.
Update
on Stock Selections
(Note: To review the complete list of current TSI stock selections, logon at http://www.speculative-investor.com/new/market_logon.asp
and then click on "Stock Selections" in the menu. When at the Stock
Selections page, click on a stock's symbol to bring-up an archive of our comments on the stock in question)
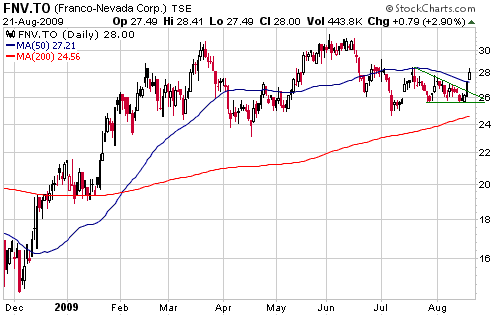
 Franco Nevada Warrants (TSX: FNV.WT). Recent price: C$5.12 Franco Nevada Warrants (TSX: FNV.WT). Recent price: C$5.12
Franco Nevada (TSX: FNV) is a royalty company that generates about 70%
of its revenue from gold royalties and the remaining 30% from oil/gas
royalties.
In the 29th July Interim Update, we wrote: "FNV.WT
is one of the most interesting of the currently available gold-stock
warrants. It has an exercise price of C$32.00 and an expiry date of
March-2012."
Our best guess, at that time, was that FNV would work its way down to
near support at C$22.00 within the ensuing three months, pushing the
price of the warrants down to the low-C$3 area. We said that if this
happened then we would almost certainly add the warrants to the TSI
Stocks List.
We also explained that when adding to or removing from the TSI Stocks
List we have to pick our spot, but when managing our own money we
typically average into and out of positions over time. So, although we
were hoping for a better opportunity to add FNV.WT to the TSI List, we
had begun to average into FNV.WT in our own account. Our main
considerations at that time were that the warrants offered reasonable
value relative to the stock and that if FNV rallied to C$50 or higher
at any time over the ensuing 2.5 years it wouldn't matter a great deal
whether we originally paid C$4.40 or C$3.20 for the warrants.
The stock was seemingly on its way to lower levels, but it reversed
upward in impressive fashion during the final two days of last week.
This has changed the complexion of the price chart (see below). There
is now a better chance that an important low was put in place in early
July and that a rally to new highs for the year has begun. If this is
the case then any pullback over the days ahead should hold at, or near,
the 50-day moving average.
For speculators looking for opportunities to purchase leveraged
exposure to the gold sector, our suggestion is to take an initial
position in FNV.WT at or below its current price.
Another warrant
worthy of consideration at this time is the Kinross Gold Series C
warrant (TSX: K.WT.C), which has an exercise price of C$32.00 and an
expiry date of September-2013. K.WT.C closed at C$4.25-4.28 on Friday.
Due to Kinross's greater political risk we prefer the FNV warrants, but
the Kinross warrants offer plenty of leverage and the advantage of a
later expiry date.
Be aware that most stock warrants (including the two mentioned above)
are relatively illiquid, so limit orders should always be used when
trading them.
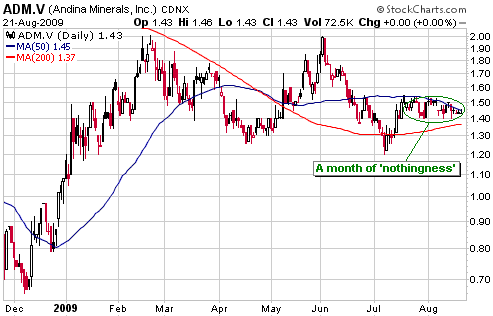
Andina Minerals (TSXV: ADM). Shares: 92M issued, 99M fully diluted. Recent price: C$1.43
One of the cheapest ways to buy gold in the ground in a relatively
secure location is to buy ADM shares. ADM's Volcan project in Chile has
a total resource of around 10M ounces of gold, about 7M of which are in
the measured-and-indicated (M&I) category.
There hasn't been any market-moving news about ADM in the recent past
and we don't expect any in the near future, but a month of going
nowhere has potentially set the stage for some interesting upside. We
wouldn't buy this stock for a short-term trade, but a purchase made
near the current price with, say, a 2-year timeframe in mind could
provide a bonus in the form of a significant short-term gain.
Chart Sources
Charts appearing in today's commentary
are courtesy of:
http://stockcharts.com/index.html
http://www.futuresource.com/
http://www.decisionpoint.com/

|