![]()
![]()
![]()
![]()
-- Weekly Market Update for the Week Commencing 24th October 2016
Big Picture
View
Here is a summary of our big picture
view of the markets. Note that our short-term views may differ from our
big picture view.
The BULL market in US Treasury Bonds that began in the early 1980s ended in early-2015, but there will be many years of topping action in bond prices and bottoming action in bond yields before major new trends get underway. (Last update: 29 June 2015)
The stock market, as represented by the S&P500 Index, commenced a secular BEAR market during the first quarter of 2000, where "secular bear market" is defined as a long-term downward trend in valuations (P/E ratios, etc.) and gold-denominated prices. This secular trend will bottom sometime between 2018 and 2020. (Last update: 29 June 2015)
A secular BEAR market in the US Dollar began during the final quarter of 2000 and ended in July of 2008. This secular bear market will be followed by a multi-year period of range trading. (Last update: 09 February 2009)
Gold commenced a secular bull market relative to all fiat currencies, the CRB Index, bonds and most stock market indices during 1999-2001. This secular trend will peak sometime between 2018 and 2020. (Last update: 29 June 2015)
Commodities,
as represented by the CRB Index, commenced a
secular BULL market in 2001 in nominal dollar terms. The first major
upward leg in this bull market ended during the first half of 2008, but
a long-term peak won't occur until 2018-2020.
(Last
update: 29 June 2015)
Copyright
Reminder
The commentaries that appear at TSI
may not be distributed, in full or in part, without our written permission.
In particular, please note that the posting of extracts from TSI commentaries
at other web sites or providing links to TSI commentaries at other web
sites (for example, at discussion boards) without our written permission
is prohibited.
We reserve the right to immediately
terminate the subscription of any TSI subscriber who distributes the TSI
commentaries without our written permission.
Outlook Summary
|
Market |
Short-Term (1-3 month) |
Intermediate-Term (6-18 month) |
Long-Term (2-5 Year) |
| Gold | N/A |
Bullish (10-Oct-16) |
Bullish |
| US$ (Dollar Index) | N/A |
Neutral (17-Aug-16) |
Neutral (19-Sep-07) |
| US Treasury Bonds (TLT) | N/A |
Bearish (19-Oct-15) |
Bearish |
| Stock Market (DJW) | N/A |
Bearish (19-Sep-16) |
Bearish |
| Gold Stocks (HUI) | N/A |
Bullish (10-Oct-16) |
Bullish |
| Oil | N/A |
Neutral (26-Oct-15) |
Bullish |
| Industrial Metals (GYX) | N/A |
Neutral (10-Oct-16) | Bullish |
4. Long-term views are determined almost completely by fundamentals and intermediate-term views
are determined by a combination of fundamentals, sentiment and technicals.
Last week's posts at the TSI Blog
"Price inflation" is not the biggest problem
Summary of current
thinking/positioning
1) Thinking that short-term
bottoms are in place for gold and the associated mining indices, but
expecting that the overall corrections will extend into Q1-2017 and that
multi-week rebounds from the recent lows will be followed by tests of the
lows.
2) Expecting that 2017-2018 will be a very bullish period for
commodities, but acknowledging that the early-2016 lows could be tested
prior to the start of the aforementioned bullish period. Gradually
building up long-term exposure to non-gold commodities and simultaneously
hedging against short-term weakness via EEM and USO put options.
3)
Thinking that the US stock market has commenced a meaningful 1-2 month
decline and positioned for such an outcome via QID call options.
4)
Thinking that the Dollar Index is close to a multi-week top, but concerned
that following some consolidation it will resume its advance and break
upward from its 20-month horizontal range.
5) Maintaining a large
cash reserve in recognition of the downside risk in almost all equities
(current cash percentage is around 50%), but looking for opportunities to
reduce cash and add to gold plus commodity exposure.
No Interim Update
this week
Please note that due to our
travel schedule there will be no Interim Update this week. We will,
however, send out an email alert if necessary.
Commodities
General
Our expectation since the beginning of this year has been for a choppy
recovery in commodity prices from major lows during the first quarter.
Also, we've speculated over the course of the year that in some commodity
markets the recovery will possibly include a test of the Q1-2016 lows
before a strong upward trend gets underway.
If there is going to be
a test of the Q1-2016 lows it will most likely happen in Q1-2017, although
it could happen anytime from November of this year through to mid-2017.
The most likely cause of the commodity-price weakness will be an upside
breakout and ensuing 2-4 month surge in the Dollar Index, although
industrial commodities could also be pressured downward by a stock-market
decline.
This year's price action in the commodity markets has
generally been in line with our expectations, although it's way too early
to declare victory. Not that it ever makes sense to declare victory in the
financial markets, since the struggle is never-ending.
Oil
The oil price made a marginal new high for the year last week. It
could move a little further into new-high territory (for the year) this
week, but in the absence of a pronounced turnaround in the Canadian dollar
(C$) a near-term move to new 2016 highs by the oil price should be viewed
as a selling opportunity.
In addition to the bearish divergence
between oil and the C$, the COT (Commitments of Traders) situation is a
reason to be concerned about short-term downside risk in the oil price.
The concern is that the speculative net-long position in NYMEX oil futures
surged over the past three weeks and is now at its highest level since oil
was trading at around $100 in Q3-2014.
A daily close below $49
would be an early-warning signal that oil has commenced a significant
downward correction. Once it begins, the correction will probably extend
at least as far as the high-$30s.

Natural Gas (NG)
NG was one of the weakest
commodity markets during the first two months of this year, but since
early-March it has been one of the strongest. We think that the rally from
the March low is the beginning of a cyclical bull market but that a
short-term top was put in place last week.
There will probably be a
few months of consolidation prior to the start of the bull market's second
leg.
Copper
Our most recent mention of copper was
in the 3rd October Weekly Update, when it was trading at US$2.21. At that
time we wrote:
"Considering the price action, the Commitments
of Traders data and the performances of other markets, it's likely that
the current multi-week rally will end near $2.25 and be followed by a
multi-week decline to $2.10 or lower."
The multi-week rally
ended at $2.22 (close enough) and the price has since dropped back to
$2.09.
As illustrated below, there is trend-line support at the
current price of $2.09 and short-term lateral support a little lower at
around $2.07. It therefore won't be surprising if a 1-2 week rebound soon
gets underway. However, lower prices are likely prior to a sustained turn
to the upside.
Taking into account nothing except for the chart pattern, a daily
close below $2.07 would suggest that copper was heading for a test of the
January-2016 bottom in the $1.90s and a daily close above $2.23 (not
expected, but not out of the question) would suggest that the short-term
danger had passed.
The Stock Market
Conflicting Sentiment
Apart from a brief burst of fearfulness in the immediate aftermath of
the "Brexit" vote in late-June, US stock market sentiment has been
complacent over the past 7 months. At no stage has there been the rampant
optimism of early-2000, but it has been clear that the average market
participant expected nothing bad to happen. This is still the case,
despite there being some good reasons to be concerned about downside risk.
It's a different story outside the US, though.
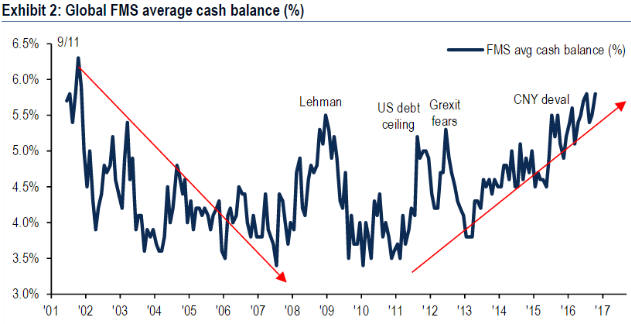
The following chart
was extracted from an
18th October article at Bloomberg. It is based on a global survey of
fund managers with at least $500B of assets under management and reveals
that the average cash balance of these fund managers is presently at the
highest level since shortly after the September-2001 terrorist attacks. In
other words, it seems that on a global basis fund managers are unusually
cautious right now.
Sentiment is a contrary indicator, so while the sentiment situation in
the US has bearish connotations the sentiment situation outside the US has
bullish connotations.
Conflicting Price Action
Sentiment usually follows price. Therefore, considering the different
sentiment situations inside and outside the US it is not surprising that
the US stock indices look 'toppy' and some important stock indices outside
the US appear to be completing long-term bases.
Here is a chart of
the US S&P500 Index (SPX) showing important lateral support at 2120.
Closing below 2120 would complete a topping pattern.
The SPX has shown remarkable resilience over the past two weeks in
that the 'bears' have not only been unable to push it through 2120,
they've also had difficulty pushing it down to near 2120. The reason for
the difficulty is probably explained by the trend-line drawn on the above
chart. This trend-line dates back to the January low and appears to be
acting as support.
There's currently a lot at stake, because if the
SPX simply closes more than 1% below its present level it will be
difficult for any objective technical analyst to argue that the upward
trend from the January-2016 bottom is still intact.
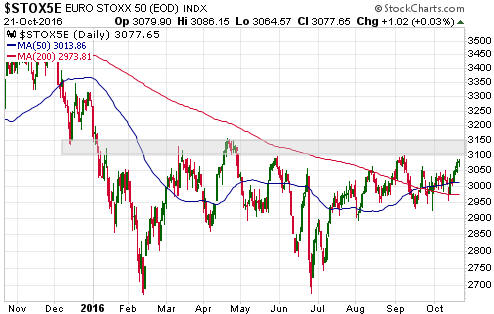
Now take a look
at the following chart of the EURO STOXX 50 Index (STOX5E). This chart
shows a potential basing pattern with resistance at 3100-3150.
If
the STOX5E closes more than 3% above its present level it will complete a
base capable of supporting a substantial rally.
This week's
significant US economic events
[Notes:
1) The most important events
(to the markets) are shown
in bold. 2) A list of global economic events can be found
HERE]
| Date | Description |
| Monday October 24 | No important events scheduled |
| Tuesday October 25 |
Economic Confidence Case-Shiller Home Price Index |
| Wednesday October 26 | New Home Sales |
| Thursday October 27 |
Durable Goods Orders Pending Home Sales |
| Friday October 28 |
Q3 GDP (preliminary
estimate) Employment Cost Index |
Gold and the Dollar
The price action is the other reason for the uncertainty as to whether
this year's rally marked the start of a cyclical bull market. We are
referring to the fact that of all the rallies in gold and the gold-mining
indices from multi-year lows, this year's rally is most similar to the
bear-market rebound of 1982-1983.
The gold rally that began in
December of 2015 will differentiate itself from the 1982-1983 bear-market
rebound if the gold price closes above its July-2016 peak AND the HUI
closes above its August-2016 peak.
Fortunately, you don't need to
be a fervent believer in the 'new gold bull market' story to make money
from the rallies in gold and gold stocks. You will just be a bit more
cautious than the bulls with blind faith.
*Five
of the six "true fundamentals" were mentioned in the September-2015 TSI
blog post linked
HERE. The sixth is the general trend in commodity prices as indicated
by a broad-based commodity index such as GNX.
Current Market Situation
Gold's
price action leaves open the possibility that there will soon be a quick
decline to support in the low-$1200s to end the short-term downward trend.
The main reason to suspect that this is not going to happen and that a
short-term bottom was put in place at $1243 on 7th October is the
performance of the gold-mining sector.
We caution against expecting much from gold over the remainder of this
year. Short-term downside risk is no longer a big concern, mainly because
the price action of the past few weeks has substantially reduced the
collective net-long position of leveraged speculators in gold futures. The
speculative net-long position will probably shrink some more before the
correction is over, but it no longer constitutes a threat. At the same
time, with the 'true fundamentals' neutral-to-slightly-bearish it isn't
likely that the gold price will make a solid break above resistance in the
low-$1300s anytime soon.
Our guess is that gold will spend most of
the time between now and year-end in the $1250-$1300 range, with moves
outside this range being short-lived.
Platinum
Platinum is the precious metal with the best intermediate-term
risk/reward. This is due to the potential for a supply shock within the
next year and the fact that the platinum price is near multi-decade lows
in real terms and relative to gold.
Apart from a brief period in
1982, since 1970 the price of platinum has never been lower relative to
the price of gold than it is today. The following chart shows platinum
relative to gold since 1980. There are plausible scenarios under which
platinum could become cheaper, but when you get a chance to buy a useful
and much-sought-after commodity near a 50-year low in relative terms and
real (inflation-adjusted) terms, it is generally a good idea to grab the
opportunity.
We have begun to grab the opportunity and late last week made the
first purchase of physical platinum* for our own accounts. We have no idea
if the platinum price has hit rock bottom. In fact, if we had to bet one
way or the other we'd bet that it will trade lower within the next few
months, but there's no good reason to make such a bet. Instead, by taking
an initial position (in this case about one-third of a full position) we
cover ourselves against the possibility that a substantial rally is about
to begin while hoping for a chance to add to the position at lower prices.
With regard to how much lower the price could get, now that support at
$950 has given way a test of the December-January lows near $825 is a
realistic possibility. However, if a test of the lows of the past 12
months is going to happen it will likely wait until early next year. In
the interim there will probably be a multi-week rebound.
*The simplest way to get exposure to physical
platinum is via an ETF. Examples are PPLT on the NYSE and ETPMPT on the
ASX.
Gold Stocks
The following two
paragraphs from last week's Interim Update are worth repeating:
"The
fact that the HUI has quickly made it back to near important former
support (now resistance) means the chances have improved that a
multi-month bottom was put in place over the past two weeks at 195. In
other words, while a quick spike to a new low is still possible, it is now
more likely that the 1-2 month rebound that we've been anticipating has
begun. As previously explained, this rebound is expected to form part of a
corrective process that extends into the first quarter of 2017.
Note that even if a short-term bottom is in place for the HUI it isn't
reasonable to expect significant additional gains within the coming few
days. This is because the quick rebound to the breakdown area (220-225) is
likely to generate a wave of selling by traders who were caught off-guard
by the plunge from the 220s down to the 190s. That is, some consolidation
is likely over the days ahead even if a 1-2 month rally is underway."
Some consolidation is what we got over the final two days of last
week. As illustrated by the daily chart displayed below, the HUI ended the
week with two small down-days while remaining above its 20-day MA.
There is likely to be at least one test of the October low, but the
historical record suggests that there will be a few more weeks of rallying
before the HUI starts making its way back to the 190s.
The HUI has
resistance at 220-225 and then at the 50-day MA near 230. In other words,
there are significant obstacles immediately ahead that could stop the
rally. However, resistance at 250 is the most likely target for the next
multi-week top. That's regardless of whether the advance from the
January-2016 bottom turns out to be the first leg of a bull market or a
strong bear-market rebound.
The Currency Market
The Euro
The ECB's current
asset monetisation program has a 'soft' end date of March-2017, but the
general expectation is that the program will be extended. Depending on
what happens in the meantime, an extension would likely occur via a
gradual tapering of the asset purchases. ECB chief Draghi intimated as
much in a press conference last week.
One of the major economic
problems facing the euro-zone is that Draghi and his ECB cohorts truly
believe that their policies are working. It doesn't matter how bad things
get, the belief is that they would be even worse if not for the ECB's
money-pumping and interest-rate suppression. That's why the situation is
hopeless.
Considering the ECB's actions and the fundamental
backdrop, the euro has held up remarkably well. There was a marginal
downside breakout last Friday when the euro closed below its late-June
low, but the following chart shows that it remains well within the
confines of the channel that dates back to the March-2015 bottom.
We don't have a strong opinion on what the euro will do over the weeks
ahead, but our guess is that it will work its way down to the channel
bottom at 106-107.
The Commodity Currencies
We
discussed the A$ and the C$, the senior "commodity currencies", in last
week's Interim Update. We just wanted to point out that the A$ was unable
to sustain last Wednesday's upside breakout and the C$ is now very close
to a downside breakout.
Therefore, the currency market is
continuing to warn of short-term weakness (meaning: warning of significant
downside within the next couple of months, not necessarily the next few
days) in the commodity markets. The warning will become stronger if the C$
closes below 74.5 and the A$ closes below 75.0.
Here's an updated
chart of the C$.
Updates
on Stock Selections
Notes: 1) To review the complete list of current TSI stock selections, logon at
http://www.speculative-investor.com/new/market_logon.asp
and then click on "Stock Selections" in the menu. When at the Stock
Selections page, click on a stock's symbol to bring-up an archive of
our comments on the stock in question. 2) The Small Stock Watch List is
located at http://www.speculative-investor.com/new/smallstockwatch.html
![]() Company
news/developments for the week ending Friday 21st October 2016:
Company
news/developments for the week ending Friday 21st October 2016:
[Note: AISC = All-In Sustaining Cost, FS = Feasibility Study, FY =
Financial Year, IRR = Internal Rate of Return, ISR = In-Situ Recovery,
MD&A = Management Discussion and Analysis, M&I = Measured and Indicated,
NAV = Net Asset Value, NPV(X%) = Net Present Value using a discount rate
of X%, P&P = Proven and Probable, PEA = Preliminary Economic Assessment,
PFS = Pre-Feasibility Study]
*Alkane Resources
(ALK.AX), a company with a Feasibility-stage specialty-metals
project (the Dubbo Zirconia Project - DZP) and an operating gold mine in
Australia, issued its annual report for the financial-year ending 30th
June 2016. The balance sheet included in the report showed that ALK had no
debt, A$28M of working capital and A$190M (A$0.38/share) of net assets at
30th June.
In FY2017, ALK is expected to produce 65K-72K ounces of
gold at an AISC of A$1200-$1300/oz (US$912-$988/oz) and advance its
specialty-metals project to a construction decision.
ALK's price is
up by more than 150% since the stock was added to the TSI List only three
months ago. Some profit-taking would be appropriate for risk-management
purposes, but there is additional upside potential associated with the
DZP.
*Euro Sun Mining (ESM.TO) advised
that it has been granted an exploration permit for an area called
"Stanija" located approximately three kilometres east of the company's
Rovina Valley gold-copper project in Romania. The area is considered to be
highly prospective for gold-copper porphyry-style mineralisation.
Of greater importance is the pending ratification of the mining license
for Rovina Valley. This most likely won't happen until after Romania's
legislative elections are held on 11th December, but getting the
ratification doesn't appear to hinge on any particular election outcome.
In addition to finalising its mining permit, ESM is working on a
feasibility study for Rovina Valley. The FS is expected to take the bulk
of next year to complete.
*Evolution Mining (EVN.AX)
announced that it is buying the Marsden copper-gold project from Newcrest
Mining. Despite Marsden's sizable global resource comprising 1.5B pounds
of copper and 1.1M ounces of gold, the acquisition cost is small.
Specifically, EVN is making an upfront of A$3M and has committed to pay an
additional A$7M if/when a production decision is made.
The Marsden
project is located next to the tenement package for EVN's Cowal gold mine
in NSW, Australia. It could enable the life of the Cowal mine to be
extended, in that the Cowal milling circuit and associated infrastructure
could potentially be used to treat ore from Marsden after the Cowal
resource has been depleted.
This is a reasonable deal for EVN.
EVN also published its quarterly report for the September-2016
quarter. There were no surprises in the report, with production (205K
ounces) and costs (AISC of A$1060/oz) in line with guidance.
At
30th September the company had A$435M of cash and A$195M of debt, but the
balance sheet will undergo a big change this quarter due to the payment of
A$880M for the purchase of the Ernest Henry stake from Glencore. Assuming
similar cash generation by its operations in Q4-2016 as occurred in
Q3-2016, we estimate that EVN will end the year with net debt of around
A$550M (for example, A$670M of debt and $120M of cash). Considering EVN's
likely future cash-flow, this amount of debt is not a problem.
*Premier Gold (PG.TO) reported that it produced 30K
ounces of gold during the September quarter (its first quarter as a gold
producer), which is higher than planned and is therefore a good result.
This production comes from PG's JV with Barrick Gold at the South Arturo
project in Nevada. PG has a 40% stake in the project and is therefore
entitled to 40% of the production.
During the December quarter PG
will have two gold-producing assets -- the South Arturo mine and the
recently-acquired Mercedes mine. The company's total gold production
during 2016 is expected to be 100K-110K ounces, meaning that production is
expected to be 70K-80K ounces during the final quarter.
Judging by
the performance of PG's shares, there is a lot of concern in the market
about the economic viability of the Trans-Canada (TC) gold project in
Ontario. This project is a 50/50 JV with Centerra Gold and is in the final
stages of a Feasibility Study.
Due mainly to delays in the
completion of the FS we also have concerns about the economics of the TC
project. However, this project is a much smaller part of PG now than it
was a couple of years ago. Furthermore, we think that the current stock
price is fully justified by PG's other assets, which should mean that
there is now more upside than downside risk associated with the TC
project's FS.
*Petrus Resources (PRQ.TO)
reported that it recently drilled three new wells, one of which has been
brought into production. The newly-producing well has taken PRQ's total
production to 8100 boe/d (barrels of oil equivalent per day), which is
roughly what the company was producing before selling its Peace River
assets for $30M a few months ago.
With the two other
recently-drilled wells soon to be brought on-stream, PRQ expects to end
the year with total production of 9000 boe/d.
PRQ's operational
performance continues to be good. At the same time, it continues to be
ignored by the stock market.
![]() List
of candidates for new buying
List
of candidates for new buying
From within the ranks of TSI
stock selections the best candidates for new buying at this time, listed
in alphabetical order, are:
1) AAU near US$1.00 (last Friday's
closing price: US$1.25)
2) EVN.AX near A$2.00 (last Friday's
closing price: A$2.28)
3) PG.TO (last Friday's closing price:
C$3.41)
4) PRQ.TO (last Friday's closing price: C$1.97)
5)
RMS.AX (last Friday's closing price: A$0.46)
Note that the above
list is limited to five stocks. It will sometimes contain less than five,
but it will never contain more than five regardless of how many stocks are
attractively priced for new buying.
Chart Sources
Charts appearing in today's commentary
are courtesy of:
http://stockcharts.com/index.html
http://research.stlouisfed.org/