|
-- Weekly Market Update for the Week Commencing 24th November 2014
Big Picture
View
Here is a summary of our big picture
view of the markets. Note that our short-term views may differ from our
big picture view.
In nominal dollar terms, the BULL market in US Treasury Bonds
that began in the early 1980s ended in 2012. In real (gold)
terms, bonds commenced a secular BEAR market in 2001 that will continue
until 2018-2020. (Last
update: 20 January 2014)
The stock market, as represented by the S&P500 Index,
commenced
a secular BEAR market during the first quarter of 2000, where "secular
bear market" is defined as a long-term downward trend in valuations
(P/E ratios, etc.) and gold-denominated prices. This secular trend will bottom sometime between 2014 and 2020.
(Last update: 22 October 2007)
A secular BEAR market in the Dollar
began during the final quarter of 2000 and ended in July of 2008. This
secular bear market will be followed by a multi-year period of range
trading.
(Last
update: 09 February 2009)
Gold commenced a
secular bull market relative to all fiat currencies, the CRB Index,
bonds and most stock market indices during 1999-2001.
This secular trend will peak sometime between 2014 and 2020.
(Last update: 22 October 2007)
Commodities,
as represented by the Continuous Commodity Index (CCI), commenced a
secular BULL market in 2001 in nominal dollar terms. The first major
upward leg in this bull market ended during the first half of 2008, but
a long-term peak won't occur until 2014-2020. In real (gold) terms,
commodities commenced a secular BEAR market in 2001 that will continue
until 2014-2020.
(Last
update: 09 February 2009)
Copyright
Reminder
The commentaries that appear at TSI
may not be distributed, in full or in part, without our written permission.
In particular, please note that the posting of extracts from TSI commentaries
at other web sites or providing links to TSI commentaries at other web
sites (for example, at discussion boards) without our written permission
is prohibited.
We reserve the right to immediately
terminate the subscription of any TSI subscriber who distributes the TSI
commentaries without our written permission.
Outlook Summary
Market
|
Short-Term
(1-3 month)
|
Intermediate-Term
(6-18 month)
|
Long-Term
(2-5 Year)
|
|
Gold
|
N/A |
Bullish
(26-Mar-12) |
Bullish
|
|
US$ (Dollar Index)
|
N/A |
Neutral
(29-Sep-14) |
Neutral
(19-Sep-07) |
|
US Treasury Bonds (TLT)
|
N/A |
Neutral
(18-Jan-12)
|
Bearish |
|
Stock Market
(DJW)
|
N/A |
Bearish
(28-Nov-11) |
Bearish
|
|
Gold Stocks
(HUI)
|
N/A |
Bullish
(23-Jun-10) |
Bullish
|
|
Oil |
N/A |
Neutral
(31-Jan-11) |
Bullish
|
|
Industrial Metals
(GYX)
|
N/A |
Neutral
(15-Sep-14) |
Bullish
(28-Apr-14) |
Notes:
1. Our short-term expectations are discussed in the commentaries, but except in
special circumstances we won't attempt to assign a "bullish", "bearish" or
"neutral" label to these expectations.
2. The date shown below the current outlook is when the most recent outlook change occurred.
3. "Neutral" means that we think risk and reward are roughly in balance with respect to the timeframe in question.
4. Long-term views are determined almost completely by fundamentals and intermediate-term views
are determined by a combination of fundamentals, sentiment and technicals.
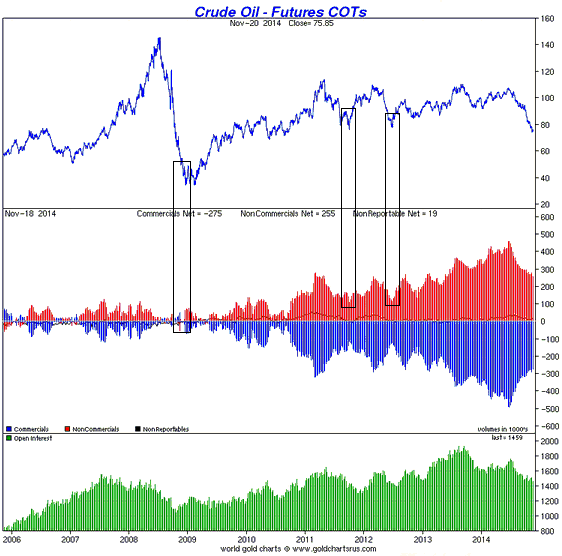
Speculators
too bullish on oil
Compared to the prices of other commodities, we think that
$70-$75/barrel is a reasonable price for oil at this time.
Therefore, from our perspective the sharp decline in the oil price
over the past few months has been a catch-up move that has brought
this particular commodity into line with commodities in general.
There are, however, three reasons to believe that while the oil
price could be close to a short-term bottom, it is probably not yet
close to an intermediate-term bottom.
Two of these reasons were outlined in the 17th November Weekly
Update. They are: 1) unlike the bearish trends in the many other
commodity markets, the bearish trend in the oil market is still
young, and 2) relative to the Industrial Metals Index, the oil price
is still 10%-15% above the level at which it has most often bottomed
over the past 10 years. The third reason is sentiment. More
specifically, the Commitments of Traders (COT) data indicate that
speculators are currently far more bullish on oil's prospects than
they have been at previous intermediate-term bottoms.
The following chart from
Sharelynx.com illustrates what we are talking about. The chart
compares the oil price with the net oil-futures positions of
speculators (the red bars) and commercial traders (the blue bars).
Notice that speculators a) were briefly net-short oil futures at the
major price bottom in Q4-2008, b) were net-long by about 120K
contracts at the 2011 and 2012 correction lows, and c) are presently
net-long by 255K contracts. The chart's message is that before a
sustainable price bottom is put in place there will probably be
sufficient additional price weakness to cut the speculative net-long
position in oil futures by at least another 50%.
The resilience of speculative bullishness on oil probably stems from
the fact that the bearish price trend is young. Whereas speculative
capitulation has already happened in other commodity markets, it
still lies ahead in the oil market.
The Stock
Market
Last Friday was one of the strangest trading
days in years. In reaction to a few words from ECB chief Mario Draghi (discussed
in the Gold section of this report), the euro plunged and almost everything else
in the world went up; not just in euro terms, but in US$ terms. The US stock
market was up, European stocks were up, emerging-market equities were up, gold
and all of the other metals for which there are liquid futures markets were up,
oil was up, and the T-Bond was up. Even the Yen was up!
When was the last time that the S&P500, the T-Bond, the Dollar Index, the Yen
and gold were all up on the same day and how many times has it happened over the
past 5 years? Anybody know the answer?
We are aware that many articles in the financial press cited a surprise 0.25%
rate cut by the People's Bank of China as the main catalyst for Friday's market
action. Although fundamentally irrelevant this undoubtedly did put some upward
pressure on prices, but the China news arrived during Asian trading and had
little effect on the major futures markets. It was the ECB news later in the day
that seemed to light a fire under the most important markets.
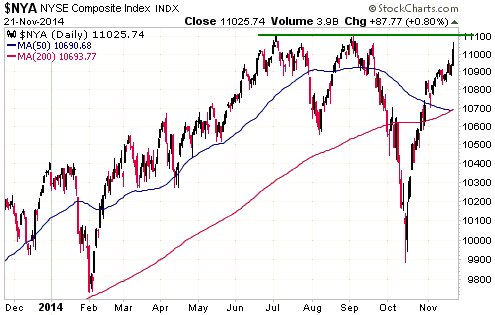
The S&P500 continues to look bullet-proof and made another new all-time high
last Friday, but the US stock market continues to be rife with divergences that
signal danger ahead. For example:
1) The NYSE Composite Index (NYA) has still not exceeded its July-September
double top.
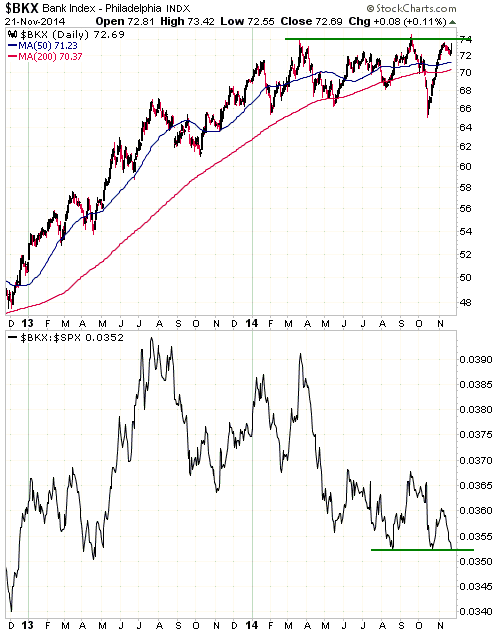
2) The Bank Index (BKX) is yet to break above its March-2014 high. Moreover, the
BKX/SPX ratio is testing its lows of the past few months and is threatening to
break to a new 18-month low. Note that a downside breakout by BKX/SPX would be
bullish for gold.
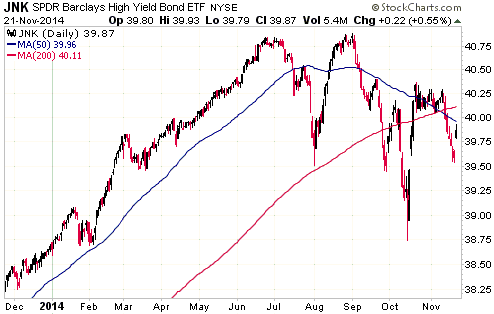
3) High-yield bond funds such as JNK and HYG are well below the highs made
during June-September of this year.
4) The number of individual stocks making new 12-month highs is remarkably low
considering the performances of the senior stock indices.
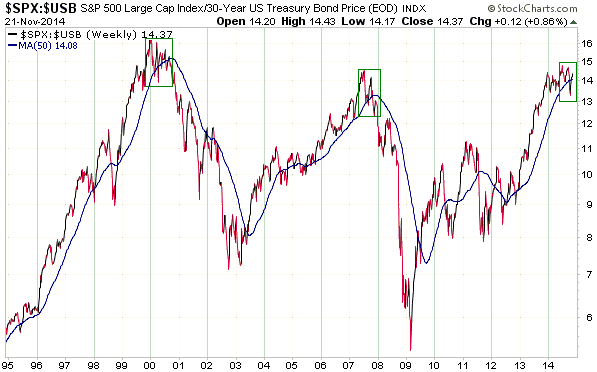
On a long-term basis, the current position of the SPX/USB ratio (the S&P500
Index divided by the T-Bond price) is similar to its position near the major top
in Q1-2000. As illustrated by the following weekly chart, there has been a break
below the 50-week MA and then a rise to a lower high.
This week's
significant US economic events
(The most important events are shown
in bold)
| Date |
Description |
| Monday Nov 24 |
Dallas Fed Mfg Survey | | Tuesday
Nov 25 |
Q3 GDP (revised)
Case-Shiller Home Price Index
Consumer Confidence | | Wednesday
Nov 26 |
Durable Goods Orders
Personal Income and Spending
New Home Sales
Consumer Sentiment
Pending Home Sales | | Thursday
Nov 27 |
All US markets closed
|
| Friday Nov 28 |
Chicago PMI |
Gold and
the Dollar
Gold
Why gold's long-term bull market is not over
"We will do what we must to raise inflation and inflation expectations as
fast as possible, as our price-stability mandate requires," ECB president
Mario Draghi said at a conference in Frankfurt on Friday. Shorter-term inflation
expectations "have been declining to levels that I would deem excessively low,"
he also said.
He went on to say: "There is a combination of policies that will work to
bring growth and inflation back on a sound path. If on its current trajectory
our policy is not effective enough to achieve this, or further risks to the
inflation outlook materialize, we would step up the pressure and broaden even
more the channels through which we intervene, by altering accordingly the size,
pace and composition of our purchases."
Which means that it is official: Mario Draghi is a complete moron.
We now have the head of the BOJ overtly attempting to trash the Yen and the head
of the ECB desperately looking for politically-acceptable ways in which he can
trash the euro. This causes the US Fed to temporarily look prudent, but have no
fear -- the Fed will start taking new measures to trash the US$ a few months
into the next bear market in US equities.
It's not so much that modern central bankers, when faced with a weakening
economy, don't know what to do other than create more money in a ridiculous
effort to raise prices, as if a higher cost of living is what the average wage
earner really needs at a time when the economy is struggling. It's that they
genuinely believe that when they take actions designed to depreciate money and
distort the price signals upon which investment decisions are based they are
acting in the best interests of the broad economy. They are 100% committed to
counterproductive policies.
Despite the price action of the past two years, this all but guarantees that
gold's long-term bull market is not over.
Current Market Situation
Triple bottoms are rare, so when gold dropped to the vicinity of its June-2013
and December-2013 bottoms in early-October of this year and then rebounded, in
the process creating a 'triple bottom' at around $1180, an eventual break below
$1180 became likely. At the time we thought that a breach of the 'triple bottom'
would wait until the first half of 2015, thus postponing the end of gold's
cyclical bear market until then. However, when the breach occurred at the end of
October it became more likely that a bear-market bottom would be put in place
during October-November of this year. Furthermore, the fact that gold was able
to reverse course and move back above $1180 two weeks after breaking below this
important support level makes the preceding downside breakout look false. This
is evidence that a bear-market bottom is in place.
Silver, on the other hand, is in a weaker position, having broken below major
support in September and having subsequently failed to rebound far enough to
even test its breakdown. There is therefore no evidence, yet, that silver's bear
market is over.
As we've explained in the past, it would not be unprecedented for gold's bear
market to end several months earlier than silver's bear market, as this is
exactly what happened in 2001. As we've also explained in the past, it is
typical for gold to outperform silver during the first two years of a cyclical
precious-metals bull market.
The US$ gold price continued to rebound last week and has now achieved
consecutive weekly closes above the $1180 (+/- $2) major demarcation level. As
noted above, this suggests that the preceding downside breakout was a 'fakeout'.
The gold price has also broken above its 20-day MA, which acted as resistance
near the end of the week before last, but reversed downward last Friday after
touching its 50-day MA. At a superficial level this suggests that as things
currently stand the November rebound in the gold price is no different from the
October rebound, which was followed by a multi-week plunge to new bear-market
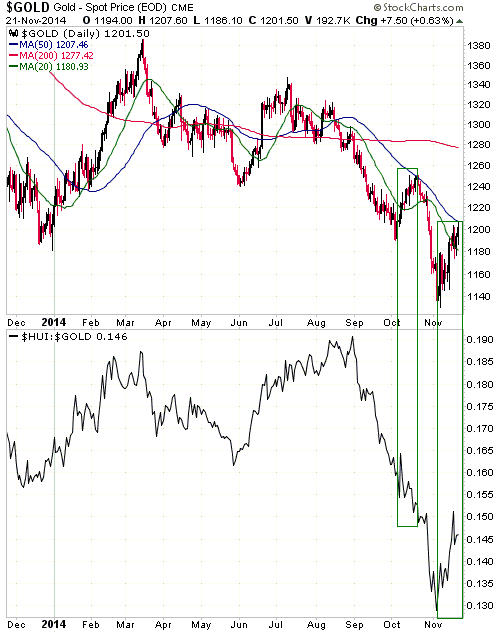
lows. However, with reference to the following daily chart, note the big
difference between the performance of the HUI/gold ratio during the October
rebound and its performance during the November rebound. This indicates that the
rally from the November low will probably evolve into something more substantial
than a counter-trend bounce.
With gold not yet close to being 'overbought' on even a short-term basis, we
suspect that the market will make some additional headway over the next 1-2
weeks. As noted in previous commentaries, we view $1210-$1240 as a likely range
for a multi-week top.
Gold Stocks
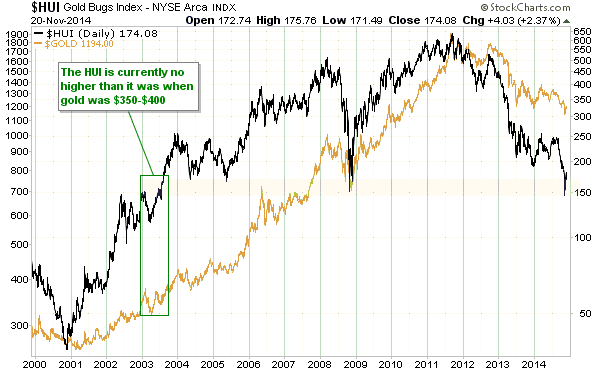
How cheap are gold stocks, really?
At its recent low the HUI was trading at the same price at which it traded way
back in 2003-2004, when the gold price was $350-$400/oz. On the surface, this
suggests that at their recent lows the senior gold-mining stocks that dominate
the HUI were absurdly under-valued relative to gold, given that gold was trading
at around $1150/oz at the time. Just how extreme was the under-valuation?
According to the article posted
HERE,
the HUI's under-valuation was so extreme it was completely irrational. For
example, the article contains the following statements:
"While gold stocks indeed should've been sold with gold weaker, the magnitude
of selling they suffered was far beyond anything justifiable fundamentally. This
ultimately culminated in the latest gold-stock capitulation where the HUI
plunged to 11.3-year lows! Think about that a second. Gold stocks were just
trading at prices not seen since July 2003. Pretty much the entire secular
gold-stock bull had been fully erased."
And: "... [the] entire not-widely-followed gold-stock bull was based on the
massive fundamental boost to gold-mining profits that gold's own secular bull
created. So if the recent gold-stock price levels were righteous, gold too
should have been pounded back down towards its mid-2003 levels. Where was gold
trading back then? Merely right around $350!"
And: "Do gold stocks deserve to trade today as if gold was at just $350? Heck
no! Last week when gold stocks' latest capitulation low was carved, the gold
price was up near $1150. That was 3.3x higher than the last time the gold stocks
traded at recent levels! It makes no fundamental sense whatsoever for gold
stocks to trade as if gold was at $350 when it was actually $1150. Their core
fundamentals are now vastly better."
The analysis encapsulated in the above excerpts is superficial and misleading,
for two main reasons. First, production costs are vastly higher now than they
were in 2003-2004. Second, although the stock prices of the senior gold miners
are, on average, not much higher now than they were when gold was trading at
$350-$400/oz, their market capitalisations are hundreds of percent higher thanks
to massive inflation of share quantities. Consequently, a good argument can be
made that the "core fundamentals" are now worse than they were when the gold
price was $350-$400.
We'll now consider the specific case of Goldcorp (GG) to back-up our point.
During the quarter ended 30th September 2003, GG managed to achieve a net profit
of $0.13/share, a net operating margin of 44% and a return on invested capital (ROIC)
of 22%. These results were achieved at an average realised sale price of
$364/oz. During the quarter ended 30th September 2014 GG's average realised sale
price was $1266/oz, but the company reported a net LOSS of $0.05/share and was
too embarrassed to highlight the ROIC. Note that there were no large asset
writedowns in the latest quarter. GG was simply not profitable at $1266/oz in
Q3-2014 after being very profitable at $364/oz way back in Q3-2003. And by the
way, from Q3-2003 to Q3-2014 GG's share count rose from 183M to 814M, so
although its share price is up by 'only' about 50%, its market cap is up by
about 580% over the period in question.
We selected GG for our quick-and-dirty case study because it has been one of the
best-managed of the senior gold producers and has had less company-specific
problems than some of its brethren. Had we chosen either Barrick Gold (ABX) or
Kinross Gold (KGC) our point could have been made even more clearly, because the
amount of wealth destroyed by these companies via ill-conceived acquisitions and
project developments is mindboggling.
It's important that fundamentals-oriented speculators who buy gold-mining stocks
have their eyes wide open and understand the reality of the current situation.
There are some good reasons to anticipate large gains in gold-stock prices over
the coming 2 years involving a rising gold price, declining production costs and
improving sentiment, but at the current gold price and with their current cost
structures most gold producers are NOT particularly cheap by traditional
valuation standards.
Therefore, don't be hoodwinked by superficial comparisons into believing that
gold stocks are now priced for a hundreds-of-dollars-per-ounce lower gold price
and, as a consequence, that massive gains lie ahead for gold stocks even if the
gold price flat-lines or continues to fall.
Current Market Situation
The gold-mining stocks, as represented on the following chart by the HUI, have
been strong relative to gold bullion since the early-November bottoms in gold
and the HUI. However, there was a minor bearish divergence between the HUI and
gold last Friday, with gold making a marginal new high for the move while the
HUI never traded above the high made earlier in the week.
A plausible explanation for Friday's relatively poor performance by the HUI is
gold's reversal after touching its 50-day MA. As mentioned above, gold's
intra-day reversal from its 50-day MA means that on the surface the November
rebound in the gold price now looks like the October rebound in the gold price.
There is probably some concern that, as was the case in October, the touch of
the 50-day MA will be followed by a plunge to new multi-year lows.
A plunge over the weeks immediately ahead to new multi-year lows is not
impossible, but it is unlikely. The main reason is that as also mentioned in the
gold section above, the HUI/gold ratio's performance has been far more bullish
during the November rebound.
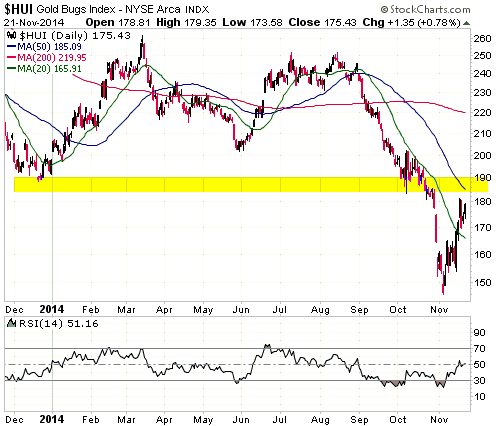
We continue to view 185-190 as a reasonable target-range for the HUI's initial
rally.
The Currency Market
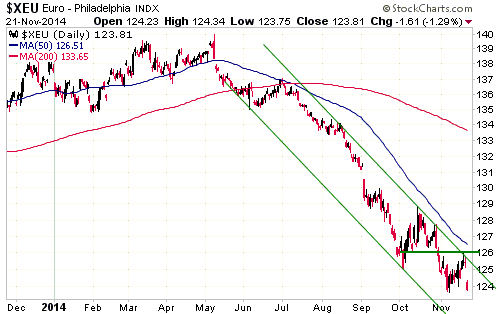
The euro fell sharply last Friday in response to Draghi's promise to do whatever
it takes to create more "inflation" in the euro-zone, although it didn't make a
new low. There could be some follow-through to the downside this week, but we
continue to believe that the euro is close to a bottom that will hold for at
least three months and that there is a good chance of a tradable euro rally
fueled by speculative short-covering.
As a result of last week's price action, the top of the euro's short-term
downward-sloping channel is more clearly defined. It is now clear that a daily
close above 126 would confirm a trend reversal.
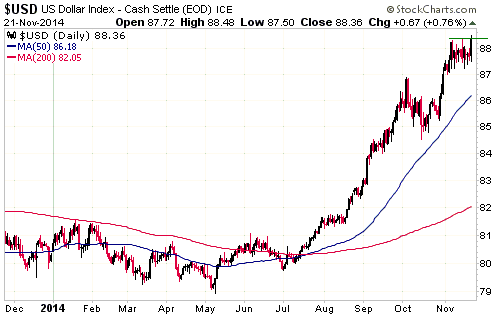
The euro's plunge last Friday pushed the Dollar Index back to, but not through,
the high of the preceding week. The Dollar Index closed the 21st November
trading session exactly at its 14th November intra-day high.
As a result of last week's price action, we would now take a daily close below
87.2 (up from 86.8) as confirmation of a short-term trend reversal.
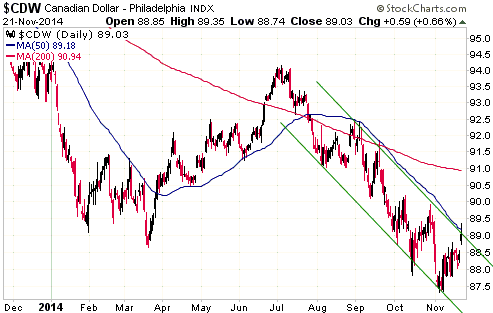
As is the case with the euro, last week's price action helped to define the top
of the downward-sloping channel for the Canadian Dollar (C$). For a price
channel to have any significance it must be defined by at least 5 points -- at
least 2 points on one side and at least 3 points on the other side. Due to last
Friday's price action, the C$'s short-term downward-sloping channel is now
defined by 8 points.
For the C$, a daily close above 89.5 would be a clear signal of a trend
reversal.
Updates
on Stock Selections
Notes: 1) To review the complete list of current TSI stock selections, logon at
http://www.speculative-investor.com/new/market_logon.asp
and then click on "Stock Selections" in the menu. When at the Stock
Selections page, click on a stock's symbol to bring-up an archive of
our comments on the stock in question. 2) The Small Stock Watch List is
located at http://www.speculative-investor.com/new/smallstockwatch.html
 Company
news/developments for the week ended Friday 21st November 2014: Company
news/developments for the week ended Friday 21st November 2014:
[Note: AISC = All-In Sustaining Cost, FS = Feasibility Study, IRR = Internal
Rate of Return, MD&A = Management Discussion and Analysis, M&I = Measured and
Indicated, NAV = Net Asset Value, NPV(X%) = Net Present Value using a discount
rate of X%, P&P = Proven and Probable, PEA = Preliminary Economic Assessment,
PFS = Pre-Feasibility Study]
*Pretium Resources (PVG) advised that it has hired AMEC to provide
the engineering, procurement and construction management (EPCM) services for the
Brucejack high-grade gold project in Northern British Columbia. AMEC is an
international engineering and project management firm with recently completed
mining projects in British Columbia, including New Gold's New Afton Mine. Like
PVG's proposed Brucejack mine, New Afton is an underground development.
The initial capex for Brucejack is estimated to be about $750M. If PVG takes the
project through construction on its own, that is, if PVG is not acquired by a
larger mining company prior to entering the construction phase, it will
therefore have to raise about $800M (including working capital). This money
would probably raised by issuing debt and equity, but the equity component would
be costly if the new shares were issued with the stock price near its current
level. Ideally, therefore, PVG's management will wait for improved market
conditions before raising the money needed to build the Brucejack mine.
*True Gold Mining (TGM.V) provided an update on its
under-construction Karma gold mine in Burkina Faso. To date, about 40% of the
$131M initial capex estimate has been spent or committed, and all aspects of the
project are apparently on budget and on schedule for the commencement of
production at the end of 2015. Gold production is expected to be 150K ounces in
2016.
The company has more than enough cash and undrawn credit to take the project
through to production, so the current low stock price and difficult market
environment doesn't create a funding problem for TGM.
One of the most important objectives for TGM over the next few months is to
carry out sufficient infill drilling to upgrade the resources at the North Kao
deposit from Inferred to M&I status. If this can be done it should enable the
mining of North Kao to be incorporated into the overall mine plan, which, based
on a recent PEA, would increase the project's NPV(5%) by $70M (about $0.17 per
TGM share) assuming a gold price of $1250/oz.
List of candidates for new buying
From within the ranks of TSI stock selections the best candidates
for new buying at this time, listed in alphabetical order, are:
1) AAU (last Friday's closing price: US$1.06).
2) EDV.TO (last Friday's closing price: C$0.54).
3) EVN.AX (last Friday's closing price: A$0.53).
4) RSG.AX (last Friday's closing price: A$0.24).
5) TGD (last Friday's closing price: US$1.06).
Note that the above list is limited to five stocks. It will
sometimes contain less than five, but it will never contain more
than five regardless of how many stocks are attractively priced for
new buying.
Updates to
Small Stocks Watch List (SSWL)
The SSWL contains stocks that are too small and/or too illiquid to
be included in the TSI Stocks List, but appear to have substantial
upside potential. Although we don't follow these stocks closely via
the TSI commentaries, they could be of interest to risk-tolerant
speculators capable of doing their own company research.
Here are some changes and updates to the SSWL membership:
1. Dragon Mining (DRA.AX) and Nevada Sunrise Gold (NEV.V) are, we
think, the most interesting stocks in the SSWL at this time. DRA is
trading at only 50% of the value of its cash in the bank, but it is
producing gold at the rate of 50K-60K ounces/year from operations in
Scandinavia and has done a good-enough job of reducing costs that it
is now marginally cash-flow positive. NEV owns 21% of the
high-potential Kinsley Mountain gold project being explored by Pilot
Gold. 21% of Kinsley could end up being worth many times NEV's
current market cap.
2. Frontier Rare Earths (FRO.TO) is trading slightly below the value
of the cash on its balance sheet, which means that its Zandkopsdrift
REE (Rare Earth Elements) project in South Africa is being assigned
no value by the stock market. We'll make a decision on whether or
not FRO stays in the SSWL based on the results of the Zandkopsdrift
PFS, which are scheduled to published in Q1-2015.
3. Geomega Resources (GMA.V) was added to the SSWL in recognition of
the potential value of its Montviel REE project in Quebec and the
new technology it was developing to separate the different REEs. It
has now been removed, because the company's senior management
appears to have lost the plot and inexplicably shifted focus to an
uninteresting, early-stage gold project.
4. Roxgold (ROG.V), a development-stage gold miner with a small
high-grade project in Burkina Faso, has been removed. There is
nothing wrong with ROG, but it is now too big for the SSWL. If not
for the existence of TGM.V we would consider adding ROG to the TSI
Stocks List. TGM.V and ROG.V have gold deposits at similar stages of
development in Burkina Faso, but TGM, which is already in the TSI
List, offers the better value and the greater growth potential.
Chart Sources
Charts appearing in today's commentary
are courtesy of:
http://stockcharts.com/index.html

|
