|
-- Weekly Market Update for the Week Commencing 25th January 2010
Big Picture
View
Here is a summary of our big picture
view of the markets. Note that our short-term views may differ from our
big picture view.
In nominal dollar terms, the BULL market in US Treasury Bonds
that began in the early 1980s will end by mid-2010. In real (gold)
terms, bonds commenced a secular BEAR market in 2001 that will continue
until 2014-2020. (Last
update: 09 February 2009)
The stock market, as represented by the S&P500 Index, commenced
a secular BEAR market during the first quarter of 2000, where "secular
bear market" is defined as a long-term downward trend in valuations
(P/E ratios, etc.) and gold-denominated prices. This secular trend will bottom sometime between 2014 and 2020. (Last update: 22 October 2007)
A secular BEAR market in the Dollar
began during the final quarter of 2000 and ended in July of 2008. This
secular bear market will be followed by a multi-year period of range
trading. (Last
update: 09 February 2009)
Gold commenced a
secular bull market relative to all fiat currencies, the CRB Index,
bonds and most stock market indices during 1999-2001. This secular trend will peak sometime between 2014 and 2020. (Last update: 22 October 2007)
Commodities,
as represented by the Continuous Commodity Index (CCI), commenced a
secular BULL market in 2001 in nominal dollar terms. The first major
upward leg in this bull market ended during the first half of 2008, but
a long-term peak won't occur until 2014-2020. In real (gold) terms,
commodities commenced a secular BEAR market in 2001 that will continue
until 2014-2020. (Last
update: 09 February 2009)
Copyright
Reminder
The commentaries that appear at TSI
may not be distributed, in full or in part, without our written permission.
In particular, please note that the posting of extracts from TSI commentaries
at other web sites or providing links to TSI commentaries at other web
sites (for example, at discussion boards) without our written permission
is prohibited.
We reserve the right to immediately
terminate the subscription of any TSI subscriber who distributes the TSI
commentaries without our written permission.
Outlook Summary
Market
|
Short-Term
(0-3 month)
|
Intermediate-Term
(3-12 month)
|
Long-Term
(1-5 Year)
|
Gold
|
Neutral
(07-Dec-09)
|
Bullish
(12-May-08)
|
Bullish
|
US$ (Dollar Index)
|
Neutral
(20-Jan-10)
| Bullish
(02-Nov-09)
|
Neutral
(19-Sep-07)
|
Bonds (US T-Bond)
|
Neutral
(18-Jan-10)
|
Bearish
(14-Dec-09)
|
Bearish
|
Stock Market (S&P500)
|
Neutral
(07-Dec-09)
|
Bearish
(11-May-09)
|
Bearish
|
Gold Stocks (HUI)
|
Neutral
(25-Jan-10)
|
Neutral
(16-Sep-09)
|
Bullish
|
| Oil | Neutral
(28-Oct-09)
| Neutral
(14-Oct-09)
| Bullish
|
Industrial Metals (GYX)
| Bearish
(21-Sep-09)
| Bearish
(25-May-09)
| Neutral
(11-Jan-10)
|
Notes:
1. In those cases where we have been able to identify the commentary in
which the most recent outlook change occurred we've put the date of the
commentary below the current outlook.
2. "Neutral", in the above table, means that we either don't have a
firm opinion or that we think risk and reward are roughly in balance with respect to the timeframe in question.
3. Long-term views are determined almost completely by fundamentals,
intermediate-term views by giving an approximately equal weighting to
fundmental and technical factors, and short-term views almost
completely by technicals.
Why we almost never write about gold market manipulation
Some gold bulls believe that
direct intervention in the gold market by the US Government and/or a
cartel of mostly-US banks is the most important, or at least a very
important, influence on the gold price. We will now present the main
reasons why we disagree, and, therefore, why we devote almost no
commentary space to gold market manipulation.
We are not going to argue with the idea that attempts to manipulate the
gold market occur on a regular basis, because it wouldn't surprise us
if they did occur and if the US Treasury were somehow involved. Our
arguments are that if gold market manipulation has occurred then it has
been ineffective; that it must always be ineffective given the tools
the so-called manipulators have to work with; and that gold market
manipulation is trivial compared with the other efforts that are
routinely made to influence the financial markets, the economy, and the
public's expectations. We will now expand on these arguments.
We've noticed that the commentators who most vociferously advocate the
"manipulation-is-a-dominant-influence-on-the-gold-market" theory tend
to fixate on very short-term price action, such as intra-day
fluctuations. However, we have absolutely no interest in gold's
intra-day price movements except to the extent that these movements
affect the major price trend. And what we see when we look at the major
price trend is that over the past two decades gold has done exactly
what it should have done considering the financial/economic conditions
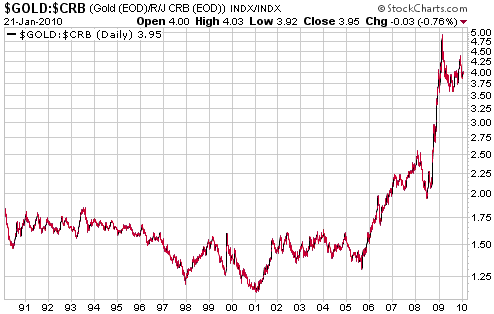
that prevailed along the way. To illustrate what we mean we have
included, herewith, a chart of the gold/CRB ratio covering the past 20
years. By reviewing gold's performance in terms of a basket of
commodities, rather than in terms of the US$, we effectively remove
changes in the US dollar's purchasing power from the equation and thus
get a glimpse of how gold performed in real terms.
The chart shows that gold drifted lower relative to commodity prices in
general during the 1990s and then embarked on a huge bull run in early
2001. Gold, today, is about 240% higher than it was 10 years ago
relative to the CRB Index. Moreover, this dramatic out-performance by
gold is consistent with the goings-on in the financial world since
2001, as was the preceding decade of relatively poor performance. In
particular, gold should do comparatively well during multi-year periods
when economic growth is sub-par, confidence is waning and the
authorities are pursuing inflationary policies (as was the case during
much of 2001-2009), and relatively poorly when economic confidence is
high or on the rise (as was the case during the bulk of the 1990s).
The second and third of our arguments are inter-related, so we will deal with them together.
It is said that the government and the financial establishment have a
motive to suppress the gold price in that a high and rising gold price
signals some sort of financial or economic problem. This is true to a
certain extent, although most people outside the "gold community"
really don't care what happens to the gold price. Also, a benign
explanation for a large rise in the gold price could always be sold to
the public as long as interest rates and economic statistics failed to
reveal an inflation problem. For example, monetary inflation was
responsible for the bulk of the rise in the prices of industrial
commodities during 2003-2008, but most people were easily convinced
that "Peak Oil" and the real economic progress of the "BRIC" countries
were the primary causes.
Which brings us to the point that "they" don't need to suppress the
gold price in order to create the illusion that there is no inflation
problem because "they" already have control over economic statistics
and considerable influence over interest rates and the money supply. In
other words, "they" manipulate things that are orders of magnitude more
important than the gold market.
Influence over the money supply leads to influence over the stock
market because equity prices usually respond far more quickly to
money-supply changes than do the prices of goods and services. In fact,
despite all the talk of a "Plunge Protection Team" the only way that an
over-valued stock market could be 'propped up' beyond the very
short-term is via a large increase in the money supply. This is because
the financial resources that could potentially be brought to bear in an
effort to directly support the stock market will always be tiny
relative to the market's overall size, especially since we are talking
about a GLOBAL market (the performance of the US stock market is tied
to the performances of other major stock markets around the world, and
vice versa, so we are talking about tens of trillions of dollars of
market capitalisation). That is, the average equity price could only be
maintained at an artificially high level by reducing the value of money.
Unfortunately for the manipulators, the gold price could only be
suppressed beyond the short-term by clamping down on the money supply.
The reason is essentially the same: the markets are way too big
relative to the resources that could be mustered for the purpose of
direct intervention, especially considering that gold is more closely
associated with the multi-trillion-dollar-per-day currency market than
with the much smaller commodity markets. This means that -- very
short-term considerations aside -- the gold price could not be
suppressed at the same time as the stock market was being 'propped up'.
Hence our statement that gold market manipulation must always be
ineffective given the tools the so-called manipulators have to work
with.
In summary, the only gold market manipulation of real importance occurs
indirectly -- via the manipulation of economic statistics (CPI, GDP,
etc.), interest rates and money supply -- but this means that attempts
to suppress the gold price will come into conflict with other
strategies. Of particular note, an effective strategy for boosting the
stock market could not be implemented in parallel with a concerted
effort to suppress the gold market.
The events of 2006-2008 are a great example of what happens to
inflation-fueled stock and real-estate markets when monetary policy is
carefully tightened in an effort to 'cool off' an inflation-fueled
commodity market. And the events of November-2008 through to
November-2009 are a great example of what happens to the gold market
when the manipulators engineer a huge surge in the money supply in an
effort to support the stock market and the banking establishment.
Before we leave this topic we'd like to address two related points, the
first being that those who fixate on market manipulation often shoot
themselves in the foot by putting forward theories that are just plain
silly. Governments and their central banks regularly manipulate
critically important information, such as the price of credit, and the
effects of these manipulations deserve exposition. Why, then, do the
manipulation theorists feel the need to come up with wildly implausible
scenarios? An example of what we are referring to is the "tungsten gold
bar" story that recently did the rounds. Other examples include the
claims that a) the Gold ETF (GLD) is not backed by physical gold*, and
b) the Central Bank Liquidity Swaps of September-October 2008 were done
to manipulate the US$ upward on the foreign exchange market**.
The final point we'd like to make is that you will never learn anything
from your mistakes in the financial markets if you look externally for
someone to blame.
*A good explanation of why these claims are completely false can be read at http://silveraxis.com/todayinsilver/2009/12/22/charlatan-exposed-gld-audit/#more-957.
**The
Central Bank (CB) Liquidity Swaps involved the quick-fire injection of
about 500 billion dollars into the currency market. Unless the Fed has
found a way to reverse the laws of supply and demand, the price of
something cannot be pushed upward by rapidly increasing its supply. In
reality, the CB Liquidity Swaps were a reaction to the sudden
disappearance of liquidity throughout the world and the resultant sharp
rise in the US dollar's exchange value. They were, in effect, an
attempt to manipulate the dollar LOWER, not higher.
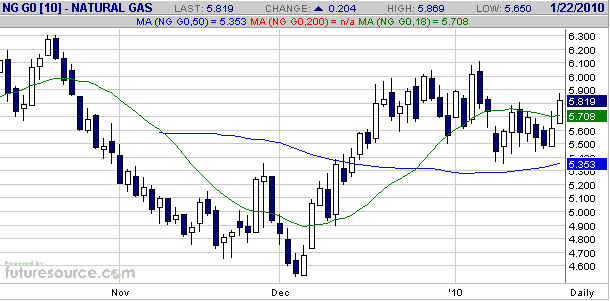
Natural Gas Update
The
following daily chart shows that the February natgas futures contract
moved sharply higher from early December through to late December and
has since been drifting lower in what looks, to us, like a continuation
pattern (a consolidation within a continuing short-term upward trend).
The natural gas market held up well during the second half of last week
in the face of pronounced weakness in oil and most other commodities. A
report that the US natural gas inventory had fallen back to its 5-year
average probably had a lot to do with this.
We continue to expect that the natgas market will maintain an upward bias through to April-May.
The Stock
Market
It was a little late in
starting, but last week's decline in the US stock market was consistent
with the Presidential Cycle as illustrated by the chart in the 6th
January Interim Update. Recall that the average performance of the US
stock market during the 2nd year of the Cycle (2010 is the 2nd year)
encompasses a January pullback, an upward bias from early February
through to April, a downward trend from April through to early October,
and then a rebound into year-end.
If the market adheres to the 2nd-year Cycle average then the current pullback will be complete by the end of this month.
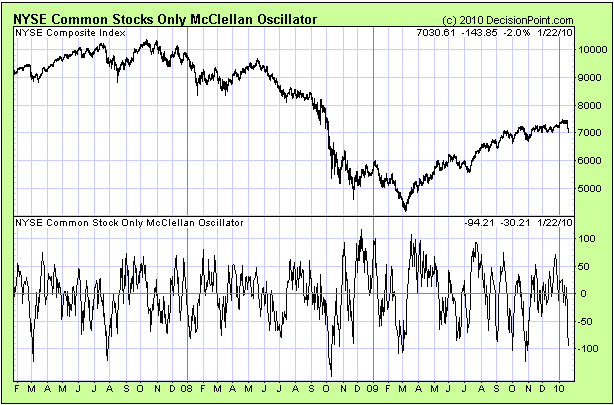
The following chart provides another reason to believe that the current
pullback will end within the next week or so. Even though the downturn
has just commenced, the chart shows that the NYSE's McClellan
Oscillator (MO) is already nearing its lowest levels of the past year.
In other words, by this measure the market is already approaching an
'oversold' extreme.
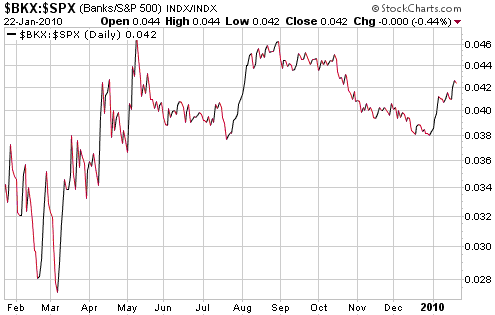
Many journalists have
linked last week's sharp downward reversal in the US stock market to
Obama's threats to restrict the activities of the big banks, but this
explanation doesn't make sense in light of the following chart of the
BKX/SPX ratio (the Bank Index relative to the broad stock market). The
chart shows that bank stocks have been out-performing the broad market
since late December and continued to demonstrate relative strength last
week. This, in turn, suggests that market participants collectively
believe that nothing more than hot air is emanating from the
President's mouth.
So, what did cause the turnaround?
We don't know. Financial journalists like to explain all market moves
by pointing to the latest news, but the markets aren't that
straightforward. At any given time, prices reflect the decisions of
thousands, or perhaps millions, of market participants with their own
reasons for buying, selling or holding. Sometimes there will be a
specific news-related catalyst for a market move, but more often than
not there isn't one.
This week's
important US economic events
| Date |
Description |
Monday Jan 25
| Existing Home Sales
| | Tuesday Jan 26 | Case-Shiller Home Price Index
Consumer Confidence
| | Wednesday Jan 27
| FOMC Announcement
New Home Sales
| | Thursday Jan 28
| Durable Goods Orders
| | Friday Jan 29
| Q4 GDP
Chicago PMI
Consumer Sentiment
Employment Cost Index
|
Gold and
the Dollar
Gold
Our view is that gold-stock indices such as the HUI made
intermediate-term peaks on 2nd December of last year, which means that
we aren't expecting them to make new highs during the first half of
this year. However, the situation in the bullion market is different.
Our view is that gold bullion made only a short-term peak in early
December and stands a good chance of making a new high over the next
few months -- in parallel with a decline in the Dollar Index to test
last year's low.
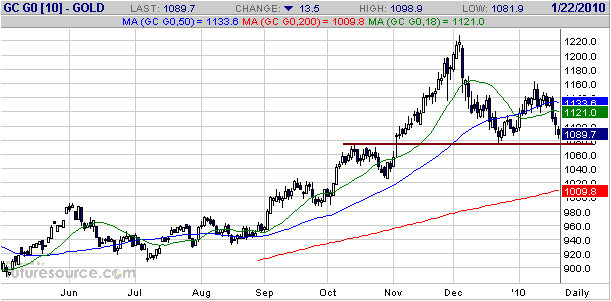
The lateral support in the $1070s drawn on the following daily gold
futures chart has been mentioned in TSI commentaries as a logical
target for a correction low. February gold traded at $1082 on Friday,
so this target has essentially been reached. The correction could
therefore be complete, but until a correction low is confirmed via a
sign of strength the risk of a further decline -- to $1050 or, perhaps,
all the way back to major support at $1000 -- will remain.
An example of what would constitute a "sign of strength" is a daily close above the 50-day moving average.
Last week's swoon in
the broad US stock market increases the probability that the US
Monetary Policy Statement to be issued on 27th January will reiterate
the Fed's plan to keep its interest rate target near zero indefinitely.
This should lend support to the gold market.
Gold Stocks
Current Market Situation
Over the past 10 years, intermediate-term HUI corrections have resulted
in peak-to-trough declines in the 25% to 40% range. The 2nd December
high was 516, so a 25%-40% decline would result in a correction low in
the 310-387 range. At Friday's intra-day low of 396 the HUI was
therefore close to matching the minimum requirement.
As well as achieving a peak-to-trough decline of at least 25%, all the
intermediate-term corrections of the past decade have also resulted in
the HUI trading below its 200-day moving average and the HUI's RSI
moving below 30. The following chart shows that it wouldn't take much
additional weakness from here to meet these requirements.
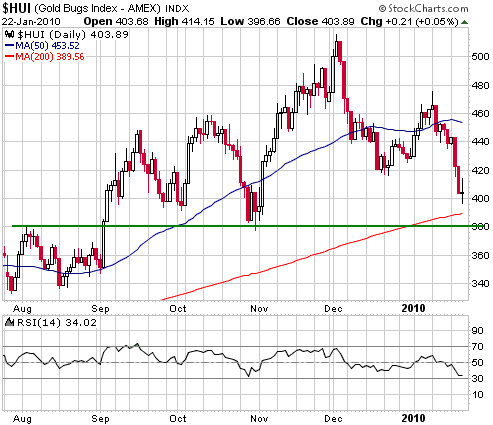
The HUI held up
remarkably well on Friday in the face of a decline in the price of gold
bullion and substantial weakness in the broad stock market. This sign
of strength, combined with the fact that the HUI has almost met the
minimum requirements for an intermediate-term correction, could mean
that at least a short-term price low is at hand. We have therefore
upgraded our short-term outlook from "bearish" to "neutral".
The reason we aren't shifting to a "bullish" stance at this time is
that it would take some additional weakness from here to skew the
short-term risk/reward decisively in favour of reward. A decline to 380
over the next few days would do it.
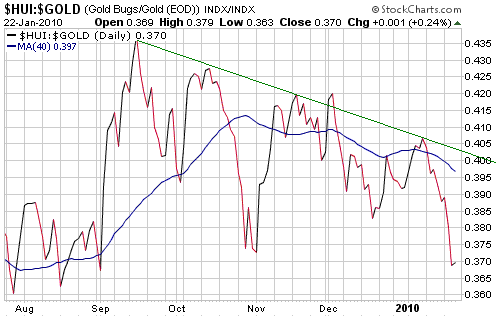
When the HUI was peaking in early December of last year, one of the
warning signs was the sequence of declining tops in the HUI/gold ratio
over the preceding 2.5 months. The following chart shows that the
HUI/gold ratio remains in a downward trend.
An end to the HUI/gold's sequence of declining tops would belatedly
signal an end to the gold sector's intermediate-term correction. We say
"belatedly" because such an event would likely occur well after the
ultimate price low. A more timely indication of a correction low would
be a positive divergence between the HUI and the HUI/gold ratio, with
the HUI making a new correction low while the HUI/gold ratio made a
higher low (essentially, the opposite of the negative divergence that
occurred in early December). Another potentially timely indication of a
correction low would be a decline in the HUI/gold ratio to at least 12%
below its 40-day moving average (the blue line on the following chart).
Such additional weakness in the HUI/gold ratio would establish the sort
of 'oversold' condition that is usually only seen near an important
price low.
Note that if the HUI/gold ratio falls to 0.35 this week it will be about 12% below its 40-day moving average.
Suggested buy zones for individual gold/silver stocks
In October-November of 2008 the gold sector's risk/reward was as
favourable as it ever gets. The crash in the broad stock market had
taken gold-stock valuations down to extremely low levels at a time when
gold-mining profit margins were increasing.
Thanks to the downturn of the past several weeks, the sector-wide
risk/reward is again turning favourable. However, prices are generally
a lot higher now than they were between October of 2008 and March of
2009. Also, there is now a lot more downside risk in the broad stock
market and a lot more upside potential in the US$ than was the case
during the first quarter of last year. As a result, this is not the
right time to be aggressively buying stocks of any description. Rather,
it is a time to be selectively and gradually adding exposure to the
gold sector, especially if, like us, you built up a lot of cash when
prices were higher.
Listed below are a few ideas for new buying.
Note that when determining a suggested buy zone for an individual stock
we have taken into account the stock's valuation and its chart.
Specifically, at the buy zones mentioned below there is
valuation-related upside potential of at least 100% as well as
chart-based support. For example, we have suggested the US$2.50-$2.65
range for new buying of Northgate Minerals (NXG). $2.50 is about 50% of
our estimate of the stock's full value and, as illustrated below,
coincides with lateral support and the 200-day moving average.

Also note that in
some cases the buy zones are well below current prices and therefore
may not be reached. Individual judgment is always required in that
people who already have substantial exposure can afford to be stingier
when placing new buy orders than those who have no, or minimal,
exposure.
List of candidates for new buying:
ADM.V: C$1.75-$1.90 (current price: C$1.85)
FVI.TO: C$1.70-C$1.90 (current price: C$2.45)
GBG: US$1.55-$1.70 (current price: US$1.77)
GOZ.V: C$0.45-C$0.50 (current price: C$0.51)
GSS: US$2.50s (current price: US$2.88)
NXG: US$2.50-$2.65 (current price: US$2.98)
PEZ.TO: C$1.25-C$1.35 (current price: C$1.44)
Instead of, or in addition to, the above-mentioned juniors, investors
could consider the Junior Gold Miners ETF (GDXJ). As explained in the
26th October 2009 Weekly Update, GDXJ is a way for investors to obtain
diversified exposure to the junior end of the gold/silver mining
universe without going to the trouble of selecting and following
individual companies. Go to http://www.vaneck.com/index.cfm?cat=3192&tkr=GDXJ&LN=3-02 for more information about GDXJ.
It would make sense to average into a GDXJ position on weakness,
beginning with an initial purchase near the current price of US$24.10.
Finally, the Franco Nevada warrants (TSX: FNV.WT) and the Kinross Gold
warrants (K.WT.C) are reasonable speculations near their current prices
of C$4.85 and C$3.30, respectively. Of the two, at current prices we
prefer the FNV warrants because they offer more leverage.
Currency Market Update
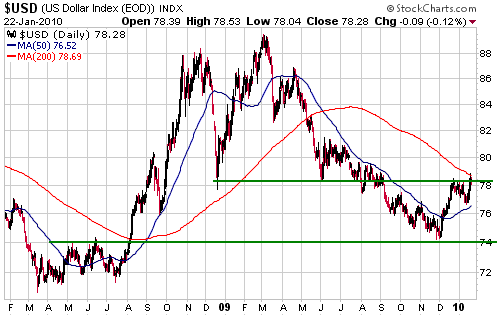
The daily chart displayed below shows that the Dollar Index has
substantial resistance at around 78.50. This resistance is defined by
former highs and lows, as well as by the 200-day moving average.
If the stock market downturn continues over the coming week then the
Dollar Index could spike up to 80, but the bulk of the dollar's initial
rally is probably complete. Our view is that the next move of
consequence will be a decline to the vicinity of last year's low, after
which a larger US$ rally is expected to occur.
Update
on Stock Selections
(Note: To review the complete list of current TSI stock selections, logon at http://www.speculative-investor.com/new/market_logon.asp
and then click on "Stock Selections" in the menu. When at the Stock
Selections page, click on a stock's symbol to bring-up an archive of our comments on the stock in question)
 VIX Futures ETN (NYSE: VXX). Recent price: US$31.89 VIX Futures ETN (NYSE: VXX). Recent price: US$31.89
We have been running a 15% trailing stop on our VXX trade, but will now
tighten the stop to 10%. In addition, we will exit if VXX trades at $35
within the next two weeks.
Potential
addition to the TSI List: Golden Star Resources (AMEX: GSS). Shares:
257M issued, 265M fully diluted. Recent price: US$2.88
Ghana-based gold producer GSS appears to have finally worked through
the issues that have, for years, caused it to continually miss its
production and cost forecasts. It is now a 400K-oz/yr producer, and
unless something untoward happens should generate substantial cash flow
over the next few years.
2010 production is expected to be 400K ounces at a cash cost of
US$585/oz. It has a strong balance sheet, with $113M of long-term debt
more than offset by $130M of cash and $120M of working capital.
Now that it has successfully ramped up its annual production rate to
400K ounces and has its costs under control, GSS stands a good chance
of achieving a higher valuation. Based on the stock market valuations
of other gold miners with assets in relatively secure locations and
with annual production in the 250K-1000K range, GSS's production should
be worth at least $3000/ounce. This gives us a target market cap of
US$1200M, which equates to US$4.50 per fully-diluted share.
GSS's chart (see below) looks ugly. The chart suggests that the stock
has just completed a head-and-shoulders top and is on its way back to
US$2.
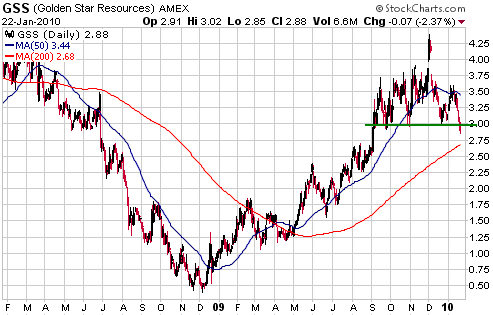
The chart points to
significant additional downside potential, although the stock price
shouldn't drop anywhere near as far as US$2.00 unless the gold market
becomes much weaker than we currently expect or a major
company-specific problem is encountered.
Taking into consideration the risk of additional corrective activity in
the gold sector, GSS's bearish chart and the valuation-related upside,
we think GSS's risk/reward would be very attractive in the US$2.50s.
The stock will therefore be added to the TSI List IF it trades at
US$2.55 within the next 4 weeks.
Red Hill Energy (TSXV: RH). Shares: 52M issued, 63M fully diluted. Recent price: C$0.35
Last Thursday it was announced that RH, a Mongolia-based
exploration-stage coal miner with over 1B tonnes of coal in the
Measured-and-Indicated (M&I) category, was merging with Prophecy
Resource (TSXV: PCY), an exploration-stage base metal miner with assets
in Canada. Under the terms of the merger agreement, RH shareholders
will receive 0.92 of a PCY share plus one share of "NewCo" for every
existing RH share. "NewCo" is a new company that will initially have
$1M of cash and RH's current small investment in lithium assets.
We hadn't heard of PCY prior to the announcement of this deal. Based on
what we have since read, its main asset is an exploration-stage nickel
project with a 230M-pound resource.
Up until now we had been hoping that RH would be able to do a deal with
a major coal producer or consumer to facilitate the development of its
massive coal deposits, because such a deal could have created enormous
shareholder value. In this respect, Thursday's announcement was a
disappointment. The potential to do a deal with a large company still
exists, but the fact that RH has agreed to merge with a very small
company suggests that nothing is on the horizon.
The new management will probably do a better job of promoting the RH
story, which will, of course, be helpful as far as stock market
performance is concerned. Also, a company that is not totally focused
on Mongolia will have a better chance of attracting investors. Overall,
though, we see the PCY merger in a negative light, for two reasons.
First, it is evidence that RH's plans for its coal assets have not come
together. Second, PCY shareholders will end up with 35% of the combined
company but are contributing a lot less than 35% of the asset value.
We will continue to follow RH-PCY for now, pending more information on the direction/plans of the merged company.
Chart Sources
Charts appearing in today's commentary
are courtesy of:
http://stockcharts.com/index.html
http://www.futuresource.com/
http://www.decisionpoint.com/

|