|
-- Weekly Market Update for the Week Commencing
25th February 2013
Big Picture
View
Here is a summary of our big picture
view of the markets. Note that our short-term views may differ from our
big picture view.
In nominal dollar terms, the BULL market in US Treasury Bonds
that began in the early 1980s will end by 2013. In real (gold)
terms, bonds commenced a secular BEAR market in 2001 that will continue
until 2014-2020. (Last
update: 23 January 2012)
The stock market, as represented by the S&P500 Index,
commenced
a secular BEAR market during the first quarter of 2000, where "secular
bear market" is defined as a long-term downward trend in valuations
(P/E ratios, etc.) and gold-denominated prices. This secular trend will bottom sometime between 2014 and 2020.
(Last update: 22 October 2007)
A secular BEAR market in the Dollar
began during the final quarter of 2000 and ended in July of 2008. This
secular bear market will be followed by a multi-year period of range
trading.
(Last
update: 09 February 2009)
Gold commenced a
secular bull market relative to all fiat currencies, the CRB Index,
bonds and most stock market indices during 1999-2001.
This secular trend will peak sometime between 2014 and 2020.
(Last update: 22 October 2007)
Commodities,
as represented by the Continuous Commodity Index (CCI), commenced a
secular BULL market in 2001 in nominal dollar terms. The first major
upward leg in this bull market ended during the first half of 2008, but
a long-term peak won't occur until 2014-2020. In real (gold) terms,
commodities commenced a secular BEAR market in 2001 that will continue
until 2014-2020.
(Last
update: 09 February 2009)
Copyright
Reminder
The commentaries that appear at TSI
may not be distributed, in full or in part, without our written permission.
In particular, please note that the posting of extracts from TSI commentaries
at other web sites or providing links to TSI commentaries at other web
sites (for example, at discussion boards) without our written permission
is prohibited.
We reserve the right to immediately
terminate the subscription of any TSI subscriber who distributes the TSI
commentaries without our written permission.
Outlook Summary
Market
|
Short-Term
(1-3 month)
|
Intermediate-Term
(6-12 month)
|
Long-Term
(2-5 Year)
|
|
Gold
|
Bullish
(17-Oct-12)
|
Bullish
(26-Mar-12)
|
Bullish
|
|
US$ (Dollar Index)
|
Neutral
(24-Dec-12)
|
Neutral
(09-Jan-12)
|
Neutral
(19-Sep-07)
|
|
Bonds (US T-Bond)
|
Neutral
(12-Nov-12)
|
Neutral
(18-Jan-12)
|
Bearish |
|
Stock Market
(DJW)
|
Bearish
(30-Jul-12)
|
Bearish
(28-Nov-11)
|
Bearish
|
|
Gold Stocks
(HUI)
|
Bullish
(24-Dec-12)
|
Bullish
(23-Jun-10)
|
Bullish
|
|
Oil |
Neutral
(30-Jul-12)
|
Neutral
(31-Jan-11)
|
Bullish
|
|
Industrial Metals
(GYX)
|
Neutral
(30-Jul-12)
|
Neutral
(29-Aug-11)
|
Neutral
(11-Jan-10)
|
Notes:
1. In those cases where we have been able to identify the commentary in
which the most recent outlook change occurred we've put the date of the
commentary below the current outlook.
2. "Neutral", in the above table, means that we either don't have a
firm opinion or that we think risk and reward are roughly in balance with respect to the timeframe in question.
3. Long-term views are determined almost completely by fundamentals,
intermediate-term views by
fundamentals, sentiment and technicals, and short-term views by sentiment and
technicals.
The Currency War Silliness
According to a common line of thinking, the
reason that currency devaluation can't create a sustainable advantage for an
economy is that it leads to competitive devaluation (the proverbial race to the
bottom). The implication is that one economic region could achieve a sustainable
advantage by devaluing its currency as long as its trading partners didn't
implement offsetting devaluations. This is wrong. An economic region cannot
obtain an advantage by deliberately reducing the value of its currency,
regardless of how its trading partners react. Here's why:
Over the long term, currency exchange rates are determined by relative changes
in purchasing power. This means that in order for Currency A to sustain a
decline against Currency B on the foreign exchange market it will have to lose
its domestic purchasing power at a faster rate. To put it another way, the
so-called "general price level" will have to rise faster in Country A than in
Country B. This, in turn, means that any international trade advantage that will
theoretically -- if bad theory is applied -- be gained by a country due to a
decline in the relative value of its currency on the foreign exchange market
must be offset by a PRECEDING general rise in the cost of production. And this
is without even taking into account the economy-weakening effects of the
mal-investment caused by the monetary inflation needed to create the "price
inflation" that ultimately leads to the sustainably-lower exchange rate. This is
why high-inflation economies tend to be less competitive than low-inflation
economies.
In the short-term, currency exchange rates regularly move counter to long-term
fundamentals. Consequently, it is not uncommon for currencies with relatively
slow rates of domestic purchasing-power loss to decline on the foreign exchange
market over periods of several months or even longer. But even in the case where
the decline in a currency's exchange rate is not due to a relatively high rate
of domestic "price inflation" and is therefore temporary, a short-term
economy-wide benefit will not be obtained unless the economy with the weakening
currency is already running a trade surplus. To put it another way, an economy
that imports more than it exports can't possibly achieve even a short-term
benefit by manipulating money in a way that increases the prices of imports. The
reason is that if an economy imports more than it exports, then any temporary
benefit received by exporters due to a decline in the currency's foreign
exchange value will be more than offset by higher prices paid within the
non-exporting part of the economy. For example, the overall Japanese economy
can't possibly benefit from the recent sharp decline in the Yen's exchange rate,
even in the short-term, because Japan now imports more than it exports. A
Japan-based car exporter may well gain a temporary advantage from the Yen's
decline, but due to the rising cost of imported energy the car manufacturer's
gain will be some other Japanese company's or individual's loss.
To further explain, a common argument in favour of exchange-rate manipulation
goes something like this: "If imports become more expensive then consumers will
buy less from foreign producers and more from local producers, thus creating a
benefit for the local economy." This is an illogical argument. First, it is
based on the assumption that local producers are ready to replace the products
that are being imported, but this is usually not the case. Taking the topical
example of Japan, it doesn't matter how high the prices of imported oil and LNG
become, Japan is not going to increase its domestic production of oil and LNG.
Second, even in the case where local producers are capable of providing the
products that are being imported, if exchange-rate manipulation forces consumers
to pay a higher price for a product then all it does is transfer wealth from
some consumers to some producers within the economy. It doesn't result in an
economy-wide increase in wealth.
All of which prompts the question: If lowering a currency's exchange rate can't
possibly give an economy a sustainable advantage and in most cases can't even
provide a temporary advantage, then why is exchange-rate reduction such a
popular policy choice?
There are two main reasons. The first reason is that all sorts of harebrained
theories are accepted wisdom in the intermingled worlds of economics and
politics. For example, if a person mistakenly believes that the economy can be
helped by an increase in government spending or by conjuring money out of
nothing, it means that he/she doesn't look beyond the superficial short-term
effects of policies and is therefore apt to mistakenly believe that the economy
can be helped by lowering the currency's foreign exchange value. The second
reason is that obtaining and holding-onto political power in a modern democracy
involves making promises and payments to one group at the expense of another
group, the goal being to gain more votes within the group that receives the
benefit than are lost within the group that pays the benefit. Under this
political system, lowering the exchange rate to help exporters can be an
effective strategy because the receivers are easy to pinpoint and relatively
small in number whereas the payers are spread throughout the economy and
relatively large in number (the payers are often the amorphous mass known as
"consumers"). This creates the potential to gain votes among the receivers
without losing votes among the payers. Usually, the payers won't even realise
that they are paying.
Copper Update
The rising economic confidence of the past few
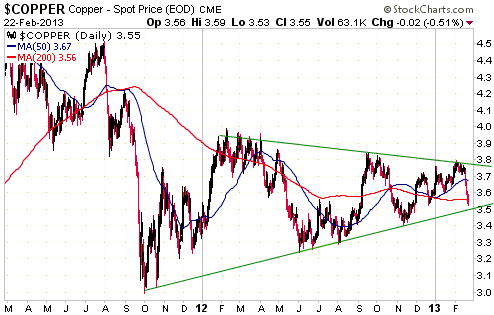
months hasn't done much for the base metals. For example, the following chart
shows that copper, arguably the most important of the base metals, ended last
week near a 3-month low.
Copper's chart is interesting, because it reveals the potential for a big move
within the next few months but doesn't clearly indicate the likely direction of
the move. A daily close below $3.50 would point to a continuing decline down to
the 2011 low of $3.00, while a daily close above $3.80 would point to a
continuing rise to the 2011 high of around $4.50.
In their efforts to figure out the most likely future direction of the copper
price, a lot of analysts monitor what's happening with reported copper
inventories. For example, they monitor charts such as the one displayed below.
The idea is that a rising inventory (increasing aboveground supply) points to a
lower price, while a falling inventory (decreasing aboveground supply) points to
a higher price. However, foresight can't be gained by looking at the same
factors and interpreting these factors in the same way as almost everyone else
in the market. That almost everyone who follows the copper market knows the
inventory situation guarantees that the market has already done its best to
factor the inventory situation into the current price.
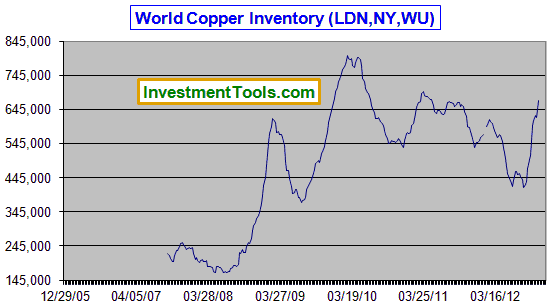
Chart Source:
http://www.investmenttools.com/
The fundamentals that really matter are macroeconomic forces that are often
difficult to predict. For copper and the other base metals, perhaps the most
important of these forces is China's nominal economic growth. Is China's
government going to promote faster growth in the supplies of money and credit,
thus enabling another extraordinary bout of mal-investment and causing a surge
in the demand for basic materials? Or will concerns about an "inflation" problem
prompt China's policy-makers to tighten monetary conditions? If the answer to
the first of these questions is yes then copper's next big move will probably be
to the upside. If the answer to the second of these questions is yes then
copper's next big move will probably be to the downside. Last week the market
started leaning towards an affirmative answer to the second question.
We don't have an opinion on what China's policy-makers will do over the next few
months. As a result, we remain "neutral" on copper and the other base metals.
The Stock
Market
The March Cycle
The US stock market has had a strong tendency over the past 13 years to make an
important high or low in March. For example, three of the four most important
turning points of the past 13 years occurred during the month of March. We are
referring to the major high of March-2000 and the major lows of March-2003 and
March-2009. The only major turning point not to occur in March was the major
high of October-2007. In addition, there was a multi-month high or low in
March-2001 (low), March-2002 (high), March-2004 (high), March-2005 (high),
March-2007 (low), March-2008 (low), and March-2011 (low).
At this stage it seems that if there is going to be a multi-month extreme in
March-2013 it will be a high, but a low can't yet be ruled out. A sharp decline
over the next two weeks would potentially create a low that holds for at least a
few months.
Current Market Situation
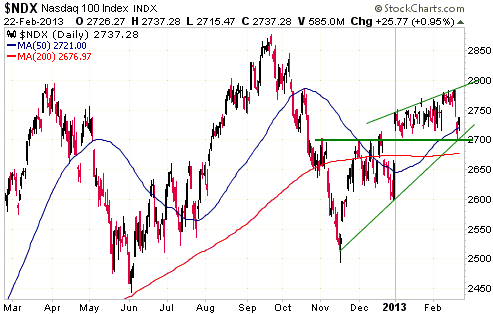
A significant LOW in March-2013 can't yet be ruled out because the price action
of the NASDAQ100 Index (NDX) suggests that a sharp decline over the next 2-3
weeks is a realistic possibility. The NDX dropped to support at 2700 last
Thursday and then rebounded, which underlines the importance of this support. If
2700 is breached this week it could lead to a quick decline to longer-term
support at 2450-2500. That's a big 'if', but it is one plausible outcome.
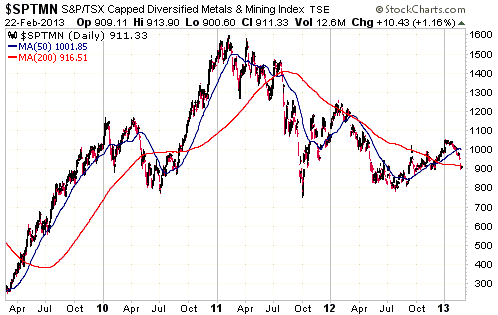
It's not just gold mining that has been in the doldrums. Gold has recently been
by far the weakest sub-sector of the overall mining sector, but the following
chart shows that the Diversified Metals and Mining Index (SPTMN) has been weak
since early-2011 and is no higher today than it was in late-2009.
We are more keen on the gold miners than the non-gold miners, but a sharp stock
market pullback over the next few weeks could create a good opportunity to 'go
long' the non-gold miners via a major producer such as BHP or an ETF such as KOL
or XME.
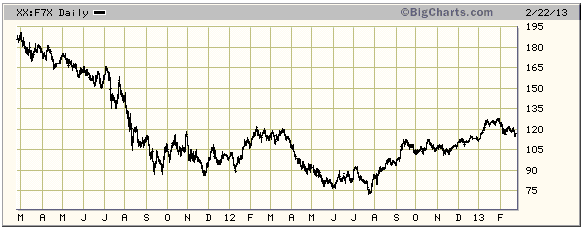
Fundamentally, the European banking sector is probably the weakest sector of the
weakest economic region. This doesn't necessarily mean that the average European
bank stock, as represented on the following daily chart by the EURO STOXX Banks
Index (F7X), is about to commence a large decline. After all, this fundamental
weakness didn't prevent these stocks from rallying strongly during the second
half of last year. What it means is that the European banking sector can viewed
as the proverbial "canary in the coal mine". As long as F7X is in an upward
trend, the broad-based equity indices probably aren't going to suffer large
declines.
Our interest is piqued by the fact that F7X has had a downward bias since
late-December.
This week's
important US economic events
| Date |
Description |
| Monday Feb 25 |
Dallas Fed Mfg Survey | | Tuesday Feb
26 |
Case-Shiller Home Price Index
New Home Sales
Consumer Confidence
Richmond Fed Mfg Index | | Wednesday
Feb 27 |
Durable Goods Orders
Pending Home Sales Index | | Thursday
Feb 28 |
Q4 GDP (revised)
Chicago PMI
|
| Friday Mar 01 |
ISM Manufacturing Index
Personal Income and Spending
Motor Vehicle Sales
Consumer Sentiment
Construction Spending |
Gold and
the Dollar
Gold
Inflation Expectations
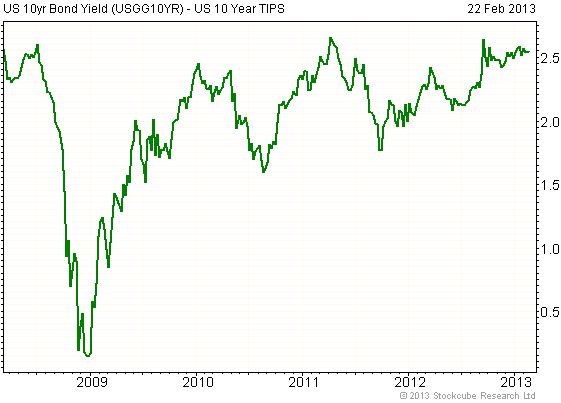
We refer to the difference between the yield on the 10-year T-Note and the yield
on the 10-year TIPS (Treasury Inflation Protected Security) as the "expected
CPI", because it indicates the future change in the CPI expected by the markets.
Most people realise that the change in the CPI doesn't reflect the actual amount
of dollar depreciation, which means that the value of the "expected CPI"
generally won't provide an accurate indication of the markets' inflation
expectations. However, the trend of the "expected CPI" should accurately reflect
the trend of market-wide inflation expectations.
The following weekly Fullermoney.com
chart shows that the "expected CPI" rose sharply at around the time of the Fed's
"QE3" announcement (mid-September of last year). It has since flat-lined,
despite another money-pumping program ("QE4") being introduced by the Fed in
December. The message, here, is that the financial markets have come to the
conclusion that the Fed is doing enough on the monetary front to support the
financial system but not enough to cause an inflation problem. This conclusion
will prove to be wrong, but the markets' expectations are what they are. If you
want an explanation for why monetary inflation is boosting the broad stock
market and doing nothing for the gold market, this is as good as any.
Current Market Situation
Last May the total speculative net-long position in COMEX gold futures reached
its lowest level since the crash of 2008. The latest COT report shows that on
Tuesday 19th February the total speculative net-long position was equal to last
May's low, which means that it is now at a 4-year low.
Sentiment in the gold market continues to build a launching pad for a major
advance, but last week's price action made it clear that the correction that
began way back in August of 2011 is not complete. On long-term charts the
correction still looks like a lengthy flat consolidation with a base at
$1520-$1550. We acknowledge, though, that the probability of this base being
breached before the start of the next big rally looks higher now than it did
just two weeks ago. We didn't anticipate another gut-wrenching test of this
long-term lateral support.
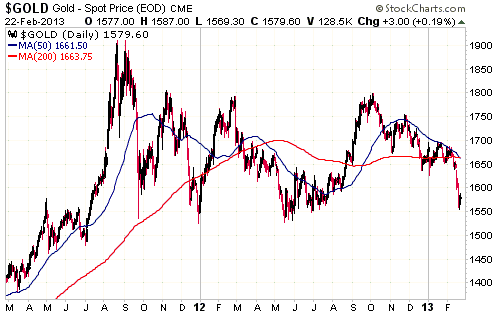
Looking back at the other near-vertical 2-3 week plunges in the US$ gold price
that occurred over the past several years we noticed a consistency in the way
that price bottoms were formed. The 2-3 week price plunge was almost always
followed by a short rebound and then a decline that tested or slightly breached
the low of the plunge, with the test of the low coming 2-4 weeks after the end
of the plunge. For examples on the above chart refer to the price action in
September-October of 2011, December of 2011 and May-June of 2012. If the plunge
of the past two weeks follows this pattern then a tradable rebound will begin
during the first half of March.
Gold Stocks
A test of the May-2012 low during the first half of this year became an
even-money bet last December and a high-probability outcome during January.
There was a question as to whether the test would occur during the first two
months of the year or during the second quarter of the year, but as long as the
test proved to be successful it would be correct to view the decline from the
September-2012 peak as part of a lengthy bottoming pattern that started to form
in May-2012.
Unfortunately, the test wasn't successful, as last Wednesday (20th February) the
HUI closed well below its 373 low of May-2012. This tells us that the cyclical
bear market in the gold sector didn't end last May, but it doesn't tell us when
or where the bear market will end. Trend-following analysts will naturally
predict much lower levels due to last week's breakdown, whereas other analysts
will focus on the low valuations and/or the extent to which the market is
'oversold'.
There is such an obvious 'line in the sand' at around 373 that a quick move to
well above this level would mark last week's breakdown as a 'head fake'.
However, we are concerned that a reversal hasn't yet happened. Rather than
plunging and then reversing course in a clear-cut manner, the HUI plunged below
the 'line in the sand' last Wednesday and then traded sideways over the final
two days of the week. This indicates that the crash might not have ended. It
will almost certainly end soon, but even if it continues for just 1-2 more weeks
it will result in much lower prices. A 1-2 week continuation is not our
expectation, but it will remain a possibility until there is a clear-cut
reversal. We would now view a daily close above 385 as evidence of such a
reversal.
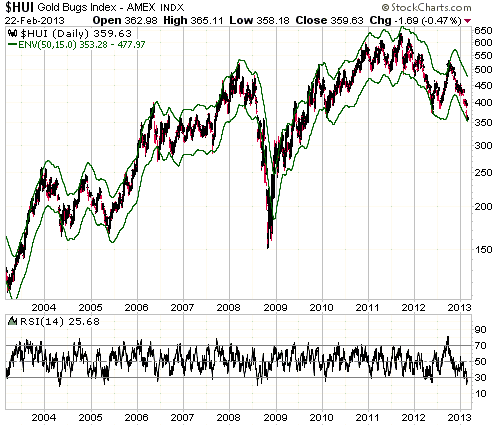
The following daily chart illustrates in two ways the extent to which the HUI is
'oversold'. First, the bottom section of the chart shows that the daily RSI was
close to a 10-year low following last Wednesday's plunge. Second, the chart
shows that the HUI has just touched the bottom of a moving-average (MA) envelope
that with one major exception has always limited intermediate-term declines over
the past 10 years. The exception occurred during August-October of 2008, when
the HUI lost about 50% of its value after it first reached the bottom of this MA
envelope.
GDXJ, a proxy for the junior end of the gold sector, was even more 'oversold'
than the HUI at last week's low. GDXJ's daily RSI(14) got as low as 15 last
week. It is rare for any index or ETF to reach such a low RSI.

Summarising the above: There is a high probability that the gold sector will
reach a major bottom in the near future, but last week's break below the
May-2012 low tells us that many owners of gold mining stocks are panicking. When
market participants panic, absurdly low prices can quickly go even lower.
Regardless of what happens over the next couple of weeks, the gold-stock indices
and ETFs are likely to trade a long way above their current levels within the
next 6 months.
Currency Market Update
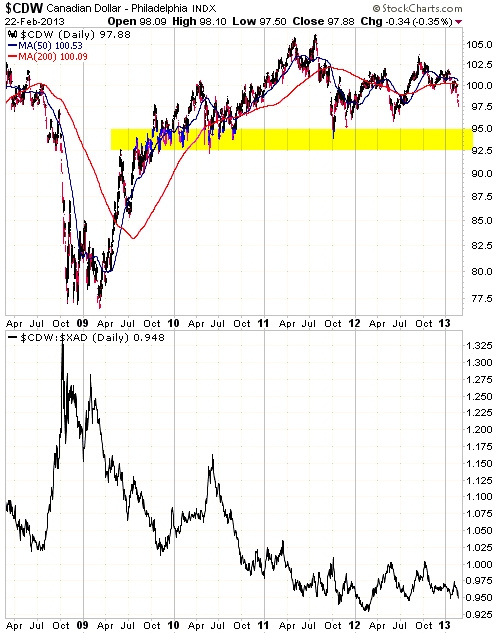
The top section of the following chart shows Canadian Dollar futures (the C$
relative to the US$) and the bottom section shows the C$ relative to the
Australian Dollar (the C$/A$ cross rate).
Relative to the US$, the C$ has been weak over the past few months and has
essentially traded sideways over the past three years. The bottom of its
multi-year range is at 92.5-95.0.
We suspect that a test of major support at 92.5-95.0 is coming up. If there is a
sharp stock market decline over the next few weeks then the test could happen in
March. Otherwise, it probably won't happen until the second quarter of this
year.
Relative to the A$, the C$ has been in a bear market since October of 2008.
Although monetary inflation differentials usually don't have an immediate effect
on currency exchange rates, the performance of the C$/A$ exchange rate since
2008 can be fully explained by the relative rates at which these currencies have
been inflated. The reason is that for years prior to October of 2008 the
year-over-year (YOY) rate of change in A$ supply was higher than the YOY rate of
change in C$ supply, leading to the A$ becoming very over-valued relative to the
C$ by mid-2008. This over-valuation was rapidly corrected during July-October of
2008. Then, in October-2008 Canada's monetary inflation rate moved above that of
Australia and has remained above it ever since. This is undoubtedly part of the
reason for the C$'s multi-year decline against the A$.
There is substantial downside risk in both the A$ and the C$ (relative to the
US$), but this risk is unlikely to materialise until after the global stock
market commences its next intermediate-term decline.
Update
on Stock Selections
Notes: 1) To review the complete list of current TSI stock selections, logon at
http://www.speculative-investor.com/new/market_logon.asp
and then click on "Stock Selections" in the menu. When at the Stock
Selections page, click on a stock's symbol to bring-up an archive of
our comments on the stock in question. 2) The Small Stock Watch List is
located at http://www.speculative-investor.com/new/smallstockwatch.html
 Company
news/developments for the week ended Friday 22nd February 2013: Company
news/developments for the week ended Friday 22nd February 2013:
[Note: FS = Feasibility Study, IRR = Internal Rate of Return, MD&A =
Management Discussion and Analysis, M&I = Measured and Indicated,
NAV = Net Asset Value, NPV(X%) = Net Present Value using a discount
rate of X%, P&P = Proven and Probable, PEA = Preliminary Economic
Assessment, PFS = Pre-Feasibility Study]
*Almaden Minerals (AAU) advised that it has commenced a diamond
drill program at its 100%-owned El Cobre porphyry copper-gold
project in Veracruz State, Mexico. A single drill will be employed
with the aim of completing between five and eight 500m+ holes.
El Cobre is at a very early stage of exploration, but shows
considerable potential. It is probably AAU's second most important
project (Tuligtic being by far the most important).
*Dragon Mining (DRA.AX) announced that Agnico Eagle (AEM) had
commenced drilling at the Hanhimaa gold project in Finland. DRA and
AEM have an agreement under which AEM can earn a 70% stake in DRA's
Hanhimaa project by spending 9M euros on exploration over 6 years.
*Evolution Mining (EVN.AX) issued its half-yearly report for the
period ended 31st December 2012. There was nothing of importance in
this report that wasn't included in the quarterly activities report
issued last month, although it is worth mentioning that the company
introduced a dividend policy. In the future EVN plans to pay a cash
dividend equal to 2% of its gold sales revenue.
It's good that EVN's management is thinking in terms of returning
cash to shareholders in the form of regular dividends, but the
amount of the currently-planned dividend is insignificant. For
example, if the aforementioned dividend policy had been in place
over the past 6 months then the dividend payment for this period
would be less than 1c/share.
*Golden Predator (GPD.TO) has changed its name to Americas Bullion
Royalty Corp and its stock symbol to AMB. The change became
effective last Friday, but we will use the old name and symbol in
today's update.
GPD announced that its Brewery Creek project in Canada's Yukon has
been delayed by government stupidity. The delay is due to the recent
decision by the Yukon Environment & Socio Economic Assessment
Board's ("YESAB") Dawson City Designated Office that it does not
have the jurisdiction to assess the reactivation of the Brewery
Creek project, and that the project must instead be reviewed by the
YESAB Executive Committee. This appears to be an arbitrary
last-minute change of mind that is not only contrary to what YESAB's
Dawson City office had led GPD to believe for many months, but also
contrary to the approval process via which other similar Yukon
projects have recently been permitted.
The ramifications of the surprise YESAB decision aren't yet known.
It could mean that Brewery Creek's development will have to be put
on hold for several months while the permitting process is repeated,
but hopefully a solution can be found.
Note that in addition to adversely affecting GPD's shareholders and
employees, YESAB's bungle has adversely affected the Tr'ondek
Hwech'in ("TH") -- the local community. The TH has been a staunch
supporter of GPD's efforts to reactivate the Brewery Creek gold mine
and will continue to work closely with GPD in relation to all
aspects of the project, including the YESAB decision.
Although this is definitely bad news, it doesn't alter our opinion.
The reason is that we are primarily interested in GPD's Nevada-based
gold royalties. We estimate that the royalty assets are worth about
$0.70/share, which means that we would perceive a lot of upside
potential in the stock even if no value were assigned to Brewery
Creek.
In other GPD-related developments, Bill Sheriff, the company's CEO,
was again a buyer of the stock last week. Sheriff bought another
223,000 shares during the panic caused by the YESAB news and the
sector-wide plunge.
*Golden Star Resources (GSS) announced that scheduled maintenance
at one of its mines had been extended from 4 days to 8 days. This is
expected to reduce Q1 gold production by 4K ounces, but isn't
expected to prevent the company from achieving its annual production
guidance.
In a more normal market this news wouldn't have had a noticeable
effect on the stock price, but the announcement came in the midst of
a sector-wide panic last week and therefore initially had a much
bigger effect than it deserved. However, GSS rebounded strongly from
its Thursday morning trough and actually managed to achieve a small
weekly gain.
*Keegan Resources (KGN) had a lot of news last week. First, there
was the announcement that the proposed KGN-PMV merger was not going
to proceed. We addressed this in last week's Interim Update. Second,
KGN confirmed that it was on track to complete the PFS for the
Esaase project by the end of Q1 and that the PFS results would be
published early in Q2. Third, KGN advised that it expected to
complete the Esaase FS and permitting process in Q3 of 2013 with the
aim of commencing mine construction in Q4-2013 and becoming a
producer in 2015. This constitutes a materially shorter development
timeline for Esaase than would have occurred if the merger with PMV
had gone ahead. Fourth, the company announced that minor
modifications to the planned ore processing method indicated that
the average gold recovery at Esaase could be improved from 88% to
92%. This is very good news.
We would have preferred that the merger with PMV had gone ahead
(because it made economic sense for both companies), but all things
considered it was a positive week on the news front for KGN.
KGN's $205M cash hoard makes it a relatively low-risk
exploration-stage gold miner in this ultra-challenging market
environment.
*Orvana Minerals (ORV.TO): It was reported on Friday that the
Department of Environmental Quality (DEQ) has tentatively approved
the last major permit needed for construction of ORV's Copperwood
copper mine in Michigan. This is obviously good news, but from our
perspective it isn't important news. At this stage we aren't
assigning much value to the Copperwood project and would prefer that
ORV kept this project 'on the backburner' until after the company
had generated sufficient cash from its operating gold-copper mines
to pay-off all debt and establish a sizeable 'cash cushion'.
Considering the lousy market in which it trades, ORV's price action
continues to be strangely constructive.
*Ramelius Resources (RMS.AX) issued its half-yearly report for the
period ended 31st December 2012. There was nothing of importance in
this report that wasn't included in the quarterly activities report
issued last month. The only thing worth mentioning is that based on
the quarterly report we thought that the company had working capital
of $50M at 31st December, but the half-year report showed that it
only had $46M.
RMS's balance sheet is healthy, but for it to remain so the company
will soon have to start generating free cash-flow.
*Sabina Gold and Silver (SBB.TO) reported an updated resource
estimate for its Back River project. The new estimate increased the
overall Back River gold resource by only 500K ounces -- from 6.0M to
6.5M. This is not the sort of resource revision that is going to
excite the average market participant, which is why the stock price
fell slightly during the hours following the news. However, the news
was a lot better than suggested by the change in the total resource.
First, more than 100% of the resource increase was in the
higher-quality M&I category (the M&I component increased from 4.0M
to 4.6M ounces and the Inferred component declined from 2.0M to 1.9M
ounces). Second, there was an increase in the average grade of the
deposit. Of particular note, the average grade of the M&I resource
increased from 5.6-g/t to 6.0-g/t. Third, the new resource estimate
is based on more conservative assumptions and is therefore more
robust than earlier resource estimates. For example, the entire
open-pit portion of the resource now uses a 1.0-g/t cut-off grade
whereas part of this portion previously used a 0.76-g/t cut-off, and
the cut-off grade applied to the underground portion of the
project's resource has doubled from 2.0-g/t to 4.0-g/t.
In summary, the resource re-estimate reported last week constituted
a much greater increase in quality than in quantity. This might not
matter to the typical retail investor, but it definitely matters to
the large-cap mining companies that are potential future acquirers
of the Back River project.
The next important milestone for SBB is expected to be the
completion of the Back River PFS in Q3-2013. In the mean time there
will be plenty of drilling news.
Chart Sources
Charts appearing in today's commentary
are courtesy of:
http://stockcharts.com/index.html
http://bigcharts.marketwatch.com/
http://www.fullermoney.com/

|

