|
-- Weekly Market Update for the Week Commencing 25th June 2012
Big Picture
View
Here is a summary of our big picture
view of the markets. Note that our short-term views may differ from our
big picture view.
In nominal dollar terms, the BULL market in US Treasury Bonds
that began in the early 1980s will end by 2013. In real (gold)
terms, bonds commenced a secular BEAR market in 2001 that will continue
until 2014-2020. (Last
update: 23 January 2012)
The stock market, as represented by the S&P500 Index, commenced
a secular BEAR market during the first quarter of 2000, where "secular
bear market" is defined as a long-term downward trend in valuations
(P/E ratios, etc.) and gold-denominated prices. This secular trend will bottom sometime between 2014 and 2020. (Last update: 22 October 2007)
A secular BEAR market in the Dollar
began during the final quarter of 2000 and ended in July of 2008. This
secular bear market will be followed by a multi-year period of range
trading. (Last
update: 09 February 2009)
Gold commenced a
secular bull market relative to all fiat currencies, the CRB Index,
bonds and most stock market indices during 1999-2001. This secular trend will peak sometime between 2014 and 2020. (Last update: 22 October 2007)
Commodities,
as represented by the Continuous Commodity Index (CCI), commenced a
secular BULL market in 2001 in nominal dollar terms. The first major
upward leg in this bull market ended during the first half of 2008, but
a long-term peak won't occur until 2014-2020. In real (gold) terms,
commodities commenced a secular BEAR market in 2001 that will continue
until 2014-2020. (Last
update: 09 February 2009)
Copyright
Reminder
The commentaries that appear at TSI
may not be distributed, in full or in part, without our written permission.
In particular, please note that the posting of extracts from TSI commentaries
at other web sites or providing links to TSI commentaries at other web
sites (for example, at discussion boards) without our written permission
is prohibited.
We reserve the right to immediately
terminate the subscription of any TSI subscriber who distributes the TSI
commentaries without our written permission.
Outlook Summary
Market
|
Short-Term
(1-3 month)
|
Intermediate-Term
(6-12 month)
|
Long-Term
(2-5 Year)
|
| Gold
|
Bullish
(26-Mar-12)
|
Bullish
(26-Mar-12)
|
Bullish
|
| US$ (Dollar Index)
|
Neutral
(28-May-12)
| Neutral
(09-Jan-12)
|
Neutral
(19-Sep-07)
|
| Bonds (US T-Bond)
|
Neutral
(11-Apr-12)
|
Neutral
(18-Jan-12)
|
Bearish
|
| Stock Market
(DJW)
|
Neutral
(25-Apr-12)
|
Bearish
(28-Nov-11)
|
Bearish
|
| Gold Stocks
(HUI)
|
Bullish
(26-Mar-12)
|
Bullish
(23-Jun-10)
|
Bullish
|
| Oil | Neutral
(31-Jan-11) | Neutral
(31-Jan-11)
| Bullish
|
| Industrial Metals
(GYX)
| Neutral
(22-Nov-11)
| Neutral
(29-Aug-11)
| Neutral
(11-Jan-10)
|
Notes:
1. In those cases where we have been able to identify the commentary in
which the most recent outlook change occurred we've put the date of the
commentary below the current outlook.
2. "Neutral", in the above table, means that we either don't have a
firm opinion or that we think risk and reward are roughly in balance with respect to the timeframe in question.
3. Long-term views are determined almost completely by fundamentals,
intermediate-term views by giving an approximately equal weighting to
fundamental and technical factors, and short-term views almost
completely by technicals.
Our Long Term Views
We thought it would be worth stepping back and taking a look at how our long-term views on the major financial markets have evolved -- or haven't evolved, as the case may be -- over the past 12 years, where a long-term view is what we expect to happen over the coming 5 years or thereabouts. So that's what we will now do, using monthly charts with different-coloured shading to indicate the periods when we were bullish, neutral and bearish (green for bullish, blue for neutral and grey for bearish). The 12-year time-span was chosen because it was roughly 12 years ago that the TSI subscription service was born. TSI is almost a teenager!
1. Gold
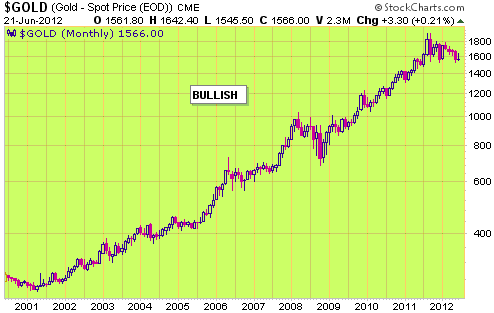
As illustrated by the above chart, we've been long-term bullish on gold over the entire period. Gold is no longer in bargain territory, but we are still unequivocally long-term bullish because central banks and governments show no signs of deviating from their monetarily and economically destructive policies. In fact, it seems that the wrong lessons have been learned from the crises of the past several years and that bad policies will be implemented with greater intensity in the future.
While the absence of any evidence of constructive policy change is the main reason we remain long-term bullish on gold, two other important factors support our outlook. The first is that there hasn't yet been a gold mania and resultant spectacular blow-off to the upside. As should be apparent from a quick glance at the above chart, gold's rise from its 2001 bottom has been steady. The second is that gold's secular bullish trend is linked to the stock market's secular bearish trend. These long-term trends began at around the same time and are likely to end at around the same time, which should mean that gold's long-term bull market won't end until equity valuations become very low by historical standards.
2. US$ (Dollar Index)
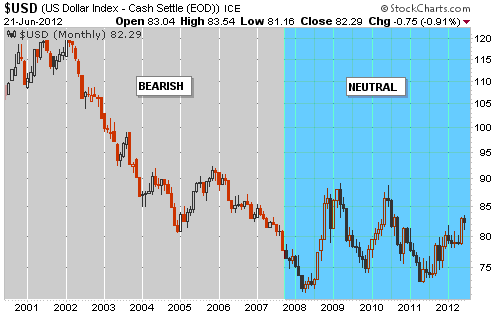
We were long-term bearish on the Dollar Index until it dropped to the high-70s in September-2007, at which point our long-term view changed to neutral. By that time the US$ was moderately under-valued relative to the euro on a purchasing-power-parity (ppp) basis, so there was a good chance that the bulk of dollar's bear market was behind it. Our guess was that the Dollar Index would spend many years oscillating in a wide range. This guess proved to be correct.
With regard to the Dollar Index's current long-term prospects, we can make a reasonable argument to be neutral and we can make a reasonable argument to be bullish. We can't make a reasonable argument to be bearish. The bearish arguments we've read focus on US$ negatives and ignore the fact that the Dollar Index is made up of currencies that share the same negatives. Moreover, the bearish arguments overlook the high risk that the US dollar's main fiat currency competitor will collapse within the next few years.
The US$ upside risk created by the possibility of a euro collapse needs to be weighed against the US$ downside risk created by having a devout inflationist at the helm of the Fed. At the moment, we think these risks offset each other.
3. Bonds (US T-Bond)
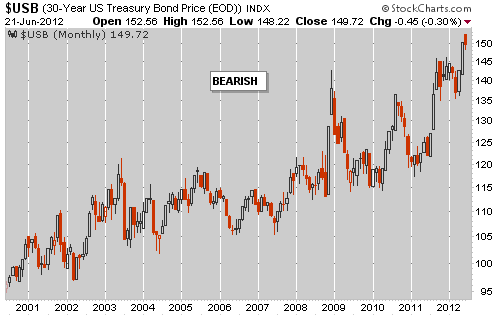
There is no way to sugarcoat the extent to which we've been wrong about the T-Bond. The T-Bond's long-term upward trend has been nowhere near as strong and consistent as gold's long-term upward trend, but this doesn't change the reality that its performance has been vastly better than we expected.
There has been a lot of monetary inflation in the US over the past 12 years and the inflation has been effective in boosting prices, but the general fear of inflation has remained in check. As a result, the T-Bond has dropped back to progressively higher lows during the boom times and then rocketed up to higher highs during the busts/crises.
Unlike a stock, a bond has a rigid limit on the amount of income it can produce over its life. This imposes a limit on its price appreciation. For example, if the 10-year T-Notes issued by the US Government last month were to gain 15% in price then their effective yield would fall to zero. Assuming that no investor would buy 10-year bonds that had a negative nominal yield, this means that T-Notes have maximum possible upside from here of less than 15%. 30-year T-Bonds have greater potential upside than 10-year T-Notes, but the upside in the price is still limited by the fixed coupon. Perhaps the T-Bond could rally another 30% if there were an all-out stampede into safe havens, but 20% is a more realistic assessment of the maximum upside potential. Even gaining an additional 10% from its current level would most likely require widespread panic.
Considering the limited additional upside potential and the huge decline that will eventually occur when inflation expectations surge, we remain long-term bearish on the T-Bond.
4. The Stock Market (historically represented in our analyses by the SPX, now represented by the
DJW)
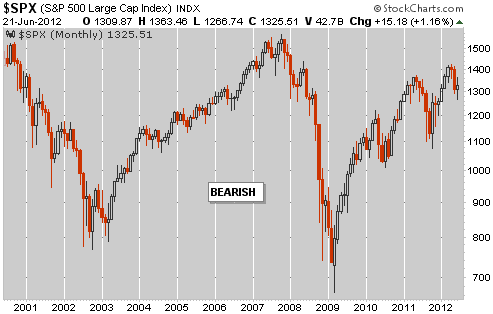
We have remained long-term bearish on the stock market throughout the past 12 years based on the theory that a secular bearish trend began in 2000 and won't end until the average valuation becomes low by traditional measures. Our expectation, then, is that the secular bear market won't end until the average stock has a P/E ratio below 10 and a dividend yield above 5%.
The S&P500 currently has a P/E ratio of about 15 and a dividend yield of about 2.3%, which probably means that the long-term bearish trend has a lot further to run. However, we doubt that the S&P500 will ever again trade below its March-2009 low or even seriously challenge this prior low. This is due to the effects of monetary inflation on asset prices and earnings. A good argument could therefore be made that we should have upgraded our long-term stock market outlook to neutral in late 2008 or early 2009, but we missed that opportunity.
As things stand right now, there is sufficient downside potential in both nominal dollar terms and valuation terms to justify a long-term bearish view.
5. Gold Stocks (HUI)
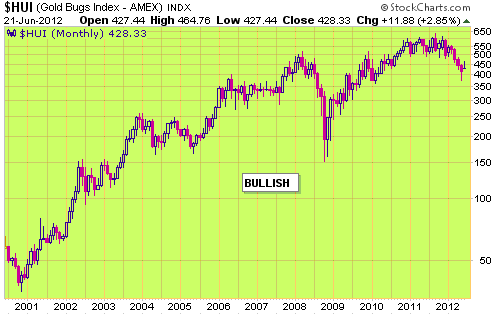
The gold sector of the stock market has spent much of the time since May of 2006 going nowhere in an interesting way. Nevertheless, it should remain in a long-term bullish trend until gold's bull market comes to an end.
6. Oil
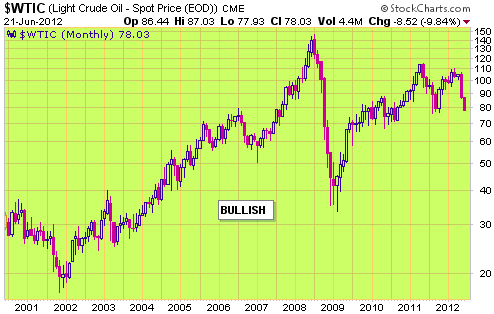
It was easy to be long-term bullish on oil during the first half of the 2000s, because during this period the commodity was very cheap in inflation-adjusted terms. However, by mid 2008 the inflation-adjusted oil price had become high enough to suggest that a secular peak was close at hand. We discussed this in TSI commentaries at the time, but wrongly maintained a long-term bullish stance on the basis that the combination of rapid monetary inflation and political impediments to oil production would cause the oil price to move much higher in nominal dollar terms following a substantial correction during 2008-2009.
Within a few months of its mid-2008 peak the oil price was again low in inflation-adjusted terms. Furthermore, even with the large rebound from its 2009 bottom the oil price is down by 60% from its 2008 peak in inflation-adjusted terms and is probably a lot closer to a major bottom than a major top. This is therefore not the right time to step away from our long-term bullish view.
7. Industrial Metals (GYX)
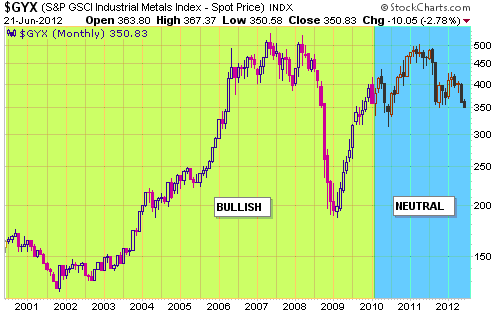
The industrial metals complex did extraordinarily well during 2003-2008. It happened this way because there was a lot of monetary inflation throughout the world and because the construction industry was one of the biggest beneficiaries of the monetary inflation in most countries. It's a good bet that there will be a lot more monetary inflation over the years ahead, but with most of the world's property bubbles having already burst it is unlikely that industrial metals will be among the major beneficiaries of this inflation.
Our long-term view on industrial metals changed from bullish to neutral at the beginning of 2010. We remain neutral.
The Stock
Market
Presidential Cycle (PC) Model Update
Our last update on how the US stock market was faring relative to the PC Model (a stock market model based on the S&P500's average performance during all Presidential Cycles from 1928 through to 2008) was in early April. At that time we wrote:
"The PC Model predicts an early-April high followed by a downward correction to a late-May low. A significant April correction is a likely prospect, but not because of the PC. The fact is that the market did much better than predicted by the Model during the first quarter and is now dangerously extended to the upside, especially considering the economic backdrop. This creates the potential for a meaningful decline.
Our expectation has been, and is, that the market's performance during the second half of this year will be very different to the performance predicted by the PC Model. Rather than accelerating upward as per an average 4th year, we expect the market to lose ground."
In other words, after doing better than predicted by the PC Model during the first three months of 2012 (the 4th year of the current presidential cycle) we thought the market would temporarily fall into line with the Model. Also, we reiterated our expectation that the market would be a lot weaker than predicted by the PC Model during the second half of the year.
The following charts of the PC Model (the average of all 4th years since 1928) and the S&P500 year-to-date make it clear that the S&P500 has, indeed, at least temporarily fallen into line with the PC Model since early April. As per the Model, a downward move unfolded between early April and the end of May. Also as per the Model, there was a rebound during the first half of June.
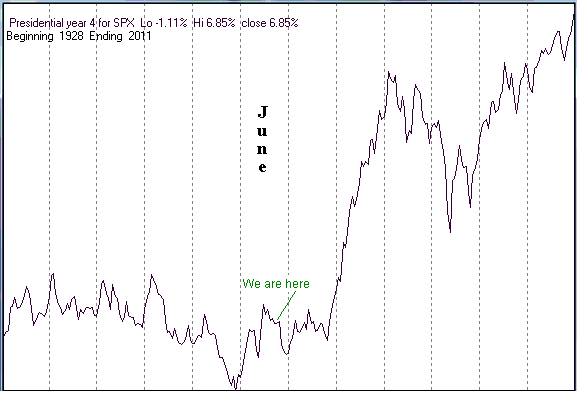
Chart Source: Mike Burk at http://alphaim.net/signup.html
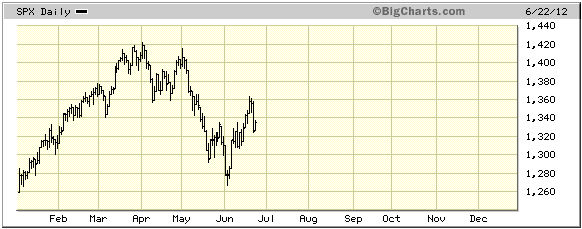
According to the PC Model, we should expect a 'choppy' consolidation over the next four weeks followed by a strong rally to a new high for the year. However, according to our current assessment the market is unlikely to do any better from here than test its Q1 high and stands a good chance of breaking below its May-June lows during August-October.
Buying opportunities are beginning to crop up
The gold sector is offering up the best buying opportunities at this time, but the market-wide price declines of the past three months have also created good buying opportunities elsewhere. Consequently, there is no need to put all of your eggs in a single gold-coloured basket.
The O&G (oil and gas) service sector is one area of the stock market that offers substantial long-term upside potential and is now sufficiently 'oversold' to establish an attractive short-term reward/risk ratio. Here are a couple of ideas for follow-up:
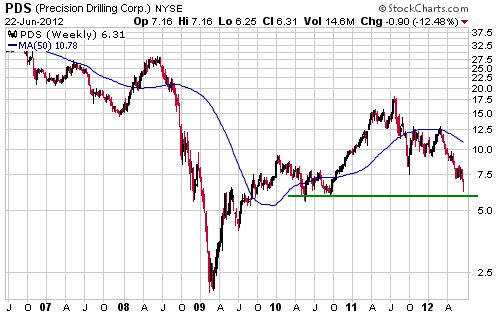
1. Precision Drilling Corp. (NYSE: PDS)
PDS is a very profitable O&G drilling services company with operations in Canada and the US. Its stock traded as high as $17.50 last July in response to manic enthusiasm for O&G services stocks, but closed near a three-year low at US$6.31 last Friday due to market depression. We don't follow the company closely so it's possible that we are missing something, but as far as we can tell PDS is now being valued by the stock market at around 4-times this year's earnings and 0.8-times book value.
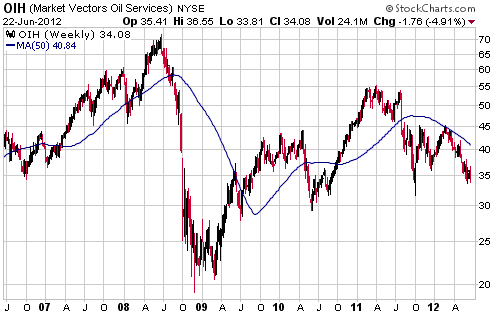
2. The Market Vectors Oil Services ETF (NYSE: OIH)
Individual company risk can be avoided by purchasing exposure to the O&G services sector via OIH. This ETF is down by almost 40% from last year's high and is only about 15% above its low of the past three years, but O&G services is fundamentally one of the strongest sectors of the North American economy.
Current Market Situation
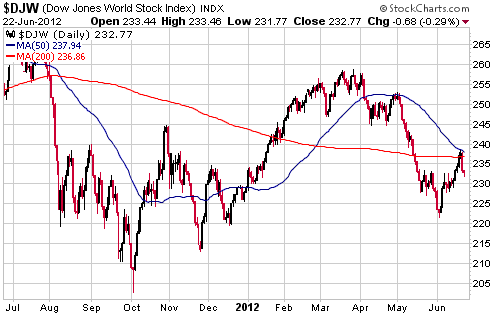
The following daily chart shows that the Dow World Index (DJW) rebounded as far as its 50-day MA before reversing lower last Thursday. Assuming that a rebound peak is in place, this effectively means that the DJW's rebound did the least it could reasonably be expected to do.
At this stage we don't have a strong opinion as to whether a rebound peak is in place.
This week's
important US economic events
| Date |
Description |
| Monday Jun 25 | New
Home Sales
Dallas Fed Manufacturing Survey
| | Tuesday Jun 26 | Case-Shiller
Home Price Index
Consumer Confidence
| | Wednesday Jun 27 | Durable
Goods Orders
Pending Home Sales Index | | Thursday
Jun 28 |
Q1 GDP (next revision)
|
| Friday Jun 29 | Personal
Income and Spending
Chicago PMI
Consumer Sentiment
|
Gold and
the Dollar
Gold and Silver
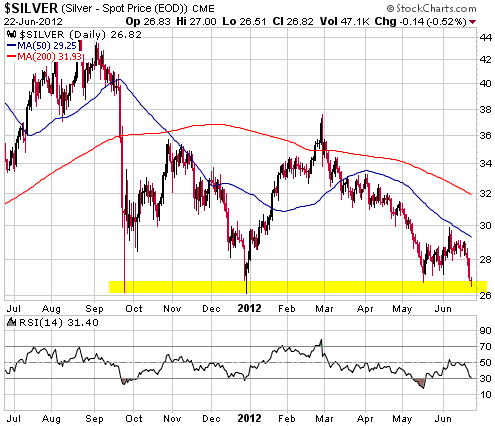
Silver dropped back to intermediate-term support at $26-$27 late last week. When it dropped to this price range in September-2011, December-2011 and again in May-2012, we wrote that it was a buying opportunity. This time around is no different, despite the fact that the more times a support level is tested the higher the probability of the support being breached.
This excerpt from the 16th May-2012 Interim Update applies to the current situation:
"Our impression of silver as an investment is now diametrically opposite to what it was in April of last year. Throughout April of last year we were very concerned about silver's downside risk and regularly suggested ways of hedging against a major decline in the silver price. Our impression now is that most of the downside risk has been 'wrung out' of the silver market and that patient long-term investors should be buying.
We expect that silver will continue to hold at or above last year's lows, but we would allow for the possibility that a panic could lead to a spike down to the low-$20s. Allowing for this possibility simply involves gradually scaling into a full position over several months."
One positive is that silver made a new low for the year on Friday while its daily RSI(14), which is shown at the bottom of the following chart, made a materially higher low. This is a bullish divergence.
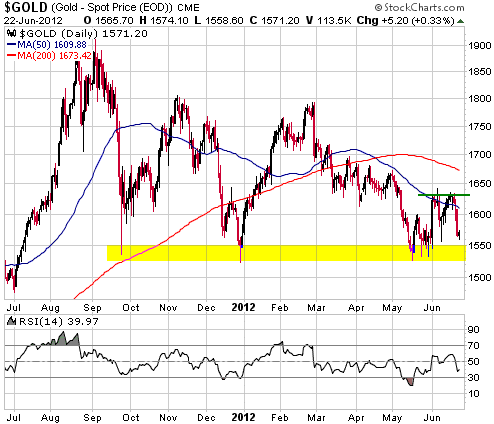
Gold didn't quite make it back to intermediate-term support, but its situation is similar to silver's. We point out, in particular, that gold has made multiple tests of support at $1525-$1550, increasing the risk of a breach. However, we also point out that if support is unexpectedly breached over the days ahead then we should end up with three bullish divergences. This is because the breach of support probably wouldn't be confirmed by the HUI, the HUI/gold ratio or gold's daily
RSI.
Gold Stocks
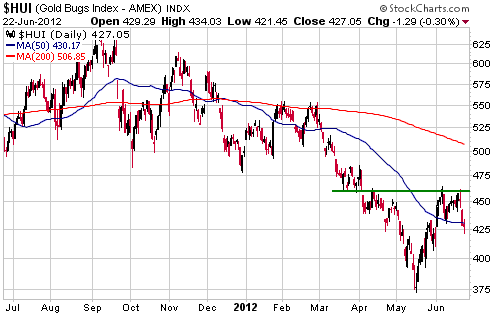
Over the past three weeks we've suggested 420-430 as a likely range for the HUI's correction low. The HUI hit the top of this range about two weeks ago and hit the bottom of this range last Friday. We don't know that a correction low is in place, but so far nothing out of the ordinary has happened.
A daily close above 460 would be the final piece of the puzzle, as it would eliminate the smidgen of remaining doubt that an intermediate-term bottom was put in place last month.
Currency Market Update
The A$/Yen ratio is a barometer that indicates whether the financial world is in "risk off" or "risk on" mode. When A$/Yen is trending upward (the A$ is strengthening relative to the Yen), growth is favoured over safety and the markets are in "risk on" mode. When A$/Yen is trending downward, safety is favoured over growth and the markets are in "risk off" mode.
There was a huge shift towards safety from July-2008 through to March-2009 and then a huge shift towards growth from March-2009 through to April-2010, but since April of 2010 the oscillations have been smaller and more frequent. The situation is illustrated by the A$/Yen chart displayed below.
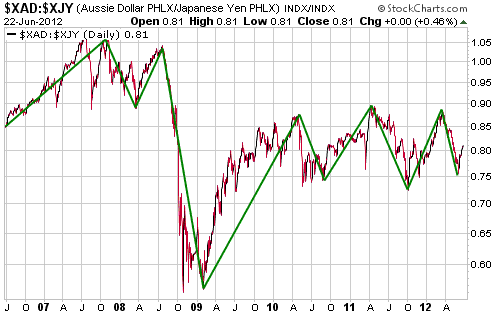
A "risk off" (shift towards safety) trend began in March-2012 and might have ended on the first trading day of June. If so, we could see some 'surprising' strength in stock and commodity markets over the next 1-2 months.
The A$/Yen ratio bears watching closely over the days/weeks ahead. In general, the best time to turn bearish on 'growth' is after the "risk on" trade has been running for long enough to push A$/Yen above 0.86, and the worst time to turn bearish on 'growth' is after the "risk off" trade has been running for long enough to push A$/Yen below 0.76.
The upshot: Be cautious due to longer-term risk, but don't be making short-term bearish bets against growth-oriented investments at this time.
Update
on Stock Selections
Notes: 1) To review the complete list of current TSI stock selections, logon at
http://www.speculative-investor.com/new/market_logon.asp
and then click on "Stock Selections" in the menu. When at the Stock
Selections page, click on a stock's symbol to bring-up an archive of
our comments on the stock in question. 2) The Small Stock Watch List is
located at http://www.speculative-investor.com/new/smallstockwatch.html
 Prodigy Gold (TSXV: PDG). Shares: 293M issued, 313M fully diluted. Recent price: C$0.57 Prodigy Gold (TSXV: PDG). Shares: 293M issued, 313M fully diluted. Recent price: C$0.57
We introduced exploration-stage gold miner PDG.V in the 13th June Interim Update. At that time we wrote:
"There is a lot to like about PDG. We like the location of its project (Ontario, Canada). We like its balance sheet ($55M of cash, which is more than enough to fund its activities over the next 12 months). We like some technical aspects of the project, such as the deposit's suitability for open-pit mining and decent average grade of around 1.2-g/t. And we like the current valuation."
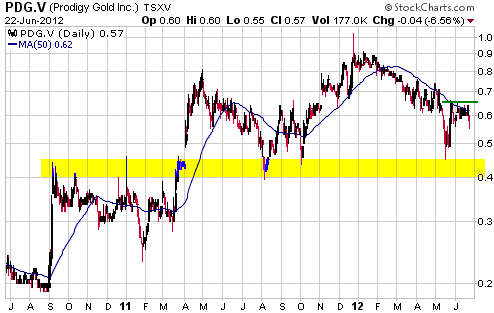
We then summarised the technical and financial aspects of PDG's Magino project and noted that the stock was trading at a huge discount to the net present value estimated in the December-2011 Preliminary Economic Assessment (PEA). We mentioned that the main company-specific risk was environmental permitting and that support at C$0.40-$0.45 probably defined the maximum downside risk in the stock price (the stock was trading at C$0.60 at the time). We ended with the statement that we would add PDG to the TSI Stocks List if it traded at C$0.54 within the next two months.
PDG hasn't quite made it down to C$0.54, but it did trade as low as C$0.55 on Friday. We won't be surprised if our previously stipulated C$0.54 buy level is reached this week, but we aren't going to attempt to pinch any more pennies. As we see it, the stock now has downside risk of about C$0.15 and upside potential over the next 12 months of about C$1.00, making for an attractive reward/risk. We have therefore added PDG to the TSI Stocks List at Friday's closing price of C$0.57.
By the way, we still plan to reduce the number of stocks in the TSI List. In the current market, however, it's a lot easier to find buying opportunities than selling opportunities.
 Volta Resources (TSX: VTR). Shares: 155M issued, 165M fully diluted. Recent price: C$0.63 Volta Resources (TSX: VTR). Shares: 155M issued, 165M fully diluted. Recent price: C$0.63
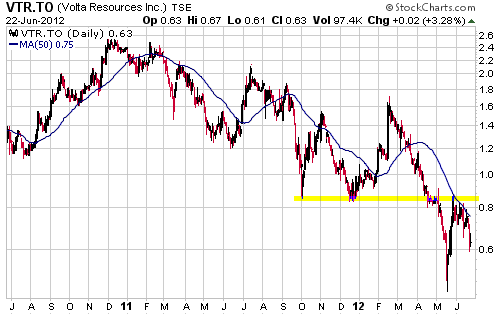
There's no change to the VTR story, except that last Thursday's downdraft in the gold sector caused the price of the company's shares to drop back to the low-C$0.60s. VTR is one of the best value propositions in the gold sector.
C$1.20 would be the chart-based target following a daily close above resistance at C$0.85-$0.90, but even at $1.20 (roughly double the current price) the stock would offer good value.
 New trading position: Market Vectors Junior Gold Miners ETF (GDXJ). Current price:
US$19.45 New trading position: Market Vectors Junior Gold Miners ETF (GDXJ). Current price:
US$19.45
If at first you don't succeed, give
up try again.
We are going to try another GDXJ short-term trade. Our guess is that GDXJ's rally from its mid-May low to its early-June high was just the first leg of a new upward trend and that the first downward correction was either complete or almost complete at last Friday's intra-day low. A daily close above $22 would validate this guess and suggest a 3-month upside target of around $26. In other words, we perceive short-term upside potential of about 30%.
We aren't going to set a sell stop at this time.
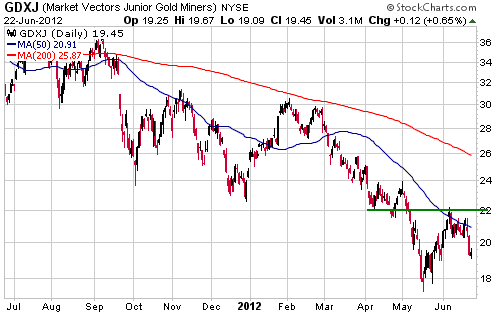
Chart Sources
Charts appearing in today's commentary
are courtesy of:
http://stockcharts.com/index.html
http://bigcharts.marketwatch.com/

|

