|
-- Weekly Market Update for the Week Commencing 25th November 2013
Big Picture
View
Here is a summary of our big picture
view of the markets. Note that our short-term views may differ from our
big picture view.
In nominal dollar terms, the BULL market in US Treasury Bonds
that began in the early 1980s will end by 2013. In real (gold)
terms, bonds commenced a secular BEAR market in 2001 that will continue
until 2014-2020. (Last
update: 23 January 2012)
The stock market, as represented by the S&P500 Index,
commenced
a secular BEAR market during the first quarter of 2000, where "secular
bear market" is defined as a long-term downward trend in valuations
(P/E ratios, etc.) and gold-denominated prices. This secular trend will bottom sometime between 2014 and 2020.
(Last update: 22 October 2007)
A secular BEAR market in the Dollar
began during the final quarter of 2000 and ended in July of 2008. This
secular bear market will be followed by a multi-year period of range
trading.
(Last
update: 09 February 2009)
Gold commenced a
secular bull market relative to all fiat currencies, the CRB Index,
bonds and most stock market indices during 1999-2001.
This secular trend will peak sometime between 2014 and 2020.
(Last update: 22 October 2007)
Commodities,
as represented by the Continuous Commodity Index (CCI), commenced a
secular BULL market in 2001 in nominal dollar terms. The first major
upward leg in this bull market ended during the first half of 2008, but
a long-term peak won't occur until 2014-2020. In real (gold) terms,
commodities commenced a secular BEAR market in 2001 that will continue
until 2014-2020.
(Last
update: 09 February 2009)
Copyright
Reminder
The commentaries that appear at TSI
may not be distributed, in full or in part, without our written permission.
In particular, please note that the posting of extracts from TSI commentaries
at other web sites or providing links to TSI commentaries at other web
sites (for example, at discussion boards) without our written permission
is prohibited.
We reserve the right to immediately
terminate the subscription of any TSI subscriber who distributes the TSI
commentaries without our written permission.
Outlook Summary
Market
|
Short-Term
(1-3 month)
|
Intermediate-Term
(6-12 month)
|
Long-Term
(2-5 Year)
|
|
Gold
|
Neutral
(04-Nov-13)
|
Bullish
(26-Mar-12)
|
Bullish
|
|
US$ (Dollar Index)
|
Neutral
(24-Dec-12)
|
Neutral
(18-Sep-13)
|
Neutral
(19-Sep-07)
|
|
Bonds (US T-Bond)
|
Neutral
(11-Nov-13)
|
Neutral
(18-Jan-12)
|
Bearish |
|
Stock Market
(DJW)
|
Neutral
(18-Nov-13)
|
Bearish
(28-Nov-11)
|
Bearish
|
|
Gold Stocks
(HUI)
|
Neutral
(04-Nov-13)
|
Bullish
(23-Jun-10)
|
Bullish
|
|
Oil |
Neutral
(30-Jul-12)
|
Neutral
(31-Jan-11)
|
Bullish
|
|
Industrial Metals
(GYX)
|
Bearish
(06-Nov-13)
|
Bearish
(13-Nov-13)
|
Neutral
(11-Jan-10)
|
Notes:
1. In those cases where we have been able to identify the commentary in
which the most recent outlook change occurred we've put the date of the
commentary below the current outlook.
2. "Neutral", in the above table, means that we either don't have a
firm opinion or that we think risk and reward are roughly in balance with respect to the timeframe in question.
3. Long-term views are determined almost completely by fundamentals,
intermediate-term views by
fundamentals, sentiment and technicals, and short-term views by sentiment and
technicals.
The Widowmaker Trade
Due to the Japanese government's massive
debt burden (as a % of GDP, Japan's government has almost three times as much
debt as the US government), Japan's bearish demographics and Japanese bond
yields that are so low they couldn't possibly go much lower, there is always a
great temptation to 'short' Japanese Government Bonds (JGBs). However, despite
the obvious appeal of this trade it has lost money almost every year for the
past two decades. That's why it has come to be called "the widowmaker trade". It
is said that you can't claim to be a serious speculator until you've lost money
shorting JGBs.
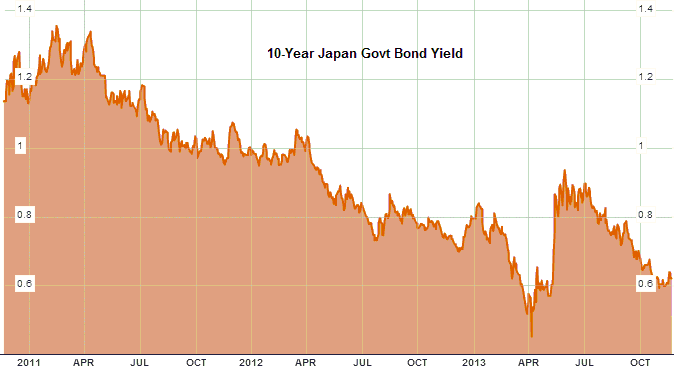
At one point it looked like 2013 would be the year in which the JGB 'shorts'
finally profited in a big way. As evidenced by the following chart of the
10-year JGB yield, they certainly could have profited in a big way if they were
nimble and had excellent timing. Specifically, big profits were available to
anyone with the skill or the luck to have established a short JGB position (a
bet on rising yields) near the bottom of the late-March-to-early-April yield
plunge and then closed the position near the top of the April-May yield surge.
However, very few traders would/could have accomplished this.
For those who were short JGBs at the start of 2013 and maintained their
position, it looks like being another losing year. The reason is that with only
about 5 weeks left in the year, the bond yield is materially lower than where it
began the year (0.63% at the end of last week versus around 0.80% at the
beginning of the year). The "widowmaker trade" therefore continues to live up to
its reputation, despite the 'valiant' efforts of the BOJ to depreciate the Yen.
We have never bet against the JGB market, but at the start of this year we did
cite the potential bursting of the government bond bubble in general and the JGB
bubble in particular as one of the biggest risks facing the financial world.
Here's what we wrote in our 2013 Yearly Forecast:
"There's a new big intermediate-term risk facing the financial world as 2013
gets underway: the risk that the government bond bubble will burst. The bursting
of the government bond bubble is a more pressing concern today than it was, say,
6 months ago due to the immense political pressure being put on the Bank of
Japan (BOJ) to reduce the purchasing power of the Yen. We don't know yet if the
BOJ will actually take the actions required to reduce the Yen's purchasing power
at the rate demanded by Japan's new government, but if it does then bond yields
will be pushed a lot higher in Japan and the yields on other 'safe haven'
government bonds will likely follow."
To say that 2013 generally hasn't panned out as we expected would be an enormous
understatement. However, even though the JGB yield remains near its all-time
low, we don't think we were wrong to single-out the bursting of the JGB bubble
as a global risk. The risk hasn't yet materialised, but the probability of it
doing so within the coming 12 months is uncomfortably high.
We like the risk/reward of betting against the JGB market with the 10-year yield
below 0.70%. A bearish JGB speculation (a bet on falling bond prices and rising
bond yields) actually interests us much more than a bearish T-Bond or T-Note
speculation, because the JGB yield is a lot lower and because the JGB market is
further along in its major topping process. We aren't going to risk any money on
the "widowmaker trade", though, because with limited resources we can't attempt
to profit from every opportunity.
The Japanese Government's
Tail-Chasing
Although Japan's rate of monetary inflation
remains relatively low, currency traders became convinced over the past 12
months that a great Yen depreciation was in the offing and aggressively sold the
Yen against the US$. The Japanese government therefore got the large reduction
in the Yen/US$ exchange rate it was hoping for. However, the overall effect of
this devaluation is probably not what was hoped for, even though it is exactly
what should have been expected by anyone with a modicum of economic sense.
In their efforts to spur exports by devaluing the Yen, the Japanese government
is 'chasing its tail'. In Yen terms exports are rising, but imports are rising
faster. Moreover, the reason that imports are rising faster than exports is
Japan's current need to import the bulk of its energy-related commodity usage.
The further the Yen falls on the foreign exchange market, the higher the prices
paid in Japan for imported oil, coal and natural gas. The result: Japan just
reported its largest-ever October trade deficit.
Devaluing a currency can never provide a net benefit to an economy. In the short
and intermediate terms, all it does is change how the economic pie is divided.
Some entities benefit from the devaluation, but only at the expense of other
entities. In the long term the price distortions and unfair wealth
redistribution caused by the devaluation make the overall pie smaller than it
would otherwise have been.
In Japan's case, for example, multi-national corporations are the main
beneficiaries. This is generally not because the relatively cheap Yen enables
these corporations to be more competitive, but because foreign earnings are
given an artificial boost when converted to Yen. Take, for instance, Toyota and
Honda. These large Japanese automakers sell a lot of cars in the US, but most of
the cars they sell in the US are made in the US. The cheaper Yen therefore
doesn't make a significant difference to US sales of Toyotas and Hondas, but it
does mean higher Yen-denominated profits for these automakers since every US
dollar of profit is worth 20% more Yen today than it was a year ago. The higher
profits of companies such as Toyota and Honda are effectively being paid by
Japanese consumers of energy.
Uranium Update
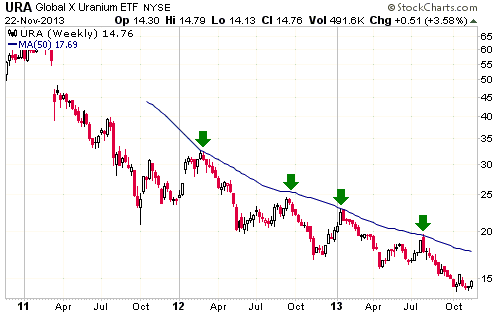
A small rebound in the uranium price has
resulted in a small increase in the demand for uranium-related equities. This is
reflected by the uptick at the end of the following weekly chart of URA (the
Global X Uranium ETF).
With reference to the following chart, notice that all of the significant
rebounds in URA over the past two years have ended at or just below the 50-week
moving average (the blue line). A solid break above this moving average would
therefore signify a change of character.
When it eventually happens, we will consider a weekly close above the 50-week MA
to be clear-cut evidence that the long-term bear market in the uranium-mining
sector is over.
The Stock
Market
Why it is different this time
"This time it's different" is one of the most dangerous sentiments in the world
of investing, but in some respects the present is always different from the
past. No two situations are identical, and sometimes the investment landscape
changes in a way that is, for all practical intents and purposes, permanent.
The current market situation is different in a very important way from any prior
situation.
We are referring to the fact that this is the first time in its 100-year history
that the Fed has aggressively pumped money into the economy and put extreme
downward pressure on interest rates with the stock market at/near an all-time
high. The full implications of this difference are not yet known, but one
possibility is that the current cyclical bull market in US equities will break
the longevity record.
The current cyclical bull market is already the third longest of the past 100
years (behind the cyclical bulls of the 1920s and 1980s) and would become the
longest if it were to extend beyond July of next year.
We are not forecasting such an extension and we certainly wouldn't bet on it. We
are simply acknowledging the reality that the most extraordinary monetary
accommodation in US history could lead to the longest cyclical upward trend in
stock prices in US history.
As mentioned in an earlier commentary, in the unlikely -- but not impossible --
event that the bull market does continue for another 12 months, there will
probably be a shift in leadership, with commodity-related (including
gold-related) stocks shifting from laggards to leaders. This would be similar to
what happened during the final 12 months of the 1982-1987 bull market.
Current Market Situation
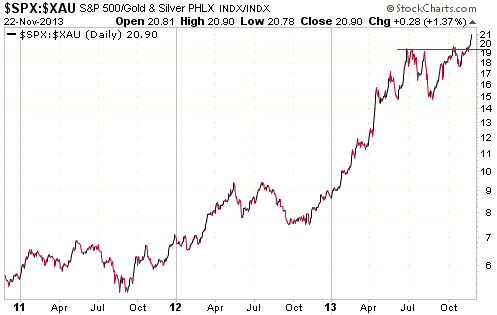
Over the first 6 months of this year there was an upside blow-off in the broad
US stock market (as represented by the SPX) relative to the gold sector of the
stock market (as represented by the XAU). This is the parabolic advance
culminating in late June shown on the following SPX/XAU chart.
For a while it looked like the July-August decline in the SPX/XAU ratio marked
the beginning a new trend of at least intermediate-term significance, but the
decline was cut short and a second upside blow-off is now in progress.
There is no way of knowing how far this latest blow-off will extend, or even if
it will extend beyond last week's high. What we do know is that upside blow-offs
are almost always retraced in full, and that once they get underway the
retracements usually happen quickly.
This week's
important US economic events
| Date |
Description |
| Monday Nov 25 |
Pending Home Sales Index
Dallas Fed Mfg Survey | | Tuesday
Nov 26 |
Housing Starts
Case-Shiller Home Price Index
Consumer Confidence
Richmond Fed Mfg Index | | Wednesday
Nov 27 |
Durable Goods Orders
Chicago PMI
Leading Economic Indicators
Consumer Sentiment | | Thursday
Nov 28 |
US markets closed for Thanksgiving
|
| Friday Nov 29 |
No important events scheduled |
Gold and
the Dollar
Gold
GLD's Gold
When the public's demand for an investment increases, the financial
intermediaries of the world (banks, brokers, etc.) will come up with new
products that can be sold to the public to take advantage of the rising
investment demand. Therefore, in 2004, after it became obvious that gold had
commenced a new bull market and that the general desire to own gold-related
investments was on the rise, products to capitalise on this new trend were
inevitably born. An ETF called the SPDR Gold Trust (NYSE: GLD) was one of these
products.
Each GLD share is fully backed by physical gold in a vault, with the amount of
gold per share falling by a tiny amount each year due to the cost of storing the
physical gold. Furthermore, arbitrage trading by "authorised participants"
(AP's) ensures that the market price of a GLD share never deviates far from its
net asset value (NAV), where the NAV is determined by the market value of the
physical gold held by GLD.
For example, if the market price of a GLD share rises above its NAV, an AP will
take advantage of the opportunity to make a risk-free profit by either 1) buying
physical gold, exchanging the physical gold for GLD shares (injecting gold
bullion into GLD) and selling the GLD shares on the stock market, or 2) selling
GLD shares and simultaneously buying physical gold. Note that whereas the first
of these arbitrage trades could only be done by an AP, any large trader with low
transaction costs could do the second trade.
For another example, if the market price of a GLD share falls below its NAV, an
AP will take advantage of the opportunity to make a risk-free profit by either
1) redeeming GLD shares for physical gold, selling the gold and using the
proceeds to purchase GLD shares, or 2) buying GLD shares and simultaneously
selling physical gold. Note again that any large trader with low transaction
costs could do the second arbitrage trade, but only an AP could do the first.
Due to arbitrage trading and the fact that GLD is a convenient way for large
speculators to gain exposure to a physical gold surrogate, the GLD price tends
to rise faster than the bullion price during major upward trends in the gold
market and fall faster than the bullion price during major downward trends in
the gold market. Consequently, while there has been no consistent correlation
between short-term changes in the gold price and short-term changes in GLD's
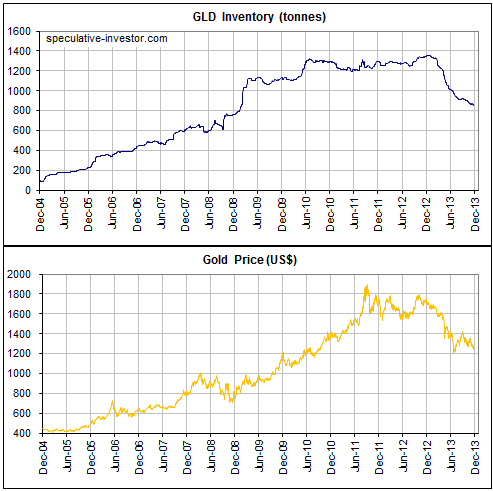
holding of physical gold, the major upward trend in the gold price during
2004-2011 resulted in a substantial increase in GLD's inventory (arbitrage
trading causes physical gold to be added to GLD's inventory when GLD's price
rises faster than the spot gold price) and this year's major downward trend in
the gold price resulted in a substantial decrease in GLD's inventory (arbitrage
trading causes physical gold to be removed from GLD's inventory when GLD's price
falls faster than the spot gold price). The following chart depicts this
relationship.
Now, although the flows of gold into and out-off GLD are not important
determinants of gold's long-term or intermediate-term price trends, these flows
almost certainly exacerbate the existing trends. That is, GLD gold flows almost
certainly caused the gold price to move higher than it would otherwise have done
during 2004-2011 (especially from Q4-2008 through to 2011, when GLD became
popular with some very large speculators) and then fall by a greater percentage
than it would otherwise have done during 2013. In more general terms, the
existence of GLD and similar funds will tend to give the overall investment
demand for physical gold an additional boost during cyclical up-swings and
reduce the overall investment demand for physical gold during cyclical
down-swings. Like leverage, therefore, GLD is a 'doubled-edged sword'.
Current Market Situation
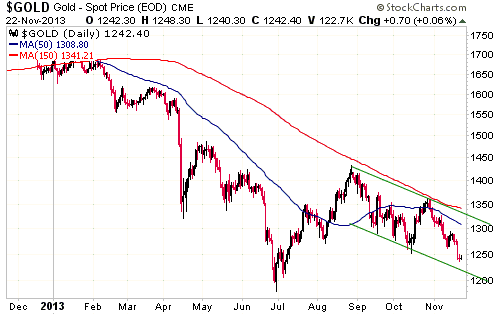
The recent price action suggests that gold is headed for a test of its June low
($1150-$1200).
There isn't much in the way of chart-related support between the current price
in the $1240s and the June low, although the market action since the August high
could be defining a downward-sloping channel with a bottom currently around
$1220. That is, there is possibly some short-term support near $1220.
Former support at $1270 is now the first significant level of resistance.
On a short-term basis, sentiment is the most important factor in gold's favour.
Almost everyone, including the majority of long-term bulls, now expects a test
of the June low. The gold market could therefore catch the maximum number of
traders off-side by making a sustainable turn upward from near its current
price.
As mentioned in last week's Interim Update, we would now view consecutive daily
closes above $1280 as evidence that a sustainable turn upward had occurred.
Gold Stocks
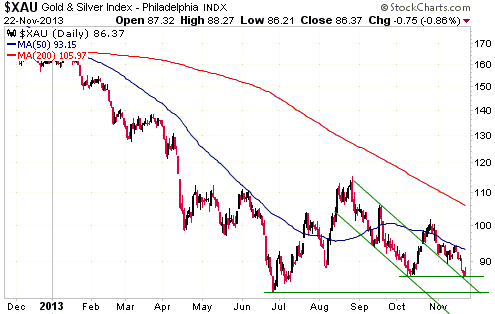
The XAU ended last week at its early-October low and the top of the short-term
channel from which it escaped during the second half of October. In other words,
it ended last week at short-term support. More important support is defined by
the June low -- about 5% below last week's close.
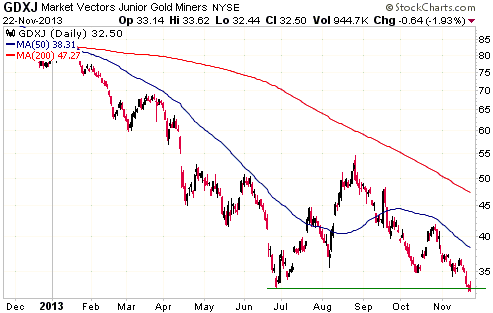
GDXJ, a proxy for the junior end of the gold-stock universe, ended last week
marginally below its June low. This means that during its 4-year lifespan GDXJ
has never been lower than it is right now.
Sentiment in the gold-mining sector already reached levels consistent with a
bear-market bottom several months ago. Since then, the price of the average
gold-mining stock has essentially flat-lined, but we get the impression that
sentiment is now even more depressed. Prices could still go lower in the very
short-term, especially at the junior end of the market in reaction to tax-loss
selling, but anyone with a sizeable cash reserve should be licking their lips
due to the bargains on offer.
Currency Market Update
With the Dollar Index and the euro in consolidation mode and not doing anything
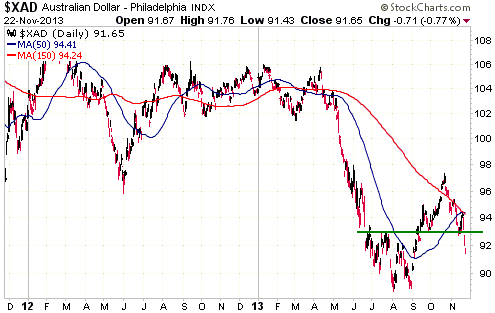
noteworthy, we'll address the recent performance of the Australian Dollar (A$).
Our most recent A$ update was in the 28th October Weekly Update -- just after
this currency had tested major resistance in the 96-98 range. At that time we
wrote:
"When the A$ broke below support at 96-98 during the second quarter of this
year it completed a major topping pattern. After slumping to 89 during the third
quarter it has since rebounded to the former support (now resistance) at 96-98.
Here are the two most likely A$ scenarios:
1. A bear market rebound has just ended and a downward trend to new multi-year
lows has just begun.
2. The bear market is not over, but perceived recovery in China and weakness in
the US$ mean that the rebound is also not over. In this case, the A$ will
consolidate over the next few weeks and probably drop back to near its 50-day MA
before resuming its short-term upward trend."
With the A$ having since broken below its 50-day MA and lateral support at 93
(refer to the following daily chart), the first of these scenarios has become by
far the more likely. However, the A$ is now 'oversold' on a short-term basis, so
a 1-2 week consolidation/rebound will probably soon begin.
Update
on Stock Selections
Notes: 1) To review the complete list of current TSI stock selections, logon at
http://www.speculative-investor.com/new/market_logon.asp
and then click on "Stock Selections" in the menu. When at the Stock
Selections page, click on a stock's symbol to bring-up an archive of
our comments on the stock in question. 2) The Small Stock Watch List is
located at http://www.speculative-investor.com/new/smallstockwatch.html
 Company
news/developments for the week ended Friday 22nd November 2013: Company
news/developments for the week ended Friday 22nd November 2013:
[Note: AISC = All-In Sustaining Cost, FS = Feasibility Study, IRR =
Internal Rate of Return, MD&A = Management Discussion and Analysis,
M&I = Measured and Indicated, NAV = Net Asset Value, NPV(X%) = Net
Present Value using a discount rate of X%, P&P = Proven and
Probable, PEA = Preliminary Economic Assessment, PFS =
Pre-Feasibility Study]
*Pilot Gold (PLG.TO) reported the first batch of results from the
2013 drilling program at its Kinsley Mountain project in Nevada.
Included in this batch were several significant results, such as
15.6 g/t Au over 3.0 metres in Hole PK083C and 2.51 g/t Au over 16.8
meters in Hole PK102, and one spectacular result: 8.53 g/t Au over
36.6 metres in Hole PK091CA.
It's early days, but these results are consistent with PLG-management's
theory that Kinsley Mountain hosts a geologically similar deposit to
the Long Canyon deposit that was sold to Newmont Mining for about
$2B in 2011.
For TSI stock selections, PLG's initial set of Kinsley Mountain
drilling results was the second-best news of the past week.
*Premier Gold (PG.TO) announced the initial resource estimate for
its Cove gold project in Nevada. The total initial resource is
around 420K ounces (143K ounces Indicated plus 279K ounces Inferred)
at an average grade of about 10-g/t. A resource estimate of this
size is not the sort of development that is going to generate
meaningful speculative interest in the stock in the current
depressed market, but it constitutes a good start. Of particular
significance is the high grade of the resource.
PG also announced some drilling results from the Cove project that
suggest expansion potential beyond the main deposit.
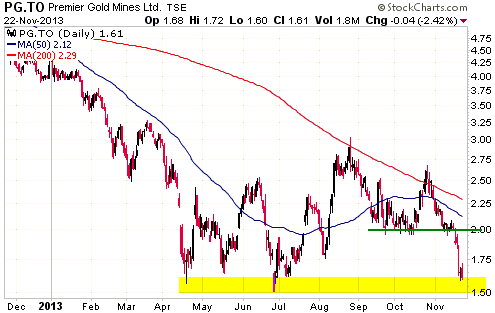
After holding up relatively well over the preceding few weeks, PG's
stock price fell sharply last week. We suspect that this was due to
technically-oriented trading in reaction to the break below obvious
chart support at C$2.00.
PG is now testing support defined by its June low. It is likely to
rebound relatively quickly once the overall sector turns higher and
is a good candidate for new buying.
*Pretium Resources (PVG) announced results from the milling of its
10,000-tonne bulk sample prior to the start of trading last Friday.
This was about two weeks earlier than anticipated. With 82% of the
milling complete, the amount of gold produced is about 4,200 ounces.
This is 200 ounces more than predicted by the Snowden resource model
for the full 10,000 tonnes and suggests that production from the
entire bulk sample is going to be in the 4,500-5,000 ounce range.
The final results are now expected in mid-December.
The fact that the amount of gold produced from the bulk sample is
going to be higher than predicted means that the average grade of
the portion of the deposit that was sampled is a bit higher than
indicated by the Snowden resource model. This is VERY good news, but
doesn't fully resolve the concerns raised by Strathcona about the
validity of the resource model.
The next step in addressing the concerns of the skeptics will be a
comparison of the gold produced from each cross-cut of the bulk
sample with the amount of gold production predicted by the resource
model for the same cross-cut. Such a comparison will provide a
better indication of the accuracy of the resource model than simply
comparing total ounces predicted with total ounces produced. We
assume that a comparison of this nature will form part of the final
test results reported in mid-December.
Appropriately (given the news), there was a huge rally in PVG shares
last Friday on enormous volume. The following chart illustrates the
situation.
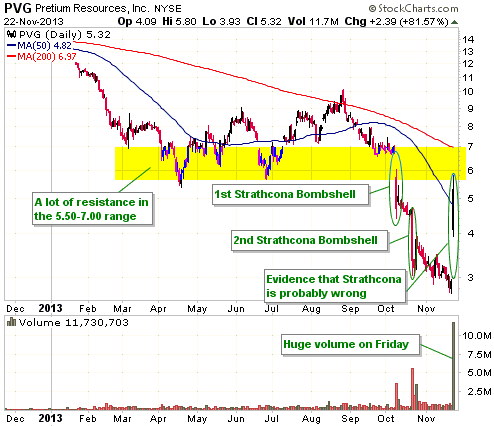
Considering the decline in risk due to confirmation that the bulk
sample contains at least as much gold as projected, PVG is a better
buy now than it was in the immediate aftermath of the first
Strathcona 'bombshell' in early October. However, for four reasons
we would not buy at this time. First, Friday's ferocious rebound
took the stock almost all the way back to substantial resistance. In
the absence of a big sector-wide rebound it is unlikely to exceed
this resistance between now and year-end. Second, when the HUI was
trading at its current level in June, which was well before the
Strathcona controversy, PVG was trading at around US$6.00. This
suggests to us that if not for the Strathcona-caused fear, PVG would
now be trading at around US$6.00. This is only about 5% above
Friday's intra-day high and 15% above Friday's close. Third, the
good news announced last Friday doesn't completely resolve the
issue. Fourth, a better buying opportunity will probably arise late
next month in response to some additional near-term weakness in the
overall sector and/or tax-loss selling.
*Ramelius Resources (RMS.AX) advised that it has sourced a
temporary replacement for the failed ball mill motor at its Mt
Magnet gold mine. The temporary replacement will enable the mill to
operate at 85% capacity until the original motor is reinstalled at
the end of January.
The company intends to announce the expected effect on production in
early December.
 List
of candidates for new buying List
of candidates for new buying
This week we don't have a list, just a single stock. The reason is that as a
result of recent price action this stock clearly stands out as the best
candidate for new buying in today's depressed market.
We are referring to Rio Alto Mining (NYSE: RIOM, TSX: RIO). RIO has recently
been clobbered in the stock market, despite the fact that it is one of the few
gold producers that is very profitable at the current gold price. Golden Star
Resources (GSS) is much cheaper than RIO by most valuation measures, but GSS is
not close to being profitable at the current gold price. Endeavour Mining (EDV.TO)
also has a lower valuation than RIO, but EDV would be doing little more than
breaking even at the current gold price.
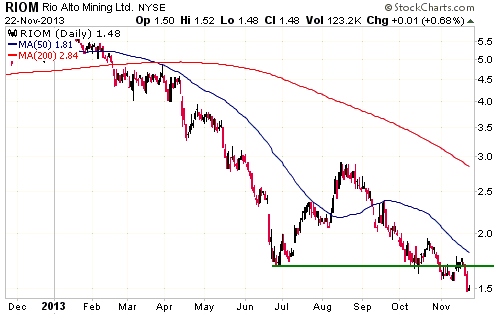
Chart Sources
Charts appearing in today's commentary
are courtesy of:
http://stockcharts.com/index.html
http://www.bloomberg.com/

|

