|
-- Weekly Market Update for the Week Commencing 26th January 2009
Big Picture
View
Here is a summary of our big picture
view of the markets. Note that our short-term views may differ from our
big picture view.
Bonds commenced a secular BEAR market in
June of 2003. (Last
update: 22 August 2005)
The stock market, as represented by the S&P500 Index, commenced
a secular BEAR market during the first quarter of 2000, where "secular
bear market" is defined as a long-term downward trend in valuations
(P/E ratios, etc.) and gold-denominated prices. This secular trend will bottom sometime between 2014 and 2020. (Last update: 22 October 2007)
The Dollar commenced a secular BEAR market during the final quarter of 2000. The
first major downward leg in this bear market ended during the first
quarter of 2005, but a long-term bottom won't occur until 2008-2010. (Last update: 28 March 2005)
Gold commenced a
secular bull market relative to all fiat currencies, the CRB Index,
bonds and most stock market indices during 1999-2001. This secular trend will peak sometime between 2014 and 2020. (Last update: 22 October 2007)
Commodities, as
represented
by the CRB Index, commenced a secular BULL market in 2001. The first
major upward leg in this bull market ended during the first half of 2008, but a long-term
peak won't occur until 2014-2020. (Last update: 03 November 2008)
Copyright
Reminder
The commentaries that appear at TSI
may not be distributed, in full or in part, without our written permission.
In particular, please note that the posting of extracts from TSI commentaries
at other web sites or providing links to TSI commentaries at other web
sites (for example, at discussion boards) without our written permission
is prohibited.
We reserve the right to immediately
terminate the subscription of any TSI subscriber who distributes the TSI
commentaries without our written permission.
Outlook Summary
Market
|
Short-Term
(0-3 month)
|
Intermediate-Term
(3-12 month)
|
Long-Term
(1-5 Year)
|
Gold
|
Neutral
(17-Dec-08)
|
Bullish
(12-May-08)
|
Bullish
|
US$ (Dollar Index)
|
Bearish
(21-Jan-09)
| Bearish
(24-Nov-08)
|
Neutral
(19-Sep-07)
|
Bonds (US T-Bond)
|
Bearish
(21-Nov-08)
|
Bearish
(22-Sep-08)
|
Bearish
|
Stock Market (S&P500)
|
Bullish
(16-Oct-08)
|
Bullish
(08-Oct-08)
|
Bearish
|
Gold Stocks (HUI)
|
Bullish
(12-Jan-09)
|
Bullish
(12-May-08)
|
Bullish
|
| Oil | Bullish
(17-Nov-08)
| Neutral
(22-Sep-08)
| Bullish
|
Industrial Metals (GYX)
| Bullish
(26-Nov-08)
| Neutral
(22-Sep-08)
| Bullish
|
Notes:
1. In those cases where we have been able to identify the commentary in
which the most recent outlook change occurred we've put the date of the
commentary below the current outlook.
2. "Neutral", in the above table, means that we either don't have a
firm opinion or that we think risk and reward are roughly in balance with respect to the timeframe in question.
3. Long-term views are determined almost completely by fundamentals,
intermediate-term views by giving an approximately equal weighting to
fundmental and technical factors, and short-term views almost
completely by technicals.
Yearly Forecast
At this time of the year it
is traditional for newsletter writers and other commentators to make
predictions about how the financial markets will perform over the
coming 12 months. This is a tradition we follow, even though we think
that 12-month predictions have little practical value. Successful
investing/trading involves the continuous real-time assessment of risk
and reward, not accurate forecasting. In fact, anyone whose
investing/trading approach relies on being able to accurately predict
the directions of market prices over the coming year will eventually
come unstuck.
Further to the above, the "Yearly Forecast" that we present today
should not form the basis of anyone's investing/trading strategy
throughout 2009. It is just a set of opinions that will likely change
as new information becomes available.
Random Thoughts
*Our view at the beginning of 2008 was that economic weakness
would result in a deflation scare (widespread fear that deflation is a
threat, as opposed to actual deflation (money supply contraction))
during the first half of the year. What actually happened was that
inflation fears remained elevated during the first half thanks largely
to incredible strength in the oil market, prompting us to change course
and to speculate, during May through August, that a deflation scare
would commence in the second half of the year and probably extend into
2009. As things turned out, the fear of deflation ramped up more
quickly than anticipated. Importantly, however, up until now it has
been a classic 'scare', as opposed to the genuine article (monetary
contraction), in that the fear of deflation has become rampant even
though the rate of monetary INFLATION has increased dramatically.
The deflation scare will extend through 2009, with a respite during the
first half of the year. In particular, the fear of deflation will
likely become more prevalent after the stock market's rebound runs out
of steam.
*The spread between long-term and short-term US interest rates
will remain unusually wide because the Fed will keep overnight interest
rates pegged near zero while long-term (30-year and 10-year) interest
rates establish an upward bias. Also, credit spreads (spreads between
the yields on relatively high-risk and relatively low-risk bonds of the
same duration) will generally remain wide, although they should
contract while the stock market rallies. Wide/widening yield and credit
spreads will ensure that the interest-rate backdrop remains bullish for
gold relative to other commodities and investments.
*Gold will weaken against industrial commodities (including
silver) during the first half of the year in response to an economic
'false dawn', and then recapture its relative strength during the
second half.
*In our 2008 Yearly Forecast we wrote: "In
a desperate effort to revive the economy...the US Federal Government
will become the primary engine of debt/money expansion (inflation)...
As a result, the people who doubt the ability of the powers-that-be to
maintain a high level of monetary expansion in the face of a 'tapped
out' consumer will receive an "Inflation 101" course. They will learn
that there is no limit to the amount of bonds that the US government
can issue to the Fed in exchange for newly-created currency." This comment is also applicable for 2009.
The US Stock Market
We began 2008 expecting the S&P500 to end the year with a small
loss, meaning that our outlook at the beginning of last year was
nowhere near bearish enough.
As far as 2009 is concerned, we think the first few months will be
characterised by hope of recovery and the remainder by disappointment.
In particular, it looks like the stock market has been building a base
capable of supporting a 2-4 month rally from whatever low is made in
January.
There is very little prospect of a new bull market beginning anytime
soon, but this is not because the economic backdrop is dismal and
likely to remain so (the beginnings of new bull markets always coincide
with dismal economic news); it's because valuations are not yet low
enough.
The US Dollar
In our 2008 forecast we wrote:
"...a trade deficit is
not, in and of itself, a problem. It can, however, be a symptom of an
inflation problem. In the US case, the large slide in the savings rate
that has occurred alongside the large increase in the trade deficit
strongly suggests that the trade deficit is, indeed, symptomatic of
such a problem.
An inflation problem
caused the bear market in the Dollar Index, but the bear market might
either be over or about to go into hibernation for an extended period.
This is not because the US no longer has an inflation problem; it's
because the market has taken the US$ too low relative to other
currencies, most notably the euro, that have major problems of their
own. The euro now trades at a 20-30% purchasing-power premium to the
US$, and yet: a) the euro-zone has developed its own inflation problem
thanks to double-digit growth in money supply, b) the unfunded
government liabilities of countries such as Germany and France are
every bit as problematical as those of the US, and c) there is a
significant risk that the European Monetary Union (EMU) will start
coming apart at the seams due to economic distress in countries such as
Italy and Spain.
Which brings us to our 2008 outlook for the Dollar Index:
Our view is that the
Dollar Index commenced a bottoming process last November -- a process
that will probably entail at least one test of the November low and be
complete by March of this year. We expect that an intermediate-term US$
rally, driven initially by the realisation that the ECB will have to
cut interest rates almost as much as the Fed, will then begin."
Last year a number of important trends began a few months later than
expected, and when they did finally begin they moved much more quickly
than expected. Last year's US$ rally is a good example.
As far as 2009 is concerned we think the US$ will have a negative bias
for a few months beginning in late January and a positive bias
thereafter. The negative bias in the US dollar's exchange value will be
due to the temporary waning of deflation fears and the emergence of
recovery hopes, whereas the ensuing positive bias will be due to the
renewed desire to avoid risk after it becomes apparent that a
sustainable recovery will not begin this year.
In addition to rejuvenated fears about deflation and economic weakness,
the US$ could be given a boost later in 2009 by the growing realisation
that Europe's monetary union may not survive.
Note that a rise in the US dollar's foreign exchange value in response
to fears about the stability of the European Monetary Union would
constitute euro weakness rather than genuine US$ strength. This is the
sort of situation in which a rise in the Dollar Index would likely
coincide with a rise in the US$ gold price.
T-Bonds
Bonds are currently in a short-term downward trend and this trend
should continue while the stock market rebounds, but we don't have a
firm opinion on what bonds will do beyond that. On the negative side of
the ledger, there will be a veritable deluge of additional bond supply
during the course of the year and in all likelihood there will be
reduced demand for T-Bonds from China and the Middle East. On the
positive side of the ledger, deflation fear will probably move back to
centre stage during the second half of the year and the Fed has
intimated that it will buy T-Bonds to suppress long-term interest
rates.
Gold and Gold Stocks
In our 2008 forecast we wrote:
"We expect that yield and
credit spreads will continue to widen during 2008; that real interest
rates will remain low; and that financial market volatility will
increase. If so then the backdrop will remain 'gold bullish' and a
US$-inspired 2-4 month downturn in the gold market during the first
half of the year will be followed by another powerful advance. Our
guess is that gold will end 2008 above $1000, but will trade below $750
at some point during the first half of the year.
Gold's upward trend
relative to the base metals should continue during 2008. Also, we
expect that gold will move sharply higher relative to oil."
We also wrote:
"...we perceive
considerably more downside risk in the major gold stocks than in gold
bullion and only slightly more upside potential. As a result, we don't
see a good reason to take long-term investment positions in the majors.
This has, in fact, been our view for at least four years. These stocks
periodically become oversold relative to gold bullion and at such times
they make good trading vehicles, but on a longer-term basis they are
not worth the hassle. There are simply too many things that can go
wrong with them compared to the amount of additional upside potential
they offer. In our opinion, if you are risk-tolerant and looking for
ways to leverage gains in the price of gold bullion then you should own
a portfolio comprising mid-tier and junior gold mining equities, but if
you are risk averse you should focus on gold bullion or gold bullion
surrogates such as GLD.
The gold-stock indices
can be expected to track gold bullion during 2008, falling further
during gold-market corrections and rebounding faster thereafter.
However, if the broad stock market were to become very weak then we
could encounter a period during which the gold sector falls while gold
bullion rises."
Unlike most other long-term gold bulls we were pleased with the way
gold bullion performed last year. In US$ terms it didn't do as well as
we thought it would, but, then again, the deflation scare was far
greater than we were expecting. Moreover, gold did spectacularly well
compared to other commodities.
All things considered, 2008 was another good year for gold bullion.
However, for the gold sector of the stock market it was a very
different story. As it turned out, even risk-tolerant speculators
should have avoided gold stocks, especially the junior gold stocks,
during 2008.
Looking ahead, when gold stocks fell to ridiculously low levels
relative to gold bullion last October-November the stage was set for a
period of substantial out-performance by the stocks. This
out-performance (strength in gold stocks relative to gold bullion)
should continue until the broad stock market completes its
counter-trend rebound, which probably means a few more months.
We think that 2009 will be another 'up' year for gold bullion in US$
terms, but as was the case during 2008 there will probably be a
multi-month period when gold gets pushed downward by rising deflation
fears and the associated US$ strength. The gold price will probably
make a new high this year and finish the decade on a strong note, but
we don't have any particular target in mind. Relative to industrial
commodities we expect gold to give back some of its recent large gains
during the first half of the year as hopes of economic recovery take
root, and to resume its advance later in the year as these hopes are
dashed.
The gold sector of the stock market probably commenced a new multi-year
bull market last October and is poised to make substantial upward
progress during 2009. However, there is little chance of a steady
upward trend that extends throughout the year. This sector experiences
a large downward move during the course of almost every year and in
this regard 2009 probably won't be an exception, although 2009's
downturn won't be anywhere near as severe as the one that occurred
during 2008.
The risk of a large downward move in gold-mining shares will increase after the broad stock market completes its rebound.
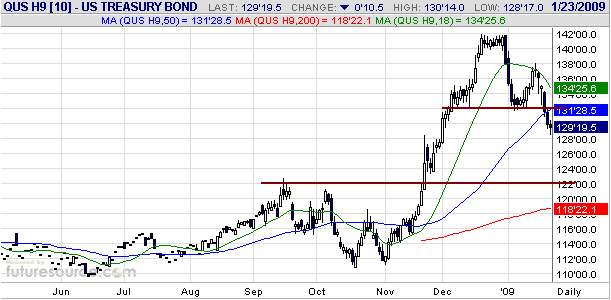
Bond Update
The
March T-Bond futures contract broke below support at 132 last week (see
chart below). As per our comment in the 19th January Weekly Update,
this breakdown creates a short-term technical objective of 122.
The Stock
Market
At the moment, the
unrelenting stream of bad news from banks is preventing the stock
market from making any upward progress. Hundreds of billions of dollars
have already been channeled from the rest of the economy into the
banking industry, but this is apparently nowhere near enough. The
obvious solution is to stop throwing good money after bad, but the
government solution will undoubtedly be to channel hundreds of
billions, or perhaps even trillions, more dollars into the banks. No
wonder the gold market is getting frisky.
Many pundits claim that government money must be used to save the banks
for the good of the entire economy, but it never seems to occur to
these people that the only way the government gets money is to take it
from the private sector -- either directly via taxation and borrowing,
or indirectly via inflation. In other words, there is really no such
thing as "government money". The money taken by the government to save
the banks could otherwise be used to finance businesses that produce
real things and employ people. Therefore, the grand bank-rescue mission
will ultimately hurt the entire economy, although it could give
confidence a short-term boost.
Considering how bad the situation has become in the banking industry
and how terribly the bank stocks have performed, the broad stock market
has held together quite well over the past few weeks. It hasn't been
able to rally, but it also hasn't done anything to invalidate our view
that a base is forming. Furthermore, some positive divergences have
occurred or appear to be developing.
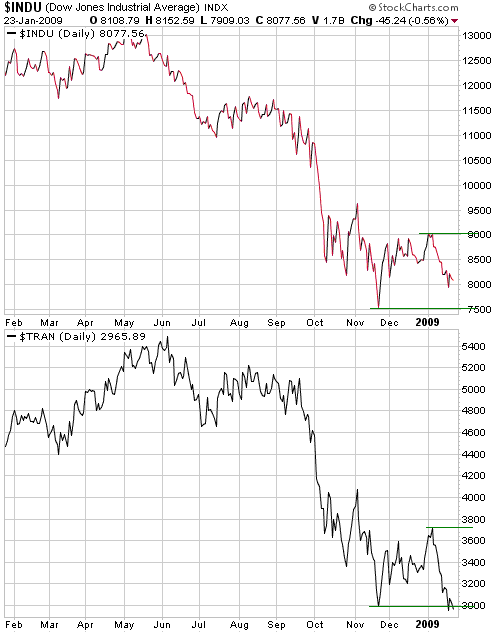
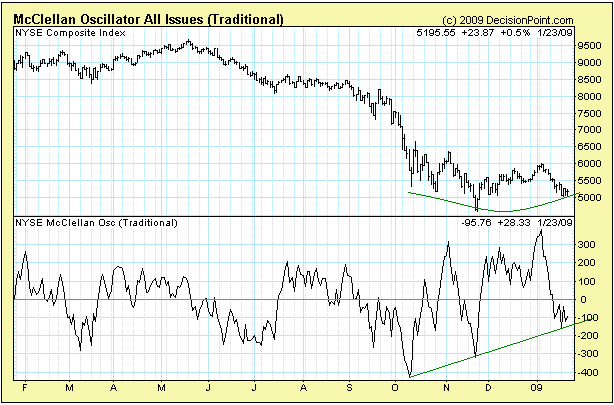
One positive divergence is illustrated by the following chart. The
chart shows that while the NYSE Composite has essentially moved
sideways since early October of last year, the NYSE's McClellan
Oscillator (MO) has been trending upward. This suggests to us that the
average stock is doing better than the index.
Another positive
divergence worth mentioning is last week's "Dow Theory"
non-confirmation; specifically, the failure of the Dow Industrials
Average (Dow) to confirm the new closing low achieved by the Dow
Transportation Average (TRAN). Refer to the following chart comparison
of the Dow and the TRAN for details. The Dow and the TRAN must now
close above their early January peaks to generate a Dow Theory buy
signal.
By the way, if a Dow Theory buy signal does occur we don't think it will have longer-term bullish implications.
This week's
important US economic events
| Date |
Description |
Monday Jan 26
| Leading Economic Indicators
Existing Home Sales
| Tuesday Jan 27
| Consumer Confidence
| | Wednesday Jan 28
| FOMC Policy Statement
| | Thursday Jan 29
| Durable Goods Orders
New Home Sales
| | Friday Jan 30
| Q4 GDP (prelim)
Employment Cost Index
Chicago PMI
|
Gold and
the Dollar
Gold
In last week's Interim Update we wrote: "Most
people think of the gold-currency relationship as if the US$ were at
one end of a seesaw and gold and the euro were at the other end, but it
makes more sense to think of a seesaw with gold at one end and all the
fiat currencies at the other." A good example of why this is so
was provided last week by Philipp Hildebrand, the Vice President of the
Swiss National Bank (SNB). Here are some excerpts from a Bloomberg article noting comments made by Mr. Hildebrand last Wednesday:
""With short-term rates
of practically zero, the SNB can't prevent a further appreciation in
the Swiss franc through a rate cut," Hildebrand said in a speech in St.
Gallen, Switzerland late yesterday. "The SNB is able to sell unlimited Swiss francs versus another currency. In an extreme case, it can commit itself at the same time to buying unlimited currencies at a fixed- exchange rate."
..."A central bank is always able to increase the absolute amount of its own currency in circulation,"
said Hildebrand. "Further options" for policy makers include purchasing
government bonds on the secondary markets, he said, conceding that
using unconventional tools "isn't without risks."
...A sustained period of
falling prices would make fighting the economic crisis harder,
Hildebrand said. Swiss inflation, which slowed to 0.7 last month, may
turn negative as soon this summer, the central bank estimates.
"Deflation is just as
undesirable as inflation," he said. "This doesn't mean that we
concretely are counting on deflation from today's point of view, rather
the point is that the uncertainty is enormously high."
..."The central bank can and will continue to provide liquidity, as much and for as long as needed,"
Hildebrand said. "The SNB will continue to act in a decisive way in
order to counter the effects of the economic contraction."" [Emphasis added]
These comments by the no. 2 man at Switzerland's central bank sound
like they were made by Ben Bernanke, the great US inflation promoter
and believer in the fallacy that an economy can be strengthened by
creating money out of nothing. Not surprisingly, the market's response
was to push the Swiss Franc (SF) downward against both gold and the
US$. As illustrated by the following chart, the SF-denominated gold
price ended last week at a new all-time high.
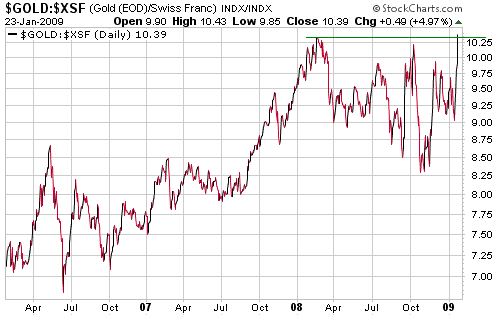
The new high in the
SF-denominated gold price is marginal at this time, but the
euro-denominated gold price has broken decisively into new-high
territory. Will the US$ gold price follow?
Eventually it will, but probably not over the next few weeks.
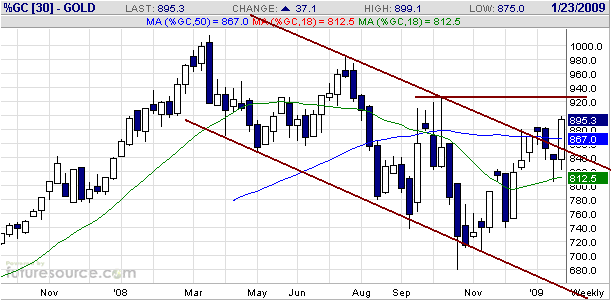
The weekly chart displayed below shows that the US$ gold price has
broken out from its downward-sloping channel and is approaching
important lateral resistance defined by last October's peak. To confirm
that its downward correction is over gold must exceed this lateral
resistance, thus breaking the sequence of declining tops that dates
back to March of 2008.
Note that a decisive break above the October-2008 peak would not
necessarily have short-term bullish implications, but it would be
strong evidence that an intermediate-term advance is in progress and
that the lows of last October-November were not going to be seen
again.
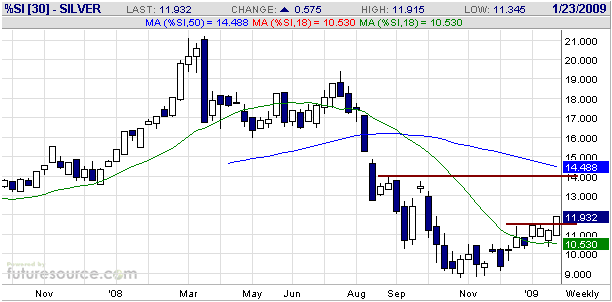
Silver
The following weekly chart shows that silver has broken above
short-term resistance. As previously noted, it stands a good chance of
rebounding to around $14 over the next few months.
We don't expect
silver to exceed its 2008 peak this year. In our opinion, resistance at
$15-$16 defines silver's maximum intermediate-term upside potential.
Gold Stocks
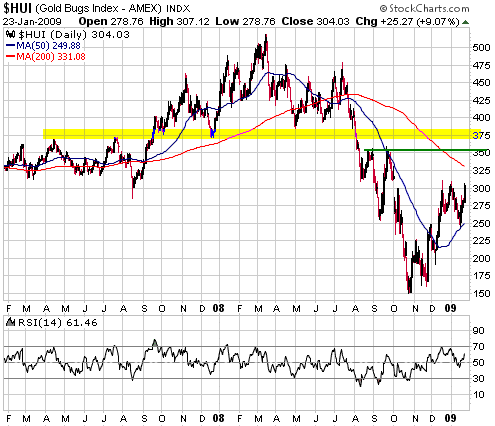
Friday's powerful advance in the gold sector was just what the doctor
ordered. The HUI hasn't yet broken above its mid-December intra-day
high, but it did end the week at a new closing high for the move.
With reference to the following chart, overhead resistance lies at 350
and then at 370-380. Our guess is that the lower of these resistance
levels will be tested within the next two weeks. With regard to our own
accounts, for money-management reasons we plan to do a small amount of
selling if the HUI approaches 350 in the near future.
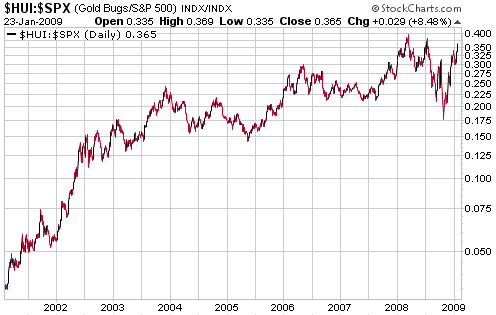
The following chart
shows how the gold sector, as represented by the HUI, has performed
relative to the broad US stock market, as represented by the SPX.
The gold sector's extreme relative weakness during July-October of last
year wasn't exactly a rational response to changing fundamentals given
that this sector's fundamentals improved dramatically during this
period thanks to large gains in the real gold price. Gold's stellar
performance relative to other commodities during the second half of
last year should result in gold producers reporting much-improved
earnings during 2009. In fact, the gold sector is probably the ONLY
stock market sector that will report genuinely good earnings news in
2009.
The irrationality of the gold sector's relative weakness during
July-October of last year is reflected in the speed with which the
HUI/SPX ratio has rebounded. HUI/SPX has doubled over the past three
months and is now within 10% of its March-2008 peak.
Currency Market Update
The Dollar Index spiked up to its short-term channel top on Friday and
then gave up all its gains. It is overbought on a short-term basis and
probably just reversed to the downside, although a daily close below 84
is needed to confirm a trend change.
We are anticipating a pullback to the low-80s.
The Fed will issue
its next policy statement on Wednesday afternoon, but we doubt that it
will say anything that hasn't already been said. There won't be a cut
in the Fed Funds rate target because the target is already at
zero.
Update
on Stock Selections
(Note: To review the complete list of current TSI stock selections, logon at http://www.speculative-investor.com/new/market_logon.asp
and then click on "Stock Selections" in the menu. When at the Stock
Selections page, click on a stock's symbol to bring-up an archive of our comments on the stock in question)
 A rank speculation A rank speculation
We have a Great Basin Gold (TSX and AMEX: GBG) warrant position in the
TSI Stocks List. These warrants, which trade on the TSX under the
symbol GBG.WT, have an exercise price of C$3.50 and an expiry date of
20th April 2009. They will almost certainly expire worthless because
there's very little chance of GBG rising from Friday's closing price of
C$1.35 to above C$3.50 in less than three months. However, if GBG were
to rally to the mid-C$2 area over the next few weeks -- not a high
probability, but certainly not out of the question -- then the warrants
could quite conceivably rise by 500% or more from their current level
of only C$0.025 (2.5c). Gamblers could therefore consider buying some
of these warrants at the current price using money that could be
comfortably written off, the idea being to take a quick
multi-hundred-percent gain on the warrants if GBG happens to move
sharply higher over the next few weeks.
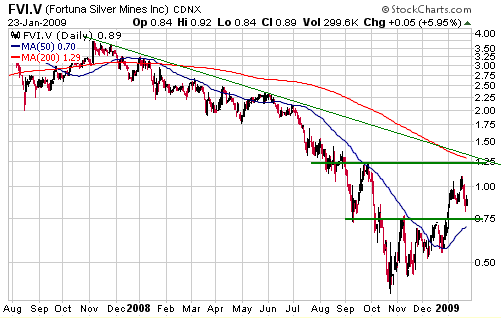
Fortuna Silver (TSXV: FVI). Shares: 92M issued, 110M fully diluted. Recent price: C$0.89
FVI has a lot of cash, a small silver/base-metal mining operation in
Peru (the Caylloma project), and a sizeable exploration-stage
gold/silver project in Mexico (the San Jose project). The Caylloma and
San Jose projects provide huge upside potential, especially San Jose
due to its gold component. At the same time, risk is mitigated by the
company's $40M cash hoard.
The next important news release for FVI is likely to be the updated
resource estimate for the San Jose project, which is expected during
the second quarter of this year.
The chart presented below shows that the stock has support at C$0.75
and resistance at C$1.25. The ideal place for new buying would be the
mid-to-high C$0.70s, but there is no assurance that the stock will pull
back that far. Moreover, it offers excellent value at Friday's closing
price of C$0.89. It therefore probably makes sense for speculators who
don't yet own any FVI shares to take an initial position near the
current price, whereas those who already have significant exposure
could afford to be stingier with their bids.
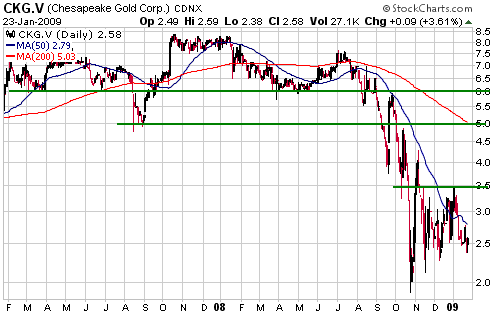
Chesapeake Gold (TSXV: CKG). Shares: 38M issued, 43.5M fully diluted. Recent price: C$2.58
This is a good time for patient speculators to be taking initial
positions, or adding to existing positions, in CKG. This
exploration-stage gold stock hasn't done much since bottoming last
October, but this creates an opportunity because it owns one of the
largest undeveloped gold deposits in Mexico (the Metates project) and
has sufficient cash in the bank to fund its operations over the coming
year.
The next significant news is expected to be a NI 43-101 compliant
resource estimate for the Metates project during the first quarter of
this year. Currently, Metates has a historical (non-NI 43-101
compliant) resource of 15.7M gold-equivalent (gold + silver) ounces.
With reference to the following chart, CKG has resistance at C$3.50,
C$5.00 and C$6.00. We won't be surprised if CKG rebounds to the C$5-C$6
range during the first half of this year.
Chart Sources
Charts appearing in today's commentary
are courtesy of:
http://stockcharts.com/index.html
http://www.futuresource.com/
http://www.decisionpoint.com/

|