|
-- Weekly Market Update for the Week Commencing 26th January 2015
Big Picture
View
Here is a summary of our big picture
view of the markets. Note that our short-term views may differ from our
big picture view.
In nominal dollar terms, the BULL market in US Treasury Bonds
that began in the early 1980s ended in 2012. In real (gold)
terms, bonds commenced a secular BEAR market in 2001 that will continue
until 2018-2020. (Last
update: 20 January 2014)
The stock market, as represented by the S&P500 Index,
commenced
a secular BEAR market during the first quarter of 2000, where "secular
bear market" is defined as a long-term downward trend in valuations
(P/E ratios, etc.) and gold-denominated prices. This secular trend will bottom sometime between 2014 and 2020.
(Last update: 22 October 2007)
A secular BEAR market in the Dollar
began during the final quarter of 2000 and ended in July of 2008. This
secular bear market will be followed by a multi-year period of range
trading.
(Last
update: 09 February 2009)
Gold commenced a
secular bull market relative to all fiat currencies, the CRB Index,
bonds and most stock market indices during 1999-2001.
This secular trend will peak sometime between 2014 and 2020.
(Last update: 22 October 2007)
Commodities,
as represented by the Continuous Commodity Index (CCI), commenced a
secular BULL market in 2001 in nominal dollar terms. The first major
upward leg in this bull market ended during the first half of 2008, but
a long-term peak won't occur until 2014-2020. In real (gold) terms,
commodities commenced a secular BEAR market in 2001 that will continue
until 2014-2020.
(Last
update: 09 February 2009)
Copyright
Reminder
The commentaries that appear at TSI
may not be distributed, in full or in part, without our written permission.
In particular, please note that the posting of extracts from TSI commentaries
at other web sites or providing links to TSI commentaries at other web
sites (for example, at discussion boards) without our written permission
is prohibited.
We reserve the right to immediately
terminate the subscription of any TSI subscriber who distributes the TSI
commentaries without our written permission.
Outlook Summary
Market
|
Short-Term
(1-3 month)
|
Intermediate-Term
(6-18 month)
|
Long-Term
(2-5 Year)
|
|
Gold
|
N/A |
Bullish
(26-Mar-12) |
Bullish
|
|
US$ (Dollar Index)
|
N/A |
Bearish
(26-Jan-15) |
Neutral
(19-Sep-07) |
|
US Treasury Bonds (TLT)
|
N/A |
Neutral
(18-Jan-12)
|
Bearish |
|
Stock Market
(DJW)
|
N/A |
Bearish
(28-Nov-11) |
Bearish
|
|
Gold Stocks
(HUI)
|
N/A |
Bullish
(23-Jun-10) |
Bullish
|
|
Oil |
N/A |
Bullish
(17-Dec-14) |
Bullish
|
|
Industrial Metals
(GYX)
|
N/A |
Neutral
(15-Sep-14) |
Bullish
(28-Apr-14) |
Notes:
1. Our short-term expectations are discussed in the commentaries, but except in
special circumstances we won't attempt to assign a "bullish", "bearish" or
"neutral" label to these expectations.
2. The date shown below the current outlook is when the most recent outlook change occurred.
3. "Neutral" means that we think risk and reward are roughly in balance with respect to the timeframe in question.
4. Long-term views are determined almost completely by fundamentals and intermediate-term views
are determined by a combination of fundamentals, sentiment and technicals.
2015
forecast for the Treasury market
Our 2015 forecast for the US Treasury market was essentially
summarised in the list of "2015 surprises" included in the 7th
January Interim Update. Surprises 1) and 2) covered US interest
rates and the US government bond market. Here they are again, with
minor changes to the wording:
1) We expect that the Fed will continue to make noises about 'normalising'
monetary policy, but will end up doing almost nothing. At most,
there will be a single 0.25% rate hike. One reason is the fear that
economic weakness elsewhere in the world, primarily the euro-zone,
will weigh on the US economy. Another reason is the absence of an
obvious "price inflation" problem. A third reason is the Fed's
unwavering commitment to the absurd Keynesian idea that an economy
can be strengthened by punishing savers.
2) We expect US Treasury yields to defy the majority view by ending
the year flat-to-lower. More specifically, we expect the 30-year
T-Bond yield to be roughly unchanged over the course of the year,
but that yields will decline in the middle and at the short end of
the curve. Of all the Treasury securities, the 5-year T-Note should
experience the largest decline in yield as traders belatedly realise
that the Fed will not be taking any significant steps towards
'policy normalisation' during 2015 or 2016.
In addition to the absence of an obvious "price inflation" problem,
there are two current reasons and one potential reason to expect
flat-to-lower Treasury yields (flat-to-higher Treasury prices) over
the course of this year. The current reasons are sentiment (surveys
and the COT data indicate that bullish sentiment is not yet close to
an extreme) and the good value offered by US Treasury securities
relative to the value on offer in Europe and Japan. The potential
reason is stock market weakness, in that a lengthy downward trend in
the stock market would likely boost the demand for Treasury debt.
This is a "potential" reason because a lengthy downward trend in the
stock market is not a sure thing.
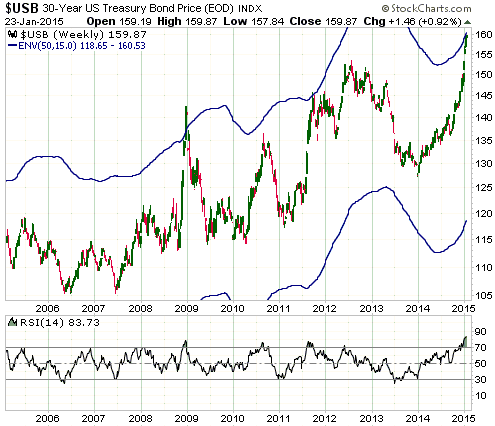
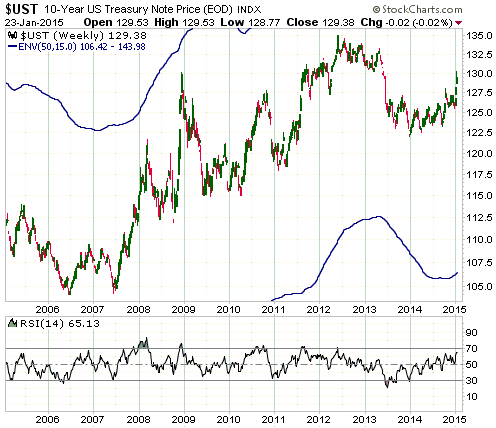
The reason to expect Treasury securities with 5-10 year durations to
do better than 30-year T-Bonds is the extent to which the T-Bond
out-performed over the past 12 months and is now stretched to the
upside. The following two weekly charts illustrate what we mean.
The first chart shows that the 30-year T-Bond has reached the top of
the moving-average (MA) envelope that limited the powerful rallies
of 2008 and 2011, and that the T-Bond's weekly RSI is now at its
highest level in more than 10 years. The second chart shows that the
10-year T-Note is only slightly 'overbought'.
The Stock
Market
The US
The US stock market is beginning to lag other markets around the world. It
hasn't yet signaled that the late-December had significance beyond the
short-term, but it is close to doing so. This week's price action could
therefore be telling.
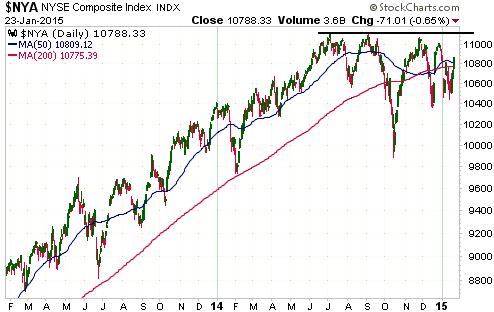
The NYSE Composite Index (NYA) has made multiple attempts to break above its
July-2014 peak, but has been unable to do so. A daily close below the
December-January pullback lows (around 10400) would be the first sign that
something more serious than a 1-2 month correction was underway.
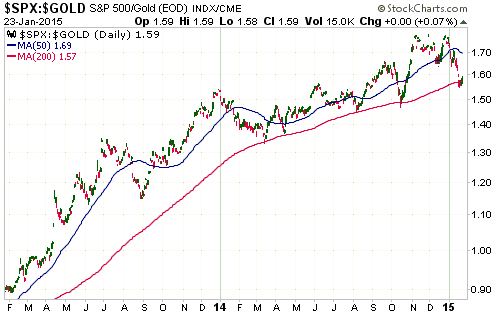
The SPX/gold ratio remains precariously poised at its 200-day MA. A solid break
below this MA would be evidence that a top of at least intermediate-term
importance was put in place in December.
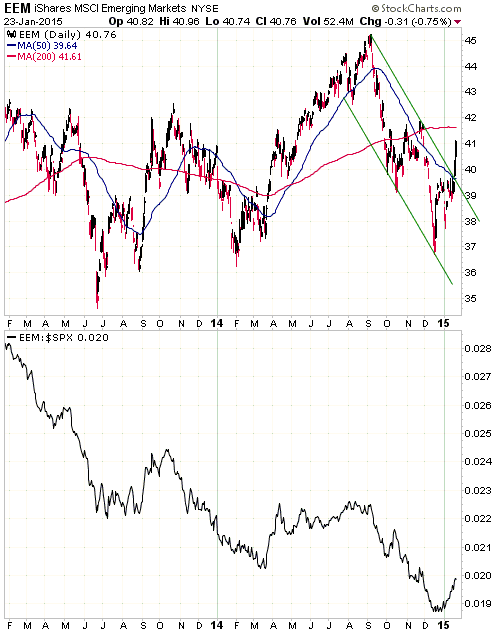
The "Emerging Markets"
US$ strength creates a problem for the so-called "emerging economies" because
there is a lot of US$-denominated debt within these economies. Surprisingly,
therefore, last week's upward acceleration in the Dollar Index was accompanied
by an upside breakout in the iShares Emerging Markets ETF (EEM). Refer to the
top section of the following chart for details. Of potentially greater
importance, however, is EEM's recent up-turn relative to the SPX illustrated by
the bottom section of the following chart.
It's too early to tell if EEM/SPX's recent up-turn is just another bear-market
rebound or is indicative of a long-term trend change.
Europe
The ECB's new inflation program will damage the real economy, but it 'did the
trick' as far as the asset markets were concerned. For example, the following
charts show that both the EURO STOXX50 Index (STOX5E) and France's CAC40 Index
decisively broke their sequences of declining tops and rocketed to new
multi-year highs last week. Germany's DAX Index had made a new multi-year high
(a new all-time high, actually) during the week before last and built on its
upside breakout last week.
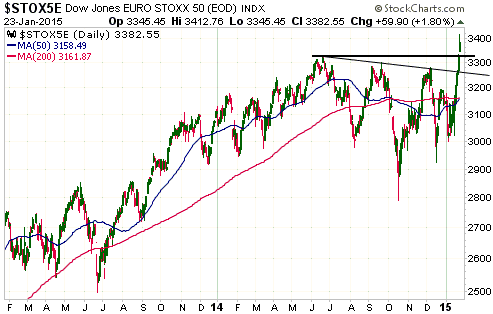
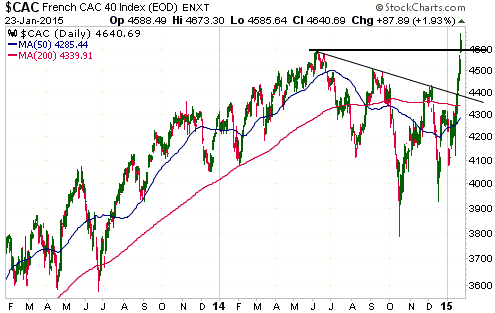
Europe's senior stock indices are not yet 'overbought' on an intermediate-term
basis, but they are 'overbought' on a short-term basis and are likely to soon
begin corrections. If last week's breakout was genuine then the STOX5E should
not close below 3250 during any corrective activity over the next few weeks.
This week's
significant US economic events
(The most important events are shown
in bold)
| Date |
Description |
| Monday Jan 26 |
Dallas Fed Mfg Survey | | Tuesday
Jan 27 |
Durable Goods Orders
New Home Sales
Case-Shiller Home Price Index
Consumer Confidence
Richmond Fed Mfg Index | | Wednesday
Jan 28 |
FOMC Meeting Announcement | | Thursday
Jan 29 |
Pending Home Sales Index
|
| Friday Jan 30 |
Q4 GDP (prelim)
Employment Cost Index
Consumer Sentiment
Chicago PMI |
Gold and
the Dollar
Gold
Goldman's 2015 forecast for gold
Early last year we gave banking behemoth Goldman Sachs (GS) credit for looking
in the right direction for clues regarding gold's likely performance, which is
something that most gold bulls were not doing. In November
we again gave them credit, because even though we doubted that the US$ gold
price would get close to GS's $1050/oz target their overall analysis had been
more right than wrong. It was clear that up to that point the US economy had
performed better than we had expected and roughly in line with the GS forecast,
which was the main reason that gold had remained under pressure; albeit, not as
much pressure as GS had anticipated. But that was last year. This year it's a
different story.
This year, GS's gold market analysis begins on the right track by stating that
stronger US growth should support higher real US interest rates, which would be
bearish for gold. Although we expect that the US economy will 'tread water' at
best and that real US interest rates will be flat-to-lower over the course of
this year, GS's logic is correct. What we mean is that IF the US economy
strengthens and IF real US interest rates trend upward in response, there will
be irresistible downward pressure on the US$ gold price.
However, the analysis then goes off the rails. After mentioning something that
matters (the real interest rate), the authors of the GS gold-market analysis
then try to support their bearish case by listing factors that are either
irrelevant or wrong. It actually seems as if they've taken the worst arguments
routinely put forward by gold bulls and tried to use the same hopelessly flawed
logic to support a bearish forecast.
For example, they argue that the demand for gold will fall because "inflation"
levels are declining along with oil prices. They are therefore unaware, it
seems, that "price inflation" has never been an important driver of the gold
market and that the latest two multi-year gold rallies began with both
"inflation" and inflation expectations low and in declining trends. They also
appear to be unaware that the large decline in the oil price is very bullish for
the gold-mining industry.
Their analysis then gets even worse, as they imply that the price weakness of
the preceding three years is a reason to expect future weakness, whereas the
opposite is closer to the truth. They go on to cite outflows from
exchange-traded funds (ETFs) and reduced investment in gold coins as bearish
influences, apparently unaware that the volume of gold coins traded in a year is
always too small to have a noticeable effect on the price and that the change in
ETF inventory is a follower, not a driver, of the gold price.
Finally, just when it seems as if their analysis can't possibly go further off
track, it does by asserting that lower jewellery demand and a greater amount of
producer hedging will add to the downward pressure on the gold price. The facts
are that jewellery demand has always been irrelevant to gold's price trend and
that gold producers are part of the 'dumb money' (meaning: they tend to add
hedges at low prices and remove hedges at high prices, that is, they tend to do
the opposite of what they should be doing based on gold's intermediate-term
risk/reward).
In conclusion, last year the GS analysts were close to being right for roughly
the right reasons. This year, however, they cannot possibly be right for the
right reasons. They will either be right for the wrong reasons, or they will be
wrong.
Our 2015 forecast for gold
Here's the conclusion of our 2014 gold forecast:
"Based on the small historical sample size, which is all we have to go on,
you should ignore the predictions that gold will zoom straight back to its 2011
top. This is particularly so considering that gold's true fundamentals are mixed
at this time (no longer bearish, but not yet bullish). Gold is likely to provide
a good return in 2014, but even if a major bottom is in place the gold price is
unlikely to trade significantly above $1600 and could have trouble getting
beyond the $1400s."
We were wrong about gold providing a good return in 2014, at least relative to
the US$. In US$ terms gold was flat in 2014, although it did provide a good
return in terms of every other currency.
In 2014 gold performed roughly as expected in US$ terms during the first half of
the year, but then fell to a new bear-market low during the second half. The
problems for the US$ gold price during the second half of 2014 were the
perceived strength of the US economy (linked to the continuing upward trend in
the S&P500 Index), the flattening of the US yield-curve (related to the
perceived US economic strength), and the Dollar Index's upside breakout from a
long-term basing pattern.
The gold market has come to ignore the strength in the Dollar Index, because the
US dollar's rise on the foreign exchange market has come to be seen as more of a
reflection of declining confidence in the ECB and weakening global growth than a
reflection of improving US$ fundamentals. However, there is no evidence, yet,
that the S&P500 has peaked. Also, the US yield-curve hasn't yet signaled a trend
reversal from flattening to steepening, and despite the problems in the 'oil
patch' the general belief is that the US economy will make real progress this
year.
There is never a good time to make a 12-month forecast, since forecasting is for
the birds. But right now is a particularly bad time to make a gold forecast, the
reason being that changes in other markets are needed to turn the gold market
higher on a sustained basis and the needed changes may or may not be about to
happen. Of primary importance, a sustained turn to the upside in gold almost
certainly requires a sustained turn to the downside in US equities. Some
long-term indicators are warning that such a change is in the works, but the
S&P500's price action hasn't yet signaled anything of the sort. The first sign
would be a daily S&P500 close below 1970.
If the S&P500 is in the process of rolling over the downside on a long-term
basis then it's highly probable that gold bottomed last November and will
generate the sort of performance in 2015 that we originally expected to happen
in 2014. That is, gold will probably work its way higher over the course of this
year with a top most likely occurring in the $1400s and with an outside chance
of making it as high as $1600. The most plausible alternative is that the S&P500
will make some additional headway over the next few months and gold will drop to
test its 2014 bottom during the second quarter of this year prior to a long-term
reversal.
Current Market Situation
When the Dollar Index was bottoming at around 79 in May of last year, gold was
priced at around US$1300/oz. When the Dollar Index was peaking at 95.8 last
Friday, gold was priced at around US$1300/oz. Who woulda thunk it?
Gold's ability over the past 2.5 months to gain ground in US$ terms while the
US$ strengthened against all other currencies led to a very sharp rise in the
non-US$ gold price. As illustrated by a chart included in the preceding Weekly
Update, a result is that the euro-denominated gold price recently reached the
top of a moving-average (MA) envelope that has always limited intermediate-term
rallies in the past. As illustrated by the chart displayed below, another result
is that the gold/UDN ratio, an indicator of gold's performance in non-US$ terms,
is also now at the top of a MA envelope that has always limited
intermediate-term rallies in the past.
The implication is that while the gold/UDN ratio could make some additional
headway over the next couple of weeks, three months from now it will probably be
trading at a lower level.
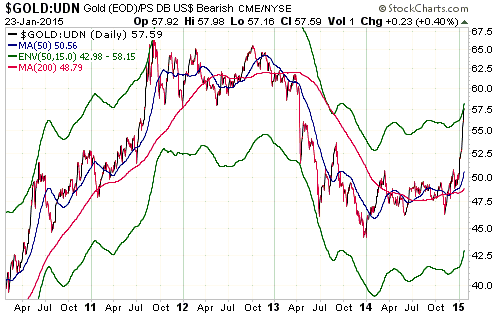
In non-US$ terms, the gold market is extended to the upside on an
intermediate-term basis. In US$ terms, it is extended to the upside on a
short-term basis. This is confirmed by the fact that last Tuesday (the date of
the latest COT data) the speculative net-long position (and the offsetting
commercial net-short position) in COMEX gold futures was at its highest level
since January of 2013.
The COT report is a sentiment indicator, with relatively-high levels in the
speculative net-long position indicating relatively-high levels of bullish
sentiment. Since short-term price highs invariably coincide with short-term
extremes in bullish sentiment, an extreme in the speculative net-long position
(and the offsetting commercial net-short position) will almost always occur near
a short-term price high. The problem is that there is no fixed level that
constitutes an extreme in the COT data.
Based on what happened in the gold futures market over the past two years it is
reasonable to consider a speculative net-long position in the 160K-180K range to
be an extreme, but if a new bull market has begun then the COT level that
constitutes an extreme will shift upward over time. For example, in 2010-2011
the extremes were in the 250K-300K range and a level of 170K would have
indicated a constructive absence of short-term enthusiasm.
Although a new bull market could be underway, the current level of the
speculative net-long position should be viewed as a "caution" sign or a "hold
off on new buying for now" sign.
Note that a routine pullback would take the gold price down to around $1250/oz.
A decline to $1250 is likely within the next several weeks even if a new bull
market has begun and even if the price first rises to around $1350.
Clarification of last week's Interim Update
In last week's Interim Update we discussed the potential for the gold market to
be positively affected by a change in the Yuan's peg to the US$. Just to be
clear, we expect that when a substantial change to the Yuan-US$ peg happens the
purpose will be to devalue the Yuan, that is, to substantially increase the
number of Yuan per US$.
By the way, if/when a Yuan devaluation happens it will likely do so over the
space of many months rather than in one fell swoop.
Gold Stocks
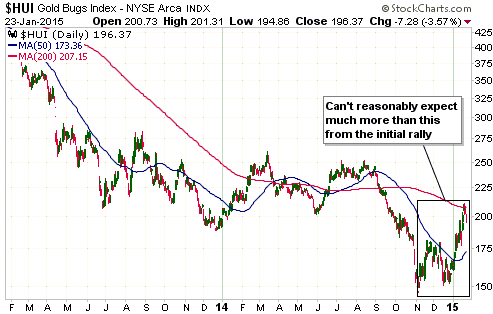
In last week's Interim Update, we wrote:
"After a market has suffered a large decline, a rebound to the vicinity of
the 200-day MA is the most that can reasonably be expected from the INITIAL
rally. It could go a bit higher, but a market that has just suffered a sharp
fall after having spent years in a bearish trend is unlikely to rally back to
the 200-day MA and then just keep going. That's regardless of whether the rally
is part of a new bull market or a bear-market rebound. If the rally is part of a
new bull market then the rise to the 200-day MA (or a little higher) will
typically be followed by a pullback or a sideways consolidation lasting at least
4 weeks. The start of a new bull market would then be signaled by a solid break
above the high of the initial rally."
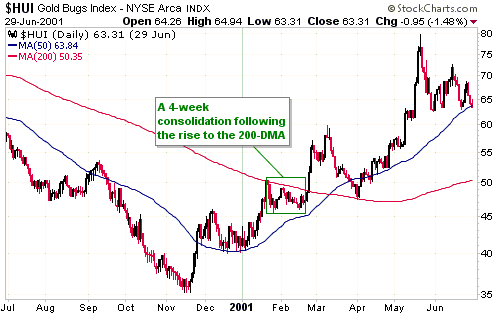
Here are two charts that illustrate what we were talking about. The first chart
shows the path taken by the HUI after its major low in November-2000. Notice
that a 4-week consolidation got underway as soon as the 200-day MA was reached.
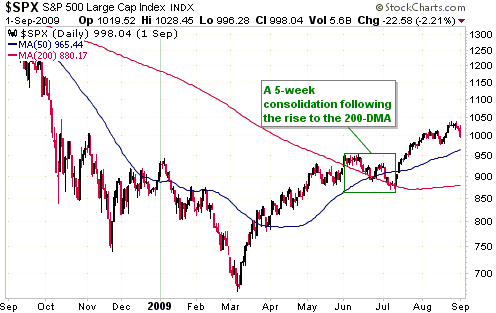
The second chart shows the path taken by the S&P500 after its major low in
March-2009. In this case, a 5-week consolidation got underway following a
single-day rise above the 200-day MA.
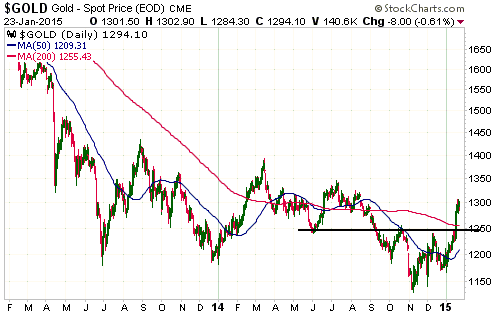
The HUI's current situation is shown below. If a multi-week correction has
begun, which is probably the case, then it will ideally be a choppy, sideways
affair with the price oscillating between the low-180s and the low-200s.
The Currency Market
The ECB's new inflation program
Here is a summary of the new monetary inflation program introduced by the ECB
last Thursday as part of its efforts to create more "price inflation":
1) The headlines touted a monthly asset monetisation figure of 60B euros, but
this includes about 10B euros under existing programs. The additional amount of
monthly asset monetisation resulting from the new program is therefore intended
to be 50B euros. This is in line with the figure that had previously been leaked
to the press.
2) The bulk of the additional asset purchases will be government bonds, with
most of the buying directed towards the bonds of the largest economies (Germany,
France and Italy).
3) The ECB will coordinate the asset-purchase program, but most of the buying
will be done by the national central banks.
4) The program will begin in March-2015 and the initial plan is for it to
continue until September-2016. That is, the initial plan is for 50B euros of
additional money creation per month for 18-19 months, or a total additional
boost to the money supply (or at least the monetary base) of a bit less than 1T
euros.
5) Importantly, the program is OPEN-ENDED, in that although September-2016 is
currently the expected end date the ECB left the door wide open to extend the
program if deemed necessary.
6) The likely effect of the ECB's new program on the euro-zone money supply is
not clear to us at this time. For every dollar of assets purchased by the Fed,
one dollar gets added to bank reserves (part of the monetary base, but not part
of the money supply) and one dollar gets added to the money supply. That is, the
Fed's QE directly boosts the US money supply. However, the process is different
in Japan and could be different in the euro-zone.
Did Thursday's ECB news result in blow-off moves to price extremes in the euro
and the Dollar Index that will hold for many months? At this time there's no way
of knowing, but that's certainly possible.
The Dollar Index
Over the past 6 months the euro has been subject to a sentiment-driven,
trend-following speculative selling spree of historic proportions. We say that
the selling has been sentiment-driven because euro fundamentals are not
materially different today than they were in the middle of last year, either in
absolute terms or relative to US$ fundamentals.
It was well known many months ago that the ECB was going to take action to boost
its balance sheet by around 1 trillion euros, with skepticism that it would
actually be able to implement such a monetary expansion causing relative
weakness in European equities and helping to weaken the euro. Early this month
the markets began to believe that the ECB would find a way to make the expansion
happen, which caused European equities to reverse upward relative to US
equities. This upward reversal in relative equity performance suggests that the
currency-market action of the past three weeks will prove to be an overshoot.
Due to the multiple waves of speculative euro selling, the sympathetic declines
in other European currencies and the weakness in commodity currencies stemming
largely from the crash in the oil price, the Dollar Index is now as 'overbought'
as it has ever been with the exception of November-2008 (the crescendo of the
Global Financial Crisis).
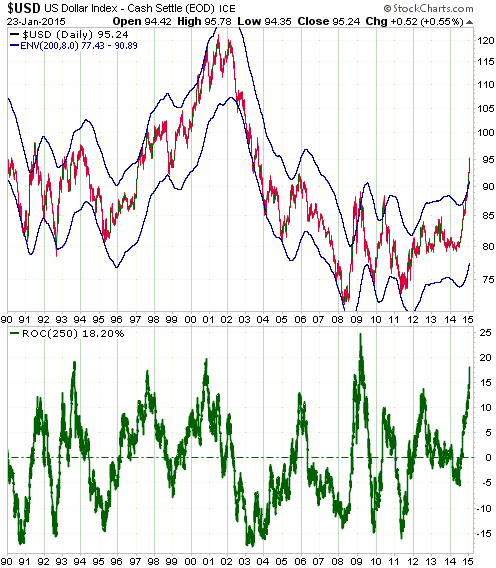
Two weeks ago we presented a version of the following long-term chart to
illustrate the extent to which the Dollar Index was 'overbought' at that time.
The top section of the chart shows the Dollar Index and a 200-day/8% moving
average envelope (the blue lines). The bottom section of the chart shows the
Dollar Index's 250-day rate of change (ROC). With the aid of this chart we
pointed out that a) except for briefly during the 2008 financial crisis, at no
time since 1990 had the Dollar Index been higher relative to the aforementioned
MA envelope, and b) the Dollar Index's 250-day ROC, while unusually high, was
still slightly below the extremes of 1993, 1997 and 2000 and well below the
extreme of 2008.
The updated version of the chart shows that relative to its MA envelope, the
Dollar Index is still not quite as high as it was in November-2008. However,
aside from the 2008 financial-crisis-induced blow-off, the Dollar Index is now
much higher relative to this MA envelope than it has ever been. The chart also
shows that the 250-day ROC is now roughly where it was at the 1993, 1997 and
2000 peaks.
Uncertainty regarding the 25th January election in Greece probably helped
maintain downward pressure on the euro and upward pressure on the Dollar Index
through to the end of last week and could result in some additional pressure
this week as attempts are made to form a new government in that country (the
party that gets the most votes probably won't have an outright majority and will
therefore have to do deals with other parties to form a government). However,
regardless of the outcome of this election there is almost no chance of Greece
leaving the euro-zone this year. The anti-"austerity" Syriza Party, which has
been leading in the polls, has promised to be tougher in negotiations with the
EU; it hasn't promised to take Greece out of the monetary union. Apparently,
most Greek citizens want to retain the euro.
Due to the historic (or near-historic) extremes in the currency market, our
intermediate-term outlook for the Dollar Index has shifted to "bearish".
The Yen
Like every other currency the Yen has lost a lot of value relative to the US$
over the past 6 months. However, when the Dollar Index was rocketing upward
during the final two days of last week, the US$ wasn't the strongest currency in
the world; the Yen was.
Over the course of the past week the Yen was flat relative to the US$ and
appears to be building a base. However, it also appeared to be building a base
during the first half of last year, only to subsequently reveal that it was just
consolidating prior to resuming its bear market.
The stock market continues to hold the key to an upward Yen reversal of
substance. For a multi-month Yen rally there will probably have to be persistent
weakness in the S&P500 Index.
Updates
on Stock Selections
Notes: 1) To review the complete list of current TSI stock selections, logon at
http://www.speculative-investor.com/new/market_logon.asp
and then click on "Stock Selections" in the menu. When at the Stock
Selections page, click on a stock's symbol to bring-up an archive of
our comments on the stock in question. 2) The Small Stock Watch List is
located at http://www.speculative-investor.com/new/smallstockwatch.html
 Company
news/developments for the week ended Friday 23rd January 2015: Company
news/developments for the week ended Friday 23rd January 2015:
[Note: AISC = All-In Sustaining Cost, FS = Feasibility Study, IRR = Internal
Rate of Return, MD&A = Management Discussion and Analysis, M&I = Measured and
Indicated, NAV = Net Asset Value, NPV(X%) = Net Present Value using a discount
rate of X%, P&P = Proven and Probable, PEA = Preliminary Economic Assessment,
PFS = Pre-Feasibility Study]
*Asanko Gold (AKG), a company that has $230M of cash plus $90M of
undrawn credit and is fully financed through to production in Q1-2016, has made
the decision to issue at least 20M new shares at the low price of C$2.02 (about
US$1.65) per share. This is strange, to put it mildly. Considering the massive
(relative to company size) financial resources already held by AKG, this equity
financing does nothing other than needlessly dilute shareholders, make the
company less attractive as a takeover target, and minimise the stock's response
to the more bullish short-term environment for gold.
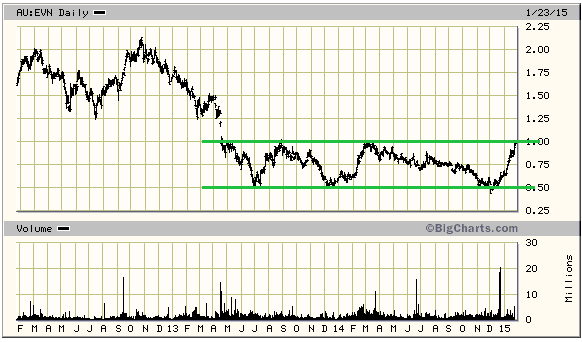
*Evolution Mining (EVN.AX) announced its results for the December
quarter. Quarterly production of 113K ounces was the highest in the company's
history and the AISC of US$848/oz was the lowest in the company's history,
leading to record quarterly cash flow from operations of around A$40M. Guidance
for the Financial Year ended 30th June 2015 has been maintained at 400K-440K
ounces, with costs expected to be at the low end of the guidance range. These
are obviously good results. EVN appears to be doing a satisfactory job of
managing its costs and is benefiting from the strength in the A$-denominated
gold price.
We won't know the extent to which these good production results have boosted the
company's balance sheet until we see the Half Year report next month.
EVN ended last week near its highest price in almost 2 years (see chart below).
It also ended the week at long-term resistance. EVN's close proximity to
long-term resistance and the potential for a multi-week correction in the gold
market prompted us to remove the short-term EVN position from the TSI Stocks
List last week. However, we continue to like EVN's intermediate-term prospects
and expect the stock to trade up to at least A$1.50 later this year.
*Pilot Gold (PLG.TO) reported the results of preliminary
metallurgical testing from its Kinsley Mountain gold project, Nevada. The
purpose of this testing was to determine the amenability of mineralization from
the Secret Canyon target to produce a high-grade concentrate.
Overall recovery, which includes the gold recovered into flotation concentrate
plus gold leached from the final tails, was between 89% and 95% in each of the
tested samples. This is good. It means that at this early stage, metallurgy does
not appear to be an obstacle.
Secret Canyon has excellent grades and widths and, it seems, decent metallurgy,
but as it stands the deposit is not big enough to be developed into a mine.
That's why the key to turning Kinsley Mountain into a very valuable project is
the discovery of other high-grade zones. There is a realistic possibility of
this happening, but if it doesn't it won't be a major problem for PLG because
the company has other 'irons in the fire'.
*Ramelius Resources (ASX: RMS) has generated a steady stream of
good company-specific news over the past few weeks. Since this occurred in
parallel with an improvement in gold-market sentiment, it propelled the stock
price sharply higher. About 200% higher, as a matter of fact.
The latest piece of good news was a resource upgrade at the Kathleen Valley gold
project, which was acquired in the middle of last year. The project resource is
small (163K-oz total gold resource, including 56K ounces of reserves), but for a
potential open-pit operation it is high grade (2.8-g/t for the total resource,
4.1-g/t for the reserve). Furthermore, according to RMS's management the ore
mined from an open pit at Kathleen Valley could be trucked to the company's Mt
Magnet facility for processing. This means that the initial capex associated
with a new mine at Kathleen Valley would be minimal.
It's possible that the mining of Kathleen Valley will commence by mid-2015 and
contribute to the company's production during the second half of this year.
RMS remains very under-valued assuming that the recent operational improvements
at Mt Magnet will be sustained, but it is currently not a good candidate for new
buying because its price has run too far too fast.
*True Gold Mining (TGM.V) is turning into a mess, although not an
irretrievable one.
Last week the company announced that Mark O'Dea, the company's executive
chairman, had also temporarily taken on the role of company president due to the
(probably forced) departure of Dwayne Melrose. The timing of this management
change suggests that Mr. Melrose is being blamed for the community-relations
issues that led to the suspension of work at TGM's Karma gold project in Burkina
Faso.
Regarding the community-relations issues, the press release announcing the
management change stated: "We have been closely monitoring the changing
landscape in Burkina Faso and near our project area over the past six weeks and
have developed a much clearer understanding of certain of the communities'
perceptions and concerns related to the Karma project. We are now taking steps
to re-focus our efforts in Burkina Faso, re-engage with the local community,
address these concerns, and put Karma in a position to move forward. We're
making progress, but the state of affairs in Burkina Faso remains fluid as we
reconcile a number of competing interests within some of the nearby villages."
TGM's press release also stated that there had been $4M-$8M of damage to company
property, which should be covered by insurance.
It's still the case that no details have been provided by the company regarding
the nature of the dispute/conflict that forced the temporary cessation of
construction work, but some details have surfaced nonetheless. In particular, it
seems that the problems currently facing TGM have nothing to do with the
political upheaval that occurred in Burkina Faso in the final quarter of last
year and are also not indicative of a country-wide difficulty in
constructing/operating a mine in Burkina Faso. This is why no significant
disruptions have recently been reported by other foreign miners operating in the
country. Instead, we understand that the obstacles recently encountered by TGM
are associated with the specific location of TGM's mine-site.
The problem, in a nutshell, is that TGM's proposed mine is located in an area
that is a Muslim place of pilgrimage and that contains an important mosque (more
than half of Burkina Faso's population practices Islam). The local Muslims are
naturally not enthusiastic about having an open-pit mining operation near their
places of worship.
We do not think that it makes sense to sell TGM at the current low price, but
new buying will not be appropriate until the concerns of the local community are
'put to bed'.
List of candidates for new buying
From within the ranks of TSI stock selections the best candidates
for new buying at this time, listed in alphabetical order, are:
1) AAU below US$1.10 (last Friday's closing price: US$1.15).
2) AKG (last Friday's closing price: US$1.62).
3) EDV.TO (last Friday's closing price: C$0.58).
4) TGD (last Friday's closing price: US$1.07).
Note that the above list is limited to five stocks. It will
sometimes contain less than five, but it will never contain more
than five regardless of how many stocks are attractively priced for
new buying.
Chart Sources
Charts appearing in today's commentary
are courtesy of:
http://stockcharts.com/index.html
http://www.bloomberg.com/
http://www.barchart.com/
http://bigcharts.marketwatch.com/
http://www.economagic.com/
http://research.stlouisfed.org/

|
