![]()
![]()
![]()
![]()
-- Weekly Market Update for the Week Commencing 26th February 2018
Big Picture
View
Here is a summary of our big picture
view of the markets. Note that our short-term views may differ from our
big picture view.
The BULL market in US Treasury Bonds that began in the early 1980s ended in mid-2016, but there will be many years of topping action in bond prices and bottoming action in bond yields before major new trends get underway. A major decline in government bond prices will unfold during the 2020s. (Last update: 11 September 2017)
The stock market, as represented by the S&P500 Index, commenced a secular BEAR market during the first quarter of 2000, where "secular bear market" is defined as a long-term downward trend in valuations (P/E ratios, etc.), gold-denominated prices and inflation-adjusted prices. This secular trend will bottom in 2020 or later. (Last update: 11 September 2017)
A cyclical BEAR market in the US Dollar began in 2016-2017. (Last update: 11 September 2017)
Gold commenced a secular bull market relative to all fiat currencies, the CRB Index, bonds and most stock market indices during 1999-2001. This secular trend will peak in 2020 or later. (Last update: 11 September 2017)
Commodities,
as represented by the CRB Index, commenced a
secular BULL market in 2001 in nominal dollar terms. The first major
upward leg in this bull market ended during the first half of 2008, but
a long-term peak won't occur until 2020 or later.
(Last
update: 11 September 2017)
Copyright
Reminder
The commentaries that appear at TSI
may not be distributed, in full or in part, without our written permission.
In particular, please note that the posting of extracts from TSI commentaries
at other web sites or providing links to TSI commentaries at other web
sites (for example, at discussion boards) without our written permission
is prohibited.
We reserve the right to immediately
terminate the subscription of any TSI subscriber who distributes the TSI
commentaries without our written permission.
True
Fundamentals Summary
[Notes:
1) The date shown next to the current True Fundamentals Model (TFM) signal is
when the most recent change occurred. 2) Charts of the Gold and Equity
TFMs are included in the "Charts and Indicators" section of the TSI web
site]
| Market | True Fundamentals Model (TFM) |
| Gold (US$ Price) | Bearish (12 Jan 2018) |
| US Equity (SPX) | Neutral (12 Jan 2018) |
| Currency (Dollar Index) | Bullish (15 Dec 2017) |
| Commodities (GNX) | Bullish (29 Dec 2017) |
Last week's posts at the TSI Blog
Gold Leads Silver
Summary of current
thinking/positioning
1) Thinking that the US$ gold
price will work its way downward over the next few weeks but will go on to
make new highs for the year during the second quarter.
2) Still
favouring a drop in the stock market to test the early-February low during
March, but now assigning a very low probability that the decline from the
January peak is something more bearish than a short-term correction.
3) Thinking that industrial commodities such as oil and copper are in
downward trends that will end in March.
4) Expecting the rebound in
the Dollar Index (DX) to continue for a few more weeks before the
longer-term downward trend resumes.
5) Thinking that the T-Bond's
short-term risk and reward are now in balance, meaning that the best place
for short-term traders to be is on the sidelines.
6) Holding a cash
reserve of 25%-30% and looking for opportunities to increase it.
Commodities
EV (Electric Vehicle)
Metals Update
What we call "EV Metals" are the metals for
which demand would be given a substantial boost by the proliferation of
electric vehicles. That's due to the use of these metals in the batteries
or the motors or the wiring for electric cars, trucks and buses. The
members of the EV Metals group are copper, nickel, cobalt, lithium and the
rare earth elements (REEs).
With regard to potential price
performance over the coming 1-5 years, the EV metals collectively have a
better risk/reward than any other commodity group that we track. In
particular, the risk/reward of the EV Metals group is superior to that of
the precious metals group (gold, silver and platinum) and vastly superior
to that of the traditional energy-commodities group (oil, thermal coal,
natural gas and uranium). However, within the EV Metals group there are
widely varying supply/demand prospects and therefore different risk/reward
ratios, largely dependent upon the extent to which the overall demand for
each metal will be affected by the shift from ICE (internal combustion
engine) to electric.
For example, due to its widespread use in
electrical cabling and plumbing throughout the world, the proliferation of
electric vehicles will not result in a large percentage increase in the
global consumption of copper. For a second example, nickel demand will
continue to be dominated by the steel industry for at least the next three
years (65%-70% of all nickel production goes into stainless steel and
another 20% goes into other metal alloys). Even in the cases of copper and
nickel, though, by early next decade the EV-related addition to demand
should be enough to have a significant price effect. Actually, due to
speculative buying in anticipation of increasing commercial demand, the
price effect is already being seen.
Price wise, the metals that
appear to be the most levered to the EV trend are cobalt and the REEs.
Lithium is obviously a critical component of the lithium-ion battery and
as a result is experiencing a large increase in demand, but in the lithium
market there is much greater scope to boost supply to meet rising demand
than there is in the markets for cobalt and some of the REEs.
Cobalt has regularly been in the news of late due to the intersection of
rising demand and a precarious supply situation. The supply situation is
precarious because more than 60% of the world's production comes from the
DRC and the DRC is not becoming less risky. On the contrary, as if in an
effort to underline the risk of investing in its country the DRC
parliament recently approved unexpected law changes that will lead to much
higher mining costs.
Mining companies operating in the DRC are lobbying to prevent these
changes from being signed-off by President Kabila.
Due to the risk
of a major supply disruption in the cobalt market, end users of the metal
have taken the unusual step of dealing directly with mining companies. For
example,
Apple is now negotiating directly with miners to make sure that it
will have the cobalt it needs for the batteries that go into iPhones.
Currently, about a quarter of global cobalt production is used in
smartphones.
The combination of cobalt's precarious supply
situation and the potential ramp-up in cobalt demand due to the increasing
popularity of EVs may lead to a doubling or even tripling of the cobalt
price over the coming 1-2 years. At the same time, the extreme difficulty
of increasing the cobalt supply in response to greater demand will prompt
battery makers to seek out alternatives. The search for alternatives will
have to be successful, otherwise the entire EV trend will be dramatically
slowed by lack of reasonably-priced cobalt. The only question is the
timing. In other words, cobalt's risk/reward is very attractive, but it
isn't a one-way bet. Cobalt will eventually price itself out of the market
and then the price will drop back to earth.
How to profit
from the EV trend
There are plenty of mining stocks that
offer exposure to cobalt, usually with the cobalt resource being a
relatively small part of a nickel or copper project. Some of these mining
stocks, especially those within the ranks of exploration/development-stage
juniors, will provide their owners with spectacular gains over the next
few years, but the best way for most investors to gain exposure to cobalt
is via the shares of Cobalt 27 (TSXV: KBLT). KBLT was added to the TSI
Stocks List about three weeks ago.
The bulk of KBLT's current value
is associated with physical cobalt stored in LME warehouses, which means
that there is almost no political/country risk and that the stock is close
to being a pure play on the cobalt price. The rest of the current value is
associated with royalties on cobalt and nickel production in North
America. Moreover, the company will be doing cobalt streaming deals in the
future.
There is currently no nickel exposure in the TSI Stocks
List, although there is some in the Small Stocks Watch List via Cassini
Resources (CZI.AX). CZI is a reasonable speculation based on the
likelihood that within the next few years the economics of the company's
large-but-low-grade West Musgrave project will shift from marginal to
robust due to higher metal prices, prompting CZI's well-funded JV partner
(Oz Minerals) to make a takeover bid.
If we were going to add
nickel exposure to the TSI Stocks List we would probably opt for JJN, an
ETN designed to track the nickel price. However, we are in no hurry to do
anything with JJN.
There is also currently no exposure to lithium
in the TSI List. We will be on the lookout for an opportunity to add a
lithium stock or the Global X Lithium ETF (LIT) to the TSI List, but the
lithium sector is intermediate-term 'overbought' following a 2-year rally
and most lithium stocks look expensive.
The Dubbo Project of Alkane
Resources (ALK.AX) provides the TSI Stocks List with exposure to REEs as
well as a few other interesting commodities, but we have suggested Arafura
Resources (ARU.AX) as a focused play on the specific REEs needed to make
the permanent magnets that go into EV motors. A brief write-up on ARU was
included in the 17th January Interim Update.
Copper exposure is
easy to obtain, as there are numerous listed copper producers/explorers
and many copper-mining stocks are reasonably priced at this time.
Furthermore, copper exposure often comes with gold exposure, or vice
versa, which is not a bad thing when selecting a long-term holding because
one metal hedges the other.
The TSI Stocks List currently has
exposure to copper via Sandfire Resources (SFR.AX), a mid-tier
Australia-based copper-gold producer, Nevsun Resources (NSU), a company
with a zinc-copper mine in Eritrea and a large undeveloped copper project
in Serbia, and Euro Sun Mining (ESM.TO), an exploration-stage junior with
a gold-copper project in Romania.
Lastly, bear in mind that even if
our current bullish outlook is in the right ballpark, the EV trend will
take up to 10 years to play out. Therefore, don't be in a rush to
accumulate exposure to the trend and don't buy for a short-term trade.
COT Extremes
Like all sentiment indicators,
the Commitments of Traders (COT) numbers only provide actionable
information at extremes or when they diverge in a big way from the market
price. Most of the time they can be safely ignored.
Currently, four
of the markets we follow have COT situations that are near extremes, or
that appear to be near extremes based on the data of the past decade. One
of these is the 10-year T-Note futures market, where speculators, as a
group, have built-up an unusually-large short position. We covered the
T-Note market's COT situation last week and it is not significantly
different now. The three other futures markets that have comparatively
extreme COT situations are oil, silver and the euro.
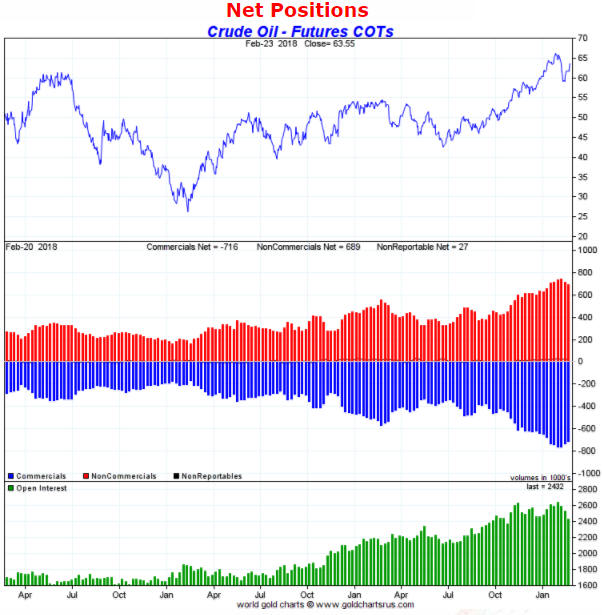
In the oil
market the total speculative net-long position (the equivalent of the
commercial net-short position, which is indicated by the blue bars in the
middle section of the following chart) has shrunk a little over the past
two weeks, but it remains close to the all-time high reached three weeks
ago. This should be taken as a bearish sentiment warning, although, as
we've previously noted, the short-term downside risk in the oil price is
mitigated by bullish fundamentals (demand in the physical market remains
strong relative to supply).
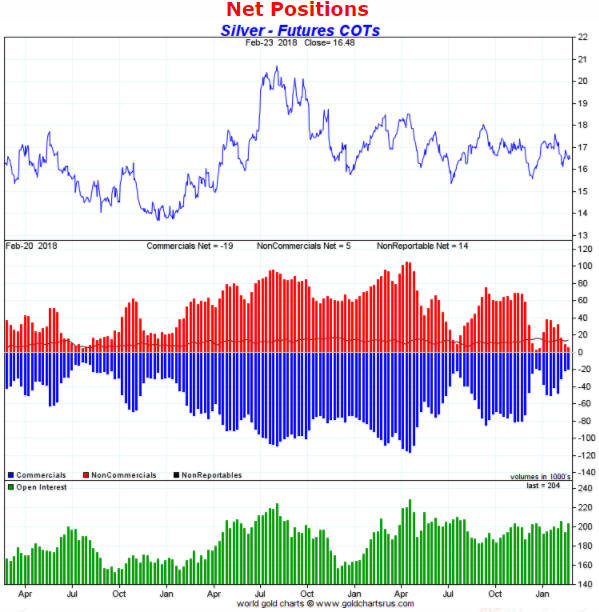
In the silver market the total speculative net position has shrunk to
a level that would be consistent with at least a short-term low. At the
same time, however, the open interest in silver futures (indicated by the
green bars in the bottom section of the following chart) is much larger
than would normally occur at an intermediate-term price bottom.
Silver's COT situation suggests that a) the price could be close to a
short-term bottom and b) a rally that began from near the current level
would be of similar magnitude and duration to the rebounds that started
from short-term lows in July and December of 2017. In other words, the
rally would not be substantial.
A decline in open interest to 160K
contracts or less would set the stage for a much larger rally.
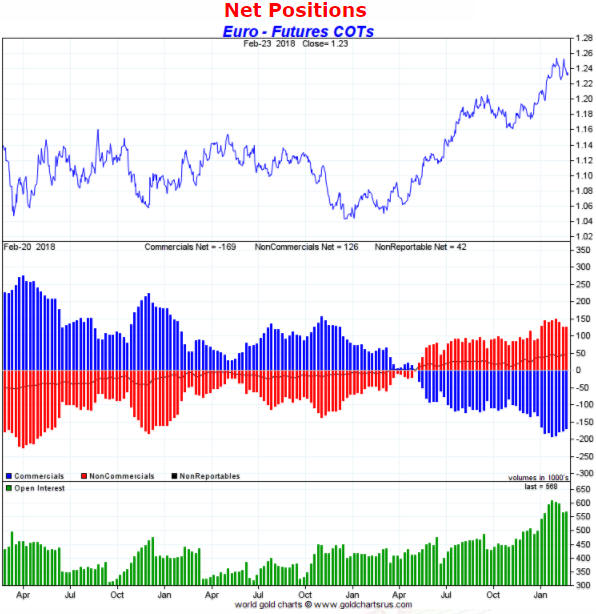
The COT situation in the market for euro futures is similar to the COT
situation in the market for oil futures, in that the total speculative
net-long position has reduced a little but remains close to its all-time
high. This should be taken as a bearish sentiment warning, especially
since the euro's fundamentals are bearish.
The Stock Market
At the beginning of last week we
expected 1-2 weeks of additional consolidation in the US stock market
prior to a sharp decline that resulted in a test and possibly a breach of
the 9th February low (2530 for the SPX). Last week's price action hasn't
changed what we consider to be the most likely near-term scenario,
although it's fair to say that the US stock market ended the week on a
stronger note than we expected.
Thanks to its 43-point rise on
Friday 23rd February the SPX has achieved the first solid close above its
50-day MA since the rebound from the 9th February low got underway.
However, it wasn't able to close above its 16th February intra-day high.
The NASDAQ100 Index (NDX) has been much stronger than the SPX and has
moved up to within 2% of its January peak.
And then there's Amazon.com (AMZN), the most important stock in the US
market at the moment. AMZN did no more than spike down to its 50-day MA
during the early-February market-wide plunge and has since returned to its
January high. In fact, it made a marginal new all-time high last week on a
daily-closing basis and an intra-day basis. It ended the week exactly at
$1500.
Amazon is a great company, but its stock market capitalisation is
absurdly high relative to its revenue and earnings. That being said, AMZN
looks downright cheap compared to Tesla (TSLA). Tesla is a classic bubble
story -- a massively-unprofitable enterprise that probably shouldn't exist
but that continues to attract substantial investment due to
counter-productive central bank and government policies.
TSLA has
one thing going for it, though: its over-valuation is so egregious and so
obvious that there is consistently a large short position in the shares.
Covering by the short sellers periodically fuels rebounds in the stock
price.
After plunging to major support at $300 in sympathy with the
early-February market-wide weakness, TSLA has returned to the vicinity of
its January high. However, this strong rebound hasn't altered the
longer-term chart pattern. TSLA still appears to be tracing out a major
top.
As stated at the start of this section, last week's price action
hasn't changed what we consider to be the most likely near-term scenario.
We continue to anticipate a sharp decline that results in a test and
possibly a breach of the 9th February low, although if the anticipated
decline hasn't begun by this time next week then the probability of it
happening at all will have plummeted. Also, with the SPX having managed to
break above its 50-day MA and with the NDX positioned to challenge its
January high within the next few days, a successful test of the 9th
February low has a much higher probability than a breach of the low.
Further to a comment we made in last week's Interim Update, it would
be reasonable for traders to use a daily SPX close above 2750 as a 'stop'
for short-term bearish positions. A stopped-out trader can always return
to the fray following evidence of a reversal.
Lastly, it is clear
that the US stock market has become very sensitive to rising bond yields.
There are early signs that bond yields have begun to consolidate below
their recent highs, but when 10-year T-Note and 30-year T-bond yields
eventually break above 3.00% and 3.22%, respectively, a likely
ramification will be another gut-wrenching stock market decline.
This week's
significant US economic events
[Notes:
1) The most important events
(to the markets) are shown
in bold. 2) A list of global economic events can be found
HERE]
| Date | Description |
| Monday Feb-26 | New Home Sales |
| Tuesday Feb-27 |
Durable Goods Orders Case-Shiller Home Price Index Consumer Confidence |
| Wednesday Feb-28 |
Q4 GDP (revised) Pending Home Sales Index Chicago PMI |
| Thursday Mar-01 |
Motor Vehicle Sales Personal Income and Spending ISM Mfg Index Construction Spending |
| Friday Mar-02 | Consumer Sentiment |
Gold and the Dollar