|
-- Weekly Market Update for the Week Commencing 26th March 2012
Big Picture
View
Here is a summary of our big picture
view of the markets. Note that our short-term views may differ from our
big picture view.
In nominal dollar terms, the BULL market in US Treasury Bonds
that began in the early 1980s will end by 2013. In real (gold)
terms, bonds commenced a secular BEAR market in 2001 that will continue
until 2014-2020. (Last
update: 23 January 2012)
The stock market, as represented by the S&P500 Index, commenced
a secular BEAR market during the first quarter of 2000, where "secular
bear market" is defined as a long-term downward trend in valuations
(P/E ratios, etc.) and gold-denominated prices. This secular trend will bottom sometime between 2014 and 2020. (Last update: 22 October 2007)
A secular BEAR market in the Dollar
began during the final quarter of 2000 and ended in July of 2008. This
secular bear market will be followed by a multi-year period of range
trading. (Last
update: 09 February 2009)
Gold commenced a
secular bull market relative to all fiat currencies, the CRB Index,
bonds and most stock market indices during 1999-2001. This secular trend will peak sometime between 2014 and 2020. (Last update: 22 October 2007)
Commodities,
as represented by the Continuous Commodity Index (CCI), commenced a
secular BULL market in 2001 in nominal dollar terms. The first major
upward leg in this bull market ended during the first half of 2008, but
a long-term peak won't occur until 2014-2020. In real (gold) terms,
commodities commenced a secular BEAR market in 2001 that will continue
until 2014-2020. (Last
update: 09 February 2009)
Copyright
Reminder
The commentaries that appear at TSI
may not be distributed, in full or in part, without our written permission.
In particular, please note that the posting of extracts from TSI commentaries
at other web sites or providing links to TSI commentaries at other web
sites (for example, at discussion boards) without our written permission
is prohibited.
We reserve the right to immediately
terminate the subscription of any TSI subscriber who distributes the TSI
commentaries without our written permission.
Outlook Summary
Market
|
Short-Term
(0-3 month)
|
Intermediate-Term
(3-12 month)
|
Long-Term
(1-5 Year)
|
| Gold
|
Bullish
(26-Mar-12)
|
Bullish
(26-Mar-12)
|
Bullish
|
| US$ (Dollar Index)
|
Neutral
(22-Nov-11)
| Neutral
(09-Jan-12)
|
Neutral
(19-Sep-07)
|
| Bonds (US T-Bond)
|
Bearish
(05-Mar-12)
|
Neutral
(18-Jan-12)
|
Bearish
|
| Stock Market (S&P500)
|
Bearish
(23-Jan-12)
|
Bearish
(28-Nov-11)
|
Bearish
|
| Gold Stocks
(HUI)
|
Bullish
(26-Mar-12)
|
Bullish
(23-Jun-10)
|
Bullish
|
| Oil | Neutral
(31-Jan-11) | Neutral
(31-Jan-11)
| Bullish
|
| Industrial Metals
(GYX)
| Neutral
(22-Nov-11)
| Neutral
(29-Aug-11)
| Neutral
(11-Jan-10)
|
Notes:
1. In those cases where we have been able to identify the commentary in
which the most recent outlook change occurred we've put the date of the
commentary below the current outlook.
2. "Neutral", in the above table, means that we either don't have a
firm opinion or that we think risk and reward are roughly in balance with respect to the timeframe in question.
3. Long-term views are determined almost completely by fundamentals,
intermediate-term views by giving an approximately equal weighting to
fundamental and technical factors, and short-term views almost
completely by technicals.
Keynes' most insightful
statement
In the forward to the German edition of his "General Theory", published in 1936, Keynes stated:
"The theory of aggregate production, which is the point of the following book, nevertheless can be much easier adapted to the conditions of a totalitarian state than the theory of production...put forth under conditions of free competition and a large degree of laissez-faire."
This is true, but doesn't go quite far enough. It would be more accurate to say that Keynes's economic theories can only be fully applied under a fascist political system.
Fascism is a political system characterised by the combination of private ownership and strict government control. In particular, the means of production are privately owned, but the government is heavily involved in the organisation of production. Also, there is a big overlap between business and government, with business leaders immersed in politics and political leaders immersed in business.
It is the system that is practiced, to varying degrees, in most countries today.
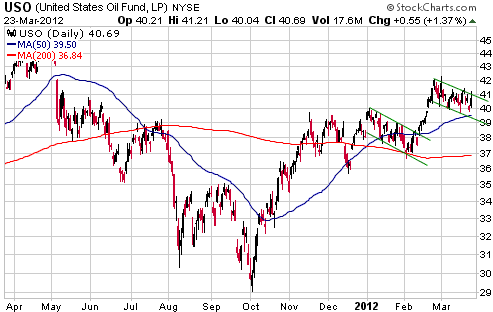
Oil Update
With the caveat that chart patterns can be deceptive, we note that oil's March decline looks similar to its January decline and that the January decline turned out to be a routine short-term consolidation. If the similarities continue then the oil price will soon commence another multi-week advance.
At this stage we plan to take partial profits on our USO (United States Oil Fund) call options if USO moves up to near last year's high (around $45), but a lot will depend on the situation in the Middle East at the time. We would probably hold off on taking profits on these options if we had a good reason to believe that there was a high short-term risk of a Middle-East-related oil supply shock.
The Stock
Market
Volatility
The Volatility Index (VIX) is near its lowest level of the past three years. This doesn't mean that a large stock market decline will begin in the near future. What it means is that:
a) The intermediate-term rally is much closer to its end than its beginning.
b) The senior stock indices probably aren't going to make a lot of additional headway between now and the next intermediate-term peak.
c) Although the market could still be a few months away from an important peak, the next big move is more likely to be to the downside than the upside.
d) There will probably be at least a minor volatility spike within the next two months.
With volatility likely to increase in the future it is tempting to buy VXX, an ETN that tracks short-term VIX futures. The problem with this ETN is that it will tend to perform worse than the VIX during periods -- like now -- when the market expects volatility to be higher in the future than it is in the present. This is due to a continuous roll from the first month futures to the second month futures. More specifically, VXX is designed to track an index that is continuously rolling from the first month VIX futures to the second month VIX futures, which means that it will continuously be selling the lower priced contract and buying the higher priced contract during periods when the market is anticipating a rise in volatility. This explains why VXX recently plunged in parallel with a flat VIX (as indicated on the following chart).
By the same token, during periods when the market is expecting volatility to be lower in the more distant future than in the immediate future the continuous rolling from the nearer to the more distant futures contract will cause VXX to do much better than the VIX. For example, notice, with reference to the following chart, that there was a huge rally in the VXX during August-October of last year AFTER the VIX had peaked for the year. This occurred because the index that VXX tracks was continuously selling higher-priced futures contracts and buying lower-priced future contracts.
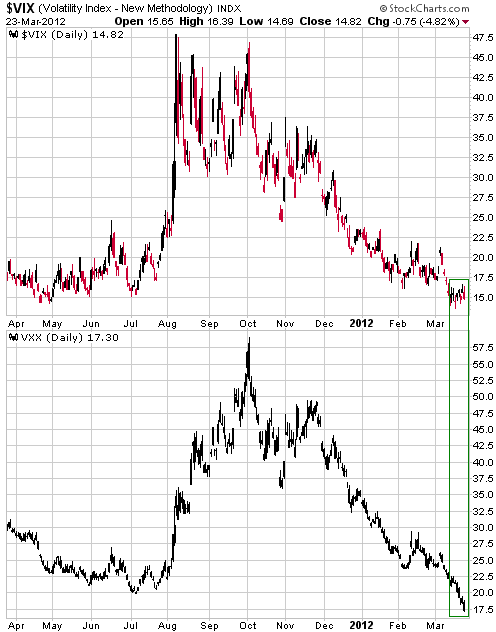
The upshot is that it is difficult to use VXX and other ETNs that track VIX futures to trade volatility swings in the stock market. You not only have to get your timing exactly right, you also have to deal with the fact that these ETNs sometimes move counter-intuitively.
Current Market Situation
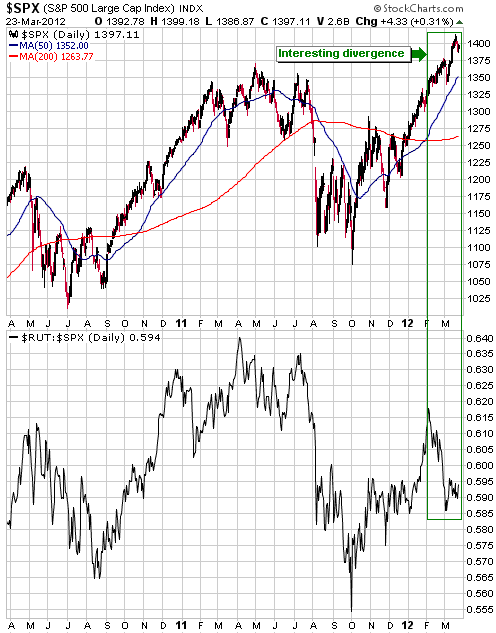
Not much happening with and not much to say about the broad US stock market. One point of interest is that the divergence between the S&P500 Index and the relative strength in small cap stocks (as indicated by the RUT/SPX ratio) remains in place. As illustrated by the following chart, the RUT/SPX ratio has rebounded a little from its early-March 'oversold' extreme but it hasn't yet rebounded enough to make a meaningful difference.
The RUT/SPX ratio will be worth monitoring over the next few weeks. If this ratio breaks below its early-March low it will signal an important change in the overall market trend, whereas if RUT/SPX continues to rebound it will suggest that the trends of the past 4-5 months are intact.
This week's
important US economic events
| Date |
Description |
| Monday Mar 26 | Pending
Home Sales Index
Dallas Fed Manufacturing Survey
| | Tuesday Mar 27 | S&P
Case-Shiller Home Price Index
Consumer Confidence
| | Wednesday Mar 28 | Durable
Goods Orders | | Thursday
Mar 29 |
Q4 GDP (revised)
|
| Friday Mar 30 | Personal
Income and Spending
Chicago PMI
Consumer Sentiment
|
Gold and
the Dollar
Gold
In a previous commentary we noted that gold probably wouldn't bottom on a short-term basis until after the euro-denominated gold price (gold/euro) had dropped to its 200-day moving average. As evidenced by the following daily chart, gold/euro dropped to within a whisker of its 200-day MA last week.
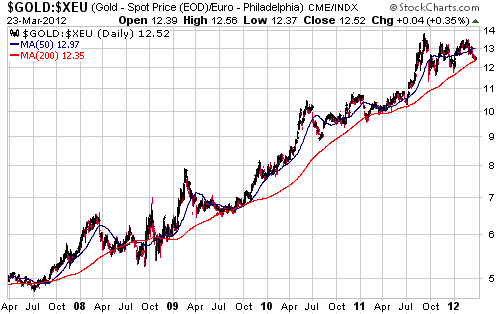
The only time over the past 5 years when gold/euro moved significantly lower than its 200-day MA was in the midst of the 2008 market crash. Nothing remotely similar to the 2008 crash is going to occur over the next several months, so we conclude that if gold/euro didn't bottom last week then it will soon do so at not far below last week's low.
Usually, bottoms in gold/euro roughly coincide with bottoms in the US$ gold price. With the euro more likely to strengthen than weaken against the US$ over the next couple of months, that should be the case this time around. In other words, if gold/euro is close to a bottom then the US$ gold price is probably also close to a bottom.
The idea that the gold market is close to a short-term bottom is supported by the latest Commitments of Traders (COT) data, which show that the total speculative net-long position in COMEX gold futures was 166K contracts as at 20th March. This is roughly where it was when gold was bottoming in late December.
Further to the above, we suspect that if gold didn't bottom last week then it will bottom this week at not far below last week's low. Our short-term gold market outlook has therefore changed from "neutral" to "bullish".
Our intermediate-term gold outlook has also changed from "neutral" to "bullish". The beginning of the next intermediate-term rally is probably still at least six months away, but it could begin earlier and the intermediate-term downside risk from here appears to be no more than 10%.
The T-Bond market poses the biggest short-term threat to the gold market. Another sharp decline in the T-Bond associated with perceptions of a strengthening US economy could lead to gold dropping back to the $1550-$1600 support range.
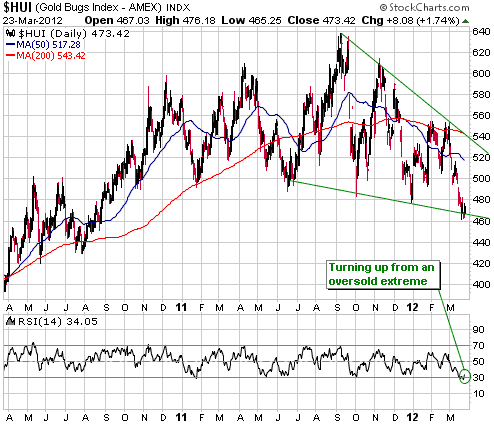
Gold Stocks
Current Market Situation
The HUI closed at its lowest level in more than one year on Thursday and then rebounded a little on Friday. Considering the extent to which it is now 'oversold' and the situation in the bullion market as discussed above, we suspect that a short-term bottom for the HUI was either put in place last week or will be put in place this week via a final downward spike to the 440s.
The upside potential from here is significant. A routine counter-trend rebound would likely take the HUI back to around 520, but the gold sector is sufficiently 'oversold' to launch a rally to 580-600. We have no way of knowing if such a rally is about to begin, but the upside potential is now clearly greater than the remaining downside potential. Our short-term HUI outlook has therefore changed to "bullish".
Market Value of Production and Resources, Part 2
The following table shows the per-ounce values currently being assigned by the stock market to the in-ground resources of the exploration-stage gold/silver miners included in the TSI Stocks List and a few non-TSI exploration-stage gold/silver miners (the stocks that are not current members of the TSI List have asterisks next to their names). Companies that are currently in production were covered in Part 1 of this analysis in the 19th March Weekly Update. Please refer to Part 1 for table notes and caveats.
| Company
Name |
Symbol |
Recent
Price (US$) |
Total
Shares (M) |
Mkt
Cap ($M) |
Ent.
Value ($M) |
M&I
Res. (Moz) |
Inf'd
Res. (Moz) |
Total
Res. (Moz) |
EV
$ per oz res. |
| Andina
Minerals |
ADM.V |
0.71 |
134 |
95 |
76 |
9.0 |
1.4 |
9.7 |
8 |
| Batero
Gold |
BAT.V |
0.92 |
60 |
55 |
52 |
2.9 |
1.6 |
3.7 |
14 |
| Carpathian
Gold |
CPN.TO |
0.45 |
590 |
266 |
196 |
4.0 |
4.5 |
6.3 |
31 |
| Clifton
Star Resources |
CFO.V |
1.72 |
38 |
65 |
103 |
1.8 |
3.5 |
3.5 |
30 |
| Chesapeake
Gold* |
CKG.V |
11.72 |
44 |
516 |
470 |
19.0 |
1.0 |
19.5 |
24 |
| Golden
Queen Mining* |
GQM.TO |
2.50 |
100 |
250 |
241 |
2.9 |
0.7 |
3.3 |
74 |
| Keegan
Resources |
KGN |
3.85 |
77 |
296 |
96 |
3.6 |
1.6 |
4.4 |
22 |
| Mansfield
Minerals |
MDR.V |
1.00 |
51 |
51 |
47 |
2.2 |
0.8 |
2.6 |
18 |
| Pretium
Resources |
PVG.TO |
13.88 |
95 |
1319 |
1284 |
38.8 |
27.2 |
52.4 |
24 |
| Rio
Novo Gold |
RN.TO |
0.52 |
113 |
59 |
31 |
1.0 |
1.2 |
1.5 |
20 |
| Sabina
Gold & Silver |
SBB.TO |
2.77 |
164 |
454 |
304 |
4.0 |
2.0 |
5.0 |
60 |
| Soltoro* |
SOL.V |
0.71 |
62 |
44 |
36 |
1.6 |
0.0 |
1.6 |
23 |
| Sandspring
Resources |
SSP.V |
1.05 |
138 |
145 |
106 |
6.0 |
4.0 |
8.0 |
13 |
| Sunward
Resources* |
SWD.V |
1.98 |
165 |
327 |
271 |
2.2 |
6.1 |
5.3 |
52 |
| International
Tower Hill Mines |
THM |
4.10 |
87 |
357 |
317 |
10.6 |
2.7 |
12.0 |
27 |
| Volta
Resources |
VTR.TO |
1.09 |
155 |
169 |
114 |
4.2 |
2.1 |
5.3 |
22 |
Here is a brief comment on each of the stocks in the above table:
1) Andina Minerals (TSXV: ADM)
Based on its enterprise value relative to the in-ground resource of its Volcan gold project in Chile, ADM has one of the lowest valuations in the realm of exploration-stage gold miners. The market is effectively saying that there is almost no chance of ADM's Volcan project ever being developed into a mine. However, the Pre-Feasibility Study (PFS) completed in February of last year suggests that the project would be viable at the current gold price. For example, using a discount rate of 7.5% the PFS estimated that the project's NPV would be $768M (about $7 per ADM share) at a gold price of $1400/oz.
The next indication of the project's economics will be provided by the Feasibility Study (FS) scheduled to be complete in mid 2012.
2) Batero Gold (TSXV: BAT)
BAT's stock price recently tumbled in reaction to a disappointing resource estimate. The company has actually made good progress over the past 12 months, but most people who follow the stock were expecting a higher initial resource at a much higher grade.
As we said as part of our reaction to the market's ultra-negative reaction to the initial resource estimate, we think that BAT's management did the company and its shareholders a disservice by using an unrealistically low cut-off grade in an effort to increase the size of the headline resource. Analysts are now doing their calculations assuming a 6.1M-ounce resource with a very low average grade of 0.39-g/t, but what the company really has is a 4.5M-ounce resource at a decent average grade of 0.53-g/t.
The figures in the above table assume a 4.5M-oz total resource (2.9M ounces M&I plus 1.6M ounces Inferred). Using these figures shows that BAT is now trading at less than one-third the valuation of Sunward, a company with a deposit of similar grade in the same region. Sunward doesn't look over-valued; BAT looks very under-valued.
Note that BAT could remain under pressure due to the company's need to do an equity financing in the near future.
3) Carpathian Gold (TSX: CPN)
CPN owns the large exploration-stage Rovina Valley gold-copper project in Romania and the much smaller construction-stage RDM gold project in Brazil. We like the first of these projects a lot. More importantly, so does Barrick Gold (Barrick invested in CPN in order to gain exposure to Rovina Valley). We aren't so keen on the second of these projects, but at the current valuation we effectively get the second project for free.
4) Clifton Star Resources (TSXV: CFO)
Market sentiment towards CFO turned very negative due to the lengthy trading halt imposed by Canadian regulators. The negative sentiment has created a much larger gap between price and value than would otherwise have been possible.
When trading was halted last July the stock was at $2.90. The work done on the ground in the intervening period confirms that the company is worth more today than it was then, and yet the stock is now trading 40% lower.
It is going to take time to repair the damage to sentiment and get the price back to a more realistic level (well north of $3). The comprehensive report currently being prepared by a third party consultant on the Duparquet project's overall resource should help in this regard. The report is scheduled to be complete at the end of April.
5) Chesapeake Gold (TSXV: CKG)
CKG owns the huge low-grade Metates gold project in Mexico (19M ounces in the M&I category). Its stock price has recently bucked the sector-wide downtrend and has gained 20% since the beginning of this month, but the valuation is still low.
The potential exists to develop Metates into a massive mining operation with average annual production of 750K ounces of gold and 19M ounces of silver, but an initial capital cost of more than $3B could be a stumbling block. The project is way too big for a company of CKG's size to contemplate taking through to production, so the question that speculators have to answer is: what is the likelihood of a major gold mining company buying CKG? Helping to answer this question will be a Pre-Feasibility Study due to be complete during the June quarter of this year.
CKG is an interesting speculation.
6) Golden Queen Mining (TSX: GQM)
GQM's Soledad Mountain gold/silver project in California has been estimated to have a Net Present Value of about $720M and an Internal Rate of Return of 87% at a gold price of $1457/oz. The capital cost is expected to be only $90M, the construction of the mine is expected to take only 9 months once financing is arranged, and the project became fully permitted more than 12 months ago. Why, then, has there been no visible progress over the past 12 months?
We don't know the answer to the above question, but the lack of action is causing shareholders to lose patience and has almost brought the share price back to an area where we would seriously consider returning GQM to the TSI List.
7) Keegan Resources (TSX and NYSE: KGN)
The PFS completed for KGN's Ghana-based Esaase project last September revealed that the costs to build and operate a mine were much higher than previously assumed. However, the PFS still indicated positive economics. For example, at a gold price of $1500/oz Esaase's NPV (5%) was estimated to be US$693M. Taking into account KGN's $200M of cash, this equates to around US$11 per fully diluted share.
The next major milestone for KGN is the definitive Feasibility Study (FS), which isn't due to be complete until the final quarter of this year. In the mean time, out-performance by KGN's shares will rely on wider recognition of the large gap between price and value.
8) Mansfield Minerals (TSXV: MDR)
MDR's Lindero project has low technical risk (the project contains a close-to-the-surface oxide gold resource that can be mined via a conventional open pit and heap leach operation), almost no permitting risk (the primary permit was received last October), and moderate political risk (Argentina). The Feasibility Study should be complete within the next few weeks and should confirm that MDR is very under-valued.
Company-specific negatives are management's lack of attention to stock promotion and the need to do an equity financing in the near future.
9) Pretium Resources (TSX and NYSE: PVG)
In our opinion, PVG is the world's best exploration-stage gold mining company. However, the best company won't always be the best investment. The extent to which a company is a good investment is determined by the value of the underlying business relative to the price of the shares. In general terms, any asset can be a bad investment if the price is high enough and almost any asset can be a good investment if the price is low enough.
Near its recent high PVG was expensive relative to most other exploration-stage gold mining stocks, even taking into account the quality of its assets and management. However, due to the market's absurd reaction to a press release announcing PVG's intention to issue about 10M new shares at some point in the future, the shares are again attractively priced considering the company's underlying value.
PVG owns a massive (>50M-oz) low-grade gold deposit with the potential to be developed into an open pit mine, but most of its value is associated with a much smaller -- but still sizeable at around 8.4M ounces -- high-grade deposit with the potential to be developed into an underground mine. The potential open-pit operation has substantial permitting risk and an unwieldy capital cost, whereas the potential underground operation has a relatively small environmental footprint (meaning: relatively low permitting risk) and an estimated capital cost that is low enough for a company of PVG's size to manage.
10) Rio Novo Gold (TSX: RN)
RN has two gold projects in Brazil and one in Colombia. Of these, the most advanced is the Almas project in Brazil but the one with the most potential is the Toldafria project in Colombia. Almas could be in production by the second half of next year.
11) Sabina Gold and Silver (TSX: SBB)
The figures in the above table only include SBB's Back River project. SBB offers good value based only on Back River's current size, but the company also owns a potentially valuable silver royalty on Xstrata's Hackett River project.
In addition to the sector-wide malaise, concerns about building and operating gold mines in the Canadian north have pushed SBB's stock price into deep value territory.
12) Soltoro (TSXV: SOL)
SOL is exploring the El Rayo silver project in Mexico. This project has the potential to be developed into an open-pit mine. It currently has 77M ounces of silver in the M&I category and will likely have at least 100M ounces by the end of this year.
SOL's in-ground silver resources are attractively valued. This stock should do well during the next intermediate-term silver rally.
13) Sandspring Resources (TSXV: SSP)
The table shows that SSP's 10M-ounce resource at its Toroparu project in Guyana is being valued at only $13/oz. However, the per-ounce valuation isn't quite that low if we account for the fact that the PEA completed by the company in January was based on a mine plan that encompasses total life-of-mine production of only 5M ounces. In other words, it seems that only about half of the currently-defined resource is 'mine-able'.
In any case, SSP still looks very under-valued considering that the aforementioned PEA included an estimated NPV(5%) for the project of $1,190M assuming a gold price of $1550/oz. This equates to about $9/share.
14) Sunward Resources (TSXV: SWD)
Similar to Batero, but about 12 months further advanced and with a much higher valuation. The one significant advantage that SWD has over BAT is that SWD has a lot of cash in the bank and therefore won't be under pressure to do an equity financing anytime soon.
15) International Tower Hill Mines (NYSE: THM, TSX: ITH)
The gold resource figures often quoted in THM's press releases are much higher than the ones shown in the above table. The difference is because the resource size will change depending on the assumed cut-off grade. In particular, the 16.5M-oz M&I resource often quoted by the company is based on a very low (read: very aggressive) 0.22-g/t cut-off grade, whereas the 10.6M-oz M&I resource shown in the above table is based on a more conservative (read: more realistic) 0.50-g/t cut-off.
From last week's Interim Update: "[THM's] Livengood project has a 13M-oz 'open-pitable' resource with an average grade of around 0.81-g/t at a cut-off grade of 0.50-g/t. Furthermore, it is located near power and transportation infrastructure in a politically secure region. Unless there is a major problem with the metallurgy that hasn't yet been revealed, in a gold-bullish environment it should be possible to come up with a mine plan that makes a project such as this economically viable."
The Livengood project should be economically viable, especially if a high-grade "starter pit" can be incorporated into the mine plan. The biggest short-term risk is that existing shareholders will have their stakes diluted by a low-priced equity financing.
16) Volta Resources (TSX: VTR)
The more we learn about this company and its West African gold assets, the more we like the story. It is currently in the TSI List as a short-term trade, but it has all the attributes of a longer-term speculation.
A Pre-Feasibility Study is due in the near future.
Currency Market Update
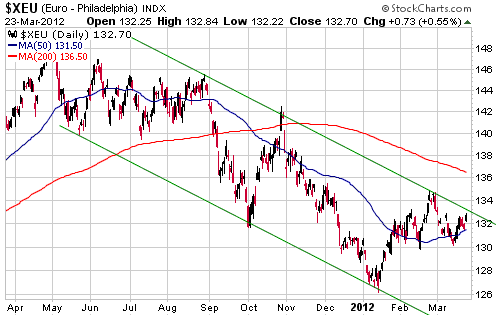
The euro-zone's government debt drama has temporarily moved away from centre stage, leaving the stock market as the most important influence on the euro's intermediate-term trend. This should mean that the euro maintains an upward bias until after an intermediate-term peak is in place in the stock market. Additionally, the market structure continues to create a tailwind for the euro in that there remains a large speculative net-short position in euro futures.
The pace of speculative short-covering in the euro futures market could accelerate after the euro breaks decisively above the top of the channel drawn on the following chart. This is because a clear break above the channel top will no doubt be interpreted by some trend-following speculators as evidence of a trend reversal.
Update
on Stock Selections
Notes: 1) To review the complete list of current TSI stock selections, logon at
http://www.speculative-investor.com/new/market_logon.asp
and then click on "Stock Selections" in the menu. When at the Stock
Selections page, click on a stock's symbol to bring-up an archive of
our comments on the stock in question. 2) The Small Stock Watch List is
located at http://www.speculative-investor.com/new/smallstockwatch.html
 Pretium Resources (TSX and NYSE: PVG). Shares: 88M issued, 95M fully diluted. Recent price: C$13.88 Pretium Resources (TSX and NYSE: PVG). Shares: 88M issued, 95M fully diluted. Recent price: C$13.88
As mentioned above and in last week's Interim Update, the market's absurd reaction to a press release announcing PVG's intention to issue about 10M new shares at some point in the future has resulted in the shares again becoming attractively priced considering the company's underlying value. The shares briefly traded at the bottom of our C$13-$14 buy range last Thursday before rebounding to end the week near the top of this range.
When we say "absurd reaction", we aren't exaggerating. The reaction would have been extreme even if PVG had announced that it was immediately doing an equity financing, but what it actually announced is that it has filed a "shelf registration" that would allow it to issue about $140M of new shares some time within the next two years (the "shelf registration" covered up to $180M, but $36M of this was for a secondary offering of PVG shares by SSRI).
Everyone who follows PVG would -- or, at least, should -- have known that the company would have to issue at least $140M of new shares within the next two years to fund the development of its gold projects, so last week's news wasn't really news at all. What, then, explains the huge market reaction?
We suspect that it was a combination of a very nervous market for gold shares, the fact that PVG had become expensive compared to many of its peers due to having resisted the sector-wide downward trend prior to last week, and selling related to the PVG warrants that expire in early April.
After the fact it is easy to say that last Monday's press release was poorly timed, but in our opinion there is no way that PVG's management could have anticipated the market's reaction. When we saw the press release we considered it to be a fairly routine statement that would at most push the shares a few percent lower. That it ended up being the catalyst for a quick 20% plunge was strange indeed, but not unwelcome for anyone waiting for an opportunity to buy.
Resolute Mining (ASX: RSG). Shares: 656M issued, 665M fully diluted. Recent price: A$1.79
Last Thursday there was a military coup in Mali, the country in which RSG's Syama gold mine is located.
At the time of writing the upheaval has not affected RSG's mining operation. Also, Randgold Resources (NYSE: GOLD) and Avion Gold (TSX: AVR), two other gold mining companies with their primary assets in Mali, have reported that their operations are running normally. However, the political risk associated with the Syama project has obviously risen, at least temporarily.
New short-term trading position: Global X Gold Explorers ETF (NYSE: GLDX). Recent price: US$10.04
We are returning GLDX, a proxy for exploration-stage gold mining stocks, to the TSI Stocks List as a trade with an expected duration of less than three months. Like the HUI, GLDX moved slightly below its October and December lows last week and is now very 'oversold'. A sizeable rebound is likely from last week's low or whatever new low is made this week.
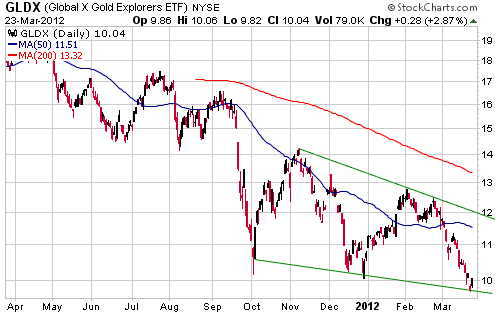
Chart Sources
Charts appearing in today's commentary
are courtesy of:
http://stockcharts.com/index.html

|
