![]()
![]()
![]()
![]()
-- Weekly Market Update for the Week Commencing 26th March 2018
Big Picture
View
Here is a summary of our big picture
view of the markets. Note that our short-term views may differ from our
big picture view.
The BULL market in US Treasury Bonds that began in the early 1980s ended in mid-2016, but there will be many years of topping action in bond prices and bottoming action in bond yields before major new trends get underway. A major decline in government bond prices will unfold during the 2020s. (Last update: 11 September 2017)
The stock market, as represented by the S&P500 Index, commenced a secular BEAR market during the first quarter of 2000, where "secular bear market" is defined as a long-term downward trend in valuations (P/E ratios, etc.), gold-denominated prices and inflation-adjusted prices. This secular trend will bottom in 2020 or later. (Last update: 11 September 2017)
A cyclical BEAR market in the US Dollar began in 2016-2017. (Last update: 11 September 2017)
Gold commenced a secular bull market relative to all fiat currencies, the CRB Index, bonds and most stock market indices during 1999-2001. This secular trend will peak in 2020 or later. (Last update: 11 September 2017)
Commodities,
as represented by the CRB Index, commenced a
secular BULL market in 2001 in nominal dollar terms. The first major
upward leg in this bull market ended during the first half of 2008, but
a long-term peak won't occur until 2020 or later.
(Last
update: 11 September 2017)
Copyright
Reminder
The commentaries that appear at TSI
may not be distributed, in full or in part, without our written permission.
In particular, please note that the posting of extracts from TSI commentaries
at other web sites or providing links to TSI commentaries at other web
sites (for example, at discussion boards) without our written permission
is prohibited.
We reserve the right to immediately
terminate the subscription of any TSI subscriber who distributes the TSI
commentaries without our written permission.
True
Fundamentals Summary
[Notes:
1) The date shown next to the current True Fundamentals Model (TFM) signal is
when the most recent change occurred. 2) Charts of the Gold and Equity
TFMs are included in the "Charts and Indicators" section of the TSI web
site]
| Market | True Fundamentals Model (TFM) |
| Gold (US$ Price) | Bearish (12 Jan 2018) |
| US Equity (SPX) | Bearish (23 Mar 2018) |
| Currency (Dollar Index) | Bullish (15 Dec 2017) |
| Commodities (GNX) | Bullish (29 Dec 2017) |
Last week's posts at the TSI Blog
Another look at gold's true fundamentals
Summary of current
thinking/positioning
1) A number of markets are set
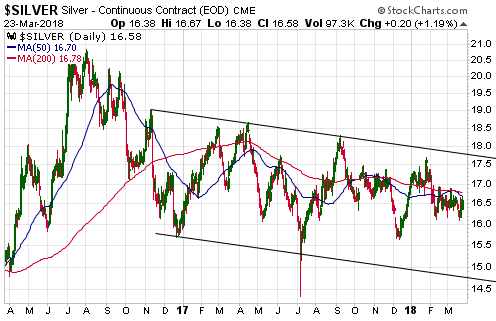
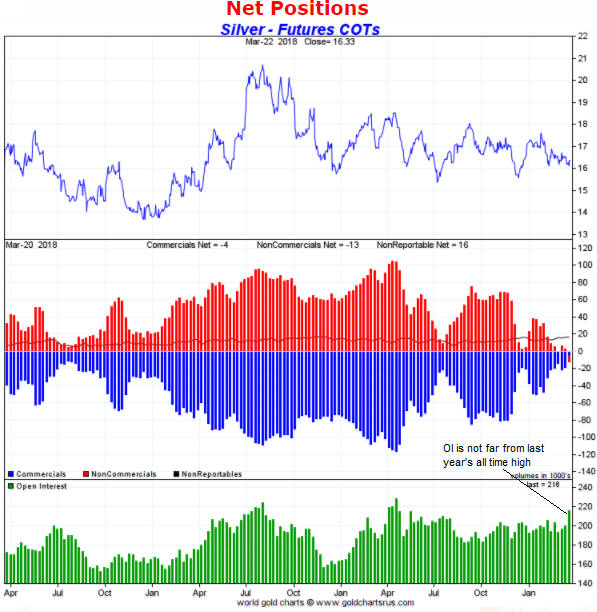
up for trend reversals or accelerations, with the US$ being the linchpin.
If the DX breaks out to the downside from its recent narrow range then
rallies should begin or accelerate across the commodity world, with silver
bullion and gold-mining stocks leading the way higher. However, if the DX
breaks out to the upside from its recent range then the commodity world
will have a downward bias for the ensuing two months. Last week there were
signs that the DX breakout will be to the downside, but the jury is still
out.
2) There is now a good chance that several important stock
indices, including the SPX, will revisit their early-February lows before
the correction comes to an end.
3) Downward corrections in oil and
copper will end by May, with the timing dependent upon what happens in the
currency market.
4) Bond yields are in long-term upward trends and
will go much higher before year-end, but a counter-trend move is underway.
The counter-trend move could end at any time, although we won't be
interested in placing a new bet against the bond market (a new bet on
higher interest rates) until there is a substantial reduction in the
speculative net-short position in 10-year T-Note futures.
5)
Holding a cash reserve of 25%-30%.
Thursday's closes
will be important
The major financial markets will
be shut for the Good Friday holiday on 30th March. Therefore, Thursday
29th March will be the final trading day of the week, the month and the
quarter. This means that Thursday's closing prices will be important. From
our perspective, the two most important weekly/monthly closes will be for
the US$ gold price and the SPX/euro ratio.
Due to last week's price
action, the SPX/euro ratio is in an interesting position as we enter the
final 4 trading days of March. This is because it is poised at its
24-month MA -- the blue line on the following monthly chart.
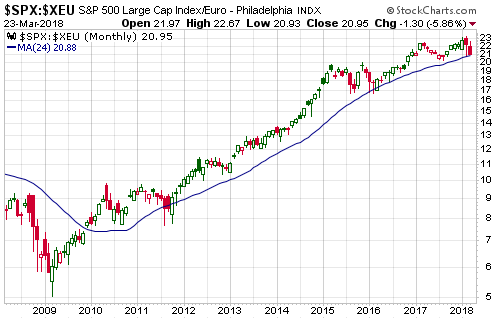
As explained in the 19th February Weekly Update:
"...with
the exception of the final stage of the drawn-out correction of 2010-2011
the SPX/euro ratio has not ended a month below its 24-month MA since 2009.
It traded below this MA during the 2015-2016 correction and again during
the week before last, but in each case it managed to avoid a
monthly-closing breach of the MA.
The consistency of SPX/euro's
long-term upward trend was also present during the 2004-2007 cyclical bull
market. SPX/euro tested its 24-month MA many times during this earlier
bullish period but didn't end a month below it until November-2007 -- the
month after the nominal SPX made its bull-market top.
Further to
the above, we would view a monthly close by SPX/euro below its 24-month MA
as a sign that the bull market was over. According to our current view,
this won't happen during the first quarter but potentially will happen
during the second half of the year. In other words, if SPX/euro were to
end February or March below its 24-month MA it would suggest that the
decline from the January-2018 peak was the start of a major bearish trend
as opposed to just a steep short-term correction."
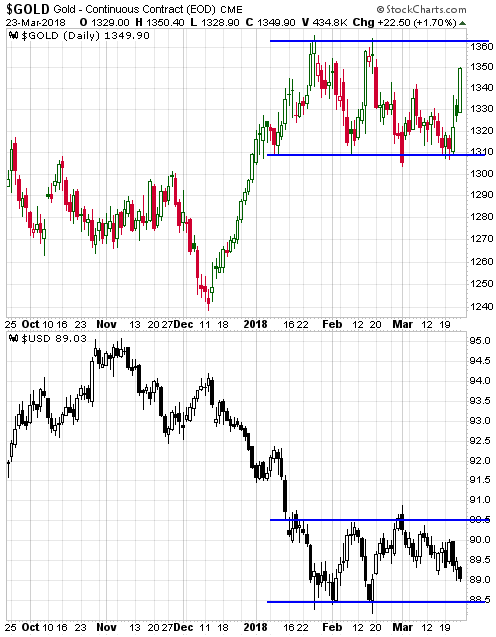
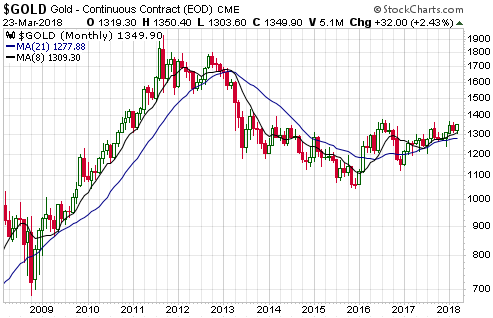
Due to last
week's price action, the US$ gold price is also in an interesting position
as we enter the final 4 trading days of March.
On a monthly closing
basis, gold has support at $1309 and resistance at $1363. At the beginning
of last week it was in greater danger of breaching support than breaching
resistance, but last week's rally has switched the probabilities.
A
29th March close above $1363 would be an important sign of strength.
Money Matters
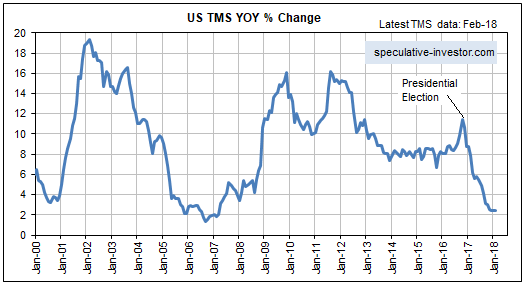
The year-over-year rate of
growth in the US True Money Supply (TMS) was around 11.5% in October of
2016 (the month before the US Presidential election) and is now only 2.4%,
which is near a 20-year low. Refer to the following monthly chart for
details. In terms of effects on the financial markets and the economy, up
until recently the US monetary inflation slowdown was largely offset by
continuing rapid monetary inflation elsewhere, most notably in Europe.
However, the tightening of US monetary conditions has started to have
noticeable effects and these effects should become more pronounced as the
year progresses.
The tightening of monetary conditions eventually will expose the
mal-investments of the last several years, which, in turn, will result in
a severe recession, but the most obvious effect to date is the increase in
interest rates across the entire curve. The upward acceleration in
interest rates over the past six months has more than one driver, but it
probably wouldn't have happened if money had remained as plentiful as it
was two years ago.
It would be a mistake to think that the
tightening has been engineered by the Fed. The reality is that the Fed has
done very little to date.
The Fed has made several 0.25% increases
in its targeted interest rates, but the main effect of these rate hikes is
to increase the amount of money the Fed pays to the commercial banks in
the form of interest on reserves (IOR). It doesn't matter how you spin it,
injecting more money into banks ain't monetary tightening!
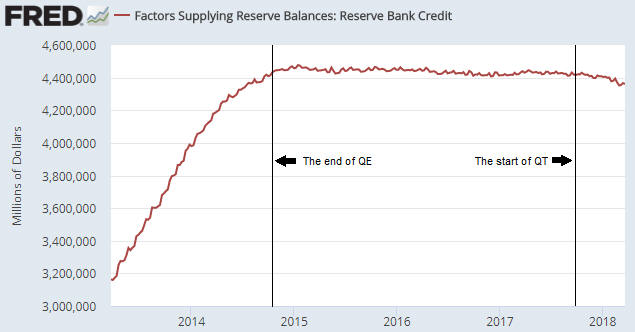
The
Fed's actual efforts on the monetary loosening/tightening front over the
past 5 years are encapsulated by the following weekly chart of Reserve
Bank Credit (RBC). This chart shows that there was a rapid rise in RBC
during 2013-2014 that ended with the completion of QE in October-2014. For
the next three years RBC essentially flat-lined, which is what should be
expected given that the Fed was neither quantitatively easing nor
quantitatively tightening during this period. In October-2017 the Fed
introduced its Quantitative Tightening (QT) program. To date, this program
has resulted in only a small reduction in RBC, but the plan is for the
pace of the QT to ramp up.
Strangely, the most senior members of
the Fed appear to believe that their baby-step rate hikes constitute
genuine tightening and that the contraction of the central bank's balance
sheet is neither here nor there. The reality is the opposite.
So, the Fed is not responsible for the large decline in the US
monetary inflation rate and the resultant tightening of monetary
conditions that has occurred to date.
The responsibility for the
tightening actually lies with the commercial banks. As illustrated by the
next chart, the year-over-year rate of growth in commercial bank credit
was slightly above 8% at around the time of the Presidential election in
late-2016 and is now about 3%.
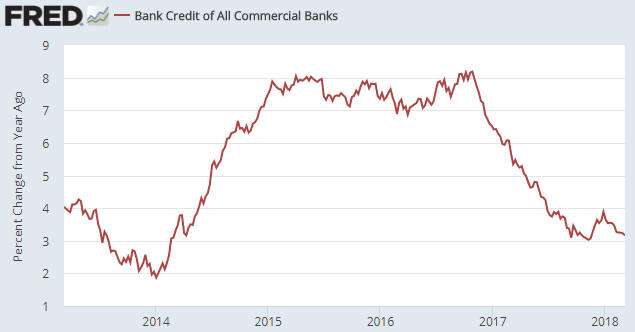
We won't be surprised if a steepening yield curve prompts commercial
banks to collectively increase their pace of credit creation over the next
two quarters, but with the Fed set to quicken the pace of its QT the US
monetary inflation rate probably will remain low by the standards of the
past two decades. At the same time, the ECB will be taking actions that
reduce the monetary inflation rate in the euro-zone. This could lead to
stock and bond market volatility during the second half of this year that
dwarfs what we've witnessed over the past two months.
The Stock Market
In general, breakouts above
resistance or below support are not reliable indicators of the future.
However, failed breakouts, meaning breaks through obvious support or
resistance that are negated within a short time, tend to be more
predictive.
For risk management purposes we usually will assume
that a breakout is genuine until/unless proved otherwise, but, with a
small number of exceptions that we won't get into right now, we rarely
take new positions in response to breakouts. We are far more likely to
take new positions in response to evidence of a breakout failure,
especially in those cases where we don't have significant existing
exposure to a price move in the direction of the reversal and/or the
reversal is consistent with our overarching market outlook.
Over
the past two weeks we noted that the NASDAQ100 Index (NDX) had broken
above obvious resistance defined by its January high and that we would
assume, until/unless proved otherwise, that the breakout was sustainable.
We also mentioned that a daily close below 6900 would point to a false
signal.
A daily close below 6900 happened last Monday. There
followed two days of sideways consolidation, at which time we posted our
interim report. In this report we wrote:
"The US stock market
generated a bearish signal during the first half of this week, in that the
NASDAQ100 Index (NDX) and the NASDAQ100 ETF (QQQ) fell far enough to
negate the upside breakouts that occurred during the week before last. A
daily QQQ chart is displayed below. We therefore have a failed upside
breakout on our hands, which increases the risk that the February low will
be tested before the correction comes to an end.
In response to
this week's evidence that the NDX's recent upside breakout was a 'fakeout'
it would be reasonable to purchase a new QID (UltraShort QQQ) position
near the current price of US$11.35. Risk could then be limited via a plan
to exit the trade if QQQ closed above its recent high. Note that this is
not a trade that will be implemented in our own accounts, but that's
mainly because we hold some put options that will gain substantial value
if QQQ plunges within the next two weeks."
Here is an updated
version of the chart mentioned in the above excerpt:
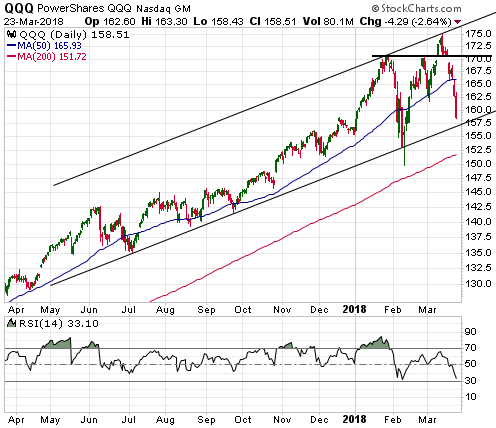
QQQ plunged over the final two days of last week. It ended the week
only 1% above its channel bottom, although it is still more than 10% above
its 9th February spike low.
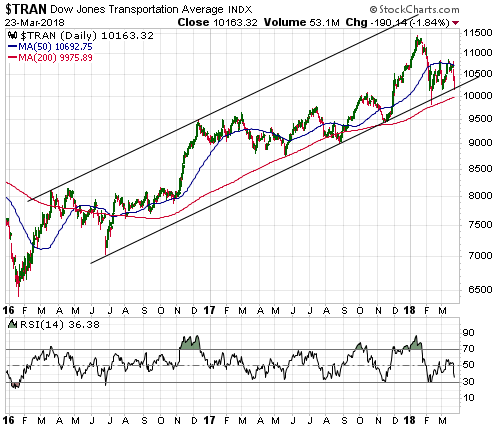
The Dow Transportation Average (TRAN)
didn't generate a false upside breakout during the rebound from its 9th
February spike low; it simply failed to show any real strength. We stated
a week ago that it was very much at risk of testing its February low, but
that the risk of a test would be greatly reduced by a daily close above
10,800.
A daily close above 10,800 never happened and a test of
the February low appears to be on the cards.
Interestingly, the
following daily chart shows that TRAN ended last week at the bottom of a
2-year channel. Consequently, there is a lot at stake at the moment.
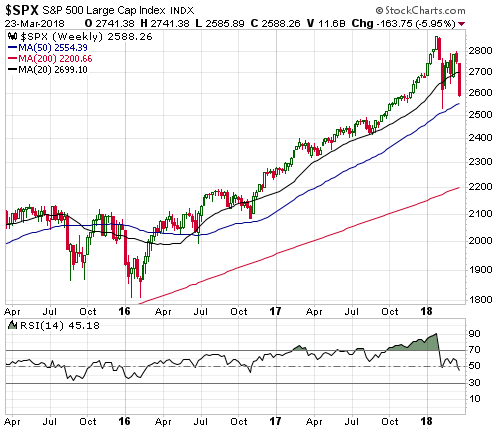
The weekly chart displayed below shows that the SPX just achieved its
lowest weekly close of the year.
On a weekly closing basis,
critical support is defined by the 50-week MA (the blue line on the
chart). A weekly close below this MA (2554 and rising) would suggest that
the overall correction was going to extend all the way to the 200-week MA
near 2200. An extension of this magnitude is still a long-shot, although
it is less improbable now than it appeared to be a week ago.
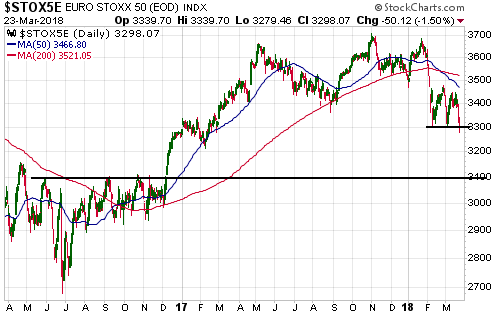
Turning to Europe, we see (refer to the daily chart displayed below)
that the EURO STOXX 50 Index (STOX5E) made a new 12-month low on Friday
23rd March. However, the breach of short-term support at 3300 was
marginal.
We mentioned in earlier commentaries that
intermediate-term support near 3100 is a likely target for a multi-month
bottom. That's still the case.
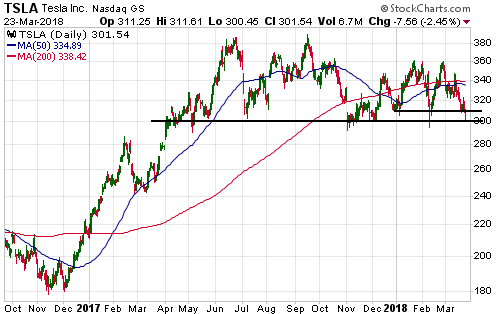
Turning to a specific stock that we have an interest in, the following
daily chart shows that Tesla (TSLA) just achieved its lowest daily close
of the year and ended last week at the edge of the precipice.
Our working assumption is that the SPX will do no worse than test its
early-February spike low (2530), but the price weakness on Friday opens up
the possibility of substantial follow-through to the downside early this
week. If this follow-through happens it should be viewed as an opportunity
to take profits on bearish speculations.
Our own account contains
QQQ April put options and TSLA April put options. We intend to exit all of
these puts if there is a sharp decline (a 'whoosh' to the downside) on
Monday 26th March. The TSI Stocks List contains a TSLA April put-option
position. This position will be exited on Monday if the stock price drops
by at least $20.
Note that due to its chart pattern and its
valuation, we would be inclined to take only partial profits on TSLA puts
in response to a sharp decline on 26th March if the puts had a few months
of remaining time. However, our puts expire in 4 weeks.
This week's
significant US economic events
[Notes:
1) The most important events
(to the markets) are shown
in bold. 2) A list of global economic events can be found
HERE]
| Date | Description |
| Monday Mar-26 | No important events scheduled |
| Tuesday Mar-27 |
Case-Shiller Home Price Index Consumer Confidence |
| Wednesday Mar-28 |
Pending Home Sales Index Q4-2017 GDP (revised) |
| Thursday Mar-29 |
Chicago PMI Consumer Sentiment |
| Friday Mar-30 | Markets closed for public holiday (Good Friday) |
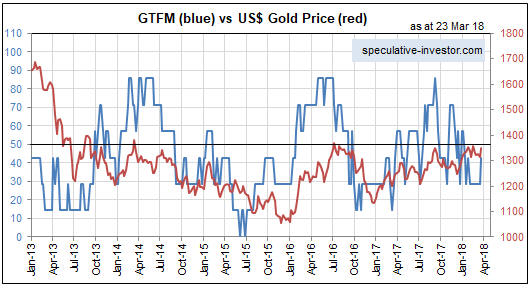
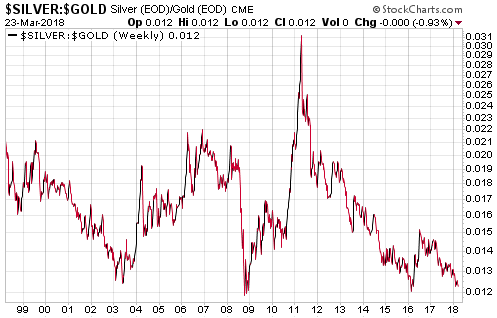
Gold and the Dollar