|
-- Weekly Market Update for the Week Commencing 26th July 2004
Big Picture
View
Here is a summary of our big picture
view of the markets. Note that our short-term views may differ from our
big picture view.
Bond yields (long-term interest
rates) bottomed in June of 2003 at around 4.2% and will move considerably higher during
2004 and 2005. (Last update: 12 January 2004)
The stock market rally that
began in October of 2002 ended during the first half of 2004. The October-2002
bottom (775 for the S&P500) will be tested during 2005. (Last update: 12 July 2004)
The Dollar made an
intermediate-term
bottom in February of 2004 and will move higher into the first half of 2005. A long-term
bottom won't occur until
2008-2010. (Last update: 26 July 2004)
Gold made an intermediate-term
peak during the first half of 2004, but a long-term peak won't occur until 2008-2010. (Last update: 12 July 2004)
Commodities, as represented
by the CRB Index, made an intermediate-term peak during the first
half of 2004, but a long-term
peak won't occur until 2008-2010. (Last update: 12 July 2004)
Copyright
Reminder
The commentaries that appear at TSI
may not be distributed, in full or in part, without our written permission.
In particular, please note that the posting of extracts from TSI commentaries
at other web sites or providing links to TSI commentaries at other web
sites (for example, at discussion boards) without our written permission
is prohibited.
We reserve the right to immediately
terminate the subscription of any TSI subscriber who distributes the TSI
commentaries without our written permission.
Important Note
Due to family
commitments we are going to miss at least two reports over the coming 3
weeks, including the next Interim Update. We're not sure yet which
other report(s) will be affected, but will let you know as soon as
we've confirmed our schedule.
The next report will therefore be the Weekly Update on Sunday 1st
August. In the mean time, if anything happens in the markets that we
think requires an immediate comment from us we'll send out a brief
Market Alert e-mail to all subscribers.
Is gold under-valued?
For anyone with a time
horizon of one year or longer it makes no sense to analyse the gold
market in isolation. This is because it is not possible to come to a
sensible conclusion about the long-term outlook for gold unless you
also have a well-grounded opinion on what is likely to happen to asset
prices, interest rates, currency exchange rates, inflation, and real
economic growth. The price of gold is just a reflection of the
financial world, so even if we didn't speculate in anything other than
gold bullion we would need to spend as much time analysing the other
financial markets as we do now.
Further to the above, it is really not appropriate to say that gold is
currently under-valued unless you specify what it is under-valued
relative to. And in this respect it is not enough to say that gold is
under-valued relative to the US dollar because the dollar's value, like
gold's value, is determined by each individual based on his/her own
perception of the world. Value is always at least partially subjective
(of value to whom and for what?) and this is even more so with the
dollar and gold than it is with, say, stocks or bonds or real estate,
because neither the dollar nor gold has a yield that we can compare
with historical records in order to quantify its current level of
under- or over-valuation.
It is also not appropriate to say that gold is under-valued now simply
because it is trading well below it's 1980 peak. It could be argued,
for instance, that the 1980 peak was an aberration and that it has
taken the past 24 years for gold to work its way back to a level where
it is fairly valued.
In the cases of both gold and the dollar, the terms under- and
over-valuation only have meaning for each market participant when
referenced to that individual's perception of the world. As far as we
are concerned, gold is dramatically under-valued because our research
indicates that the markets are grossly under-estimating the US
inflation problem. We are not so arrogant, though, that we rule out the
possibility of a reasonable person coming to the opposite conclusion;
although having said that we can't think of anyone who we would put in
the "reasonable" category who thinks gold is over-valued at its current
level.
The Stock
Market
Following the leader
Making semiconductor chips is generally not a great business because
profit margins are usually under pressure and those chip companies that
are able to maintain healthy profit margins can only do so by spending
massive amounts every year on research and development. However, over
the past several years the stocks of semiconductor companies have
traded at high price/sales ratios, that is, they've traded as if the
companies were involved in high-margin businesses. And this mismatch
between stock price and underlying business value means that the stocks
are inherently risky, which, in turn, causes them to be leaders to the
upside when the general appetite for risk is increasing and leaders to
the downside when market participants are becoming more risk averse.
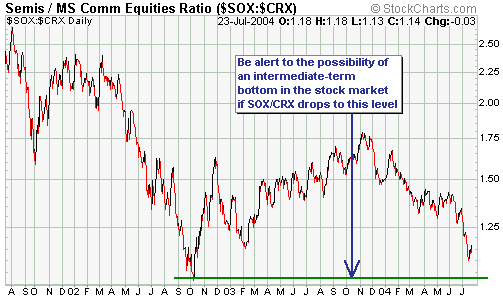
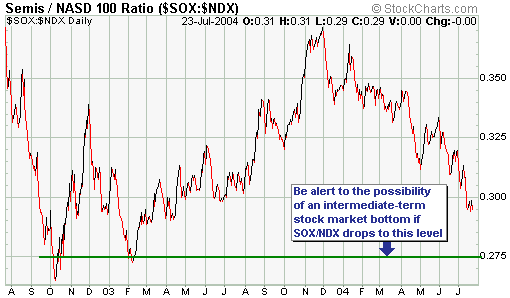
The below charts of the SOX/CRX ratio (the Semiconductor Index divided
by the Commodity-Related Stocks Index) and the SOX/NDX ratio illustrate
the above point. In particular, they show that the semiconductor stocks
trended higher relative to commodity stocks and large-cap tech stocks
between October-2002 and December-2003, indicating a general increase
in the appetite for risk. However, from December-2003 to the present
the semiconductor stocks have been very weak on a relative basis.
Interestingly, relative weakness in the SOX over the past 8 months has
resulted in these ratios dropping to within 5-10% of major
support.
The below chart shows that the SOX is also within about 5% of potentially important support on an absolute basis.
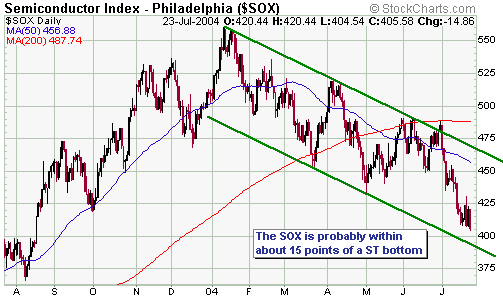
As long as the SOX --
the leader to the upside during last year's recovery and the leader to
the downside thereafter -- is trending lower relative to indices such
as the CRX and the NDX there will be little chance that an
intermediate-term low is in place. However, once we start seeing
persistent relative strength in the SOX it will probably be time to
back away from our short- and intermediate-term bearish views.
Remembering 2001
As a general rule, when the broad stock market falls at a rapid pace
the gold stocks get taken along for the ride. There are, however, some
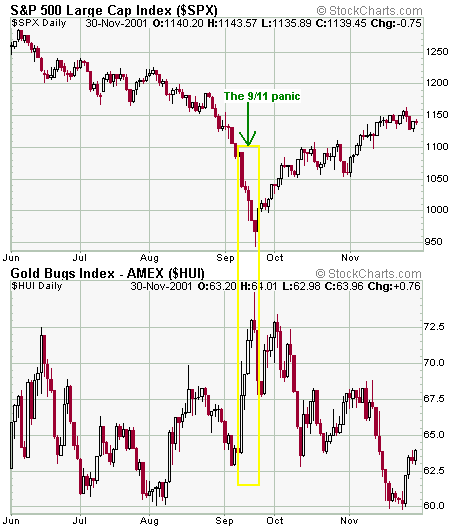
exceptions to this rule, one of which was highlighted in 2001.
Specifically, the below chart comparison of the S&P500 and the HUI
illustrates that when the stock market tanked in the aftermath of the
September-2001 terrorist attacks the gold stocks moved sharply higher.
This is something to keep in mind in the current environment.
Current Market Situation
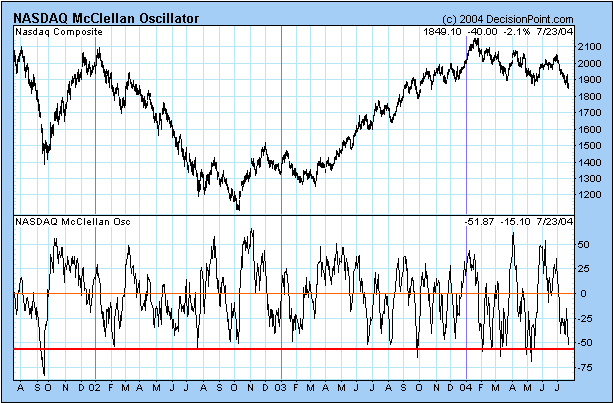
We've noted in previous commentaries over the past few months that the
NYSE McClellan Oscillator (MO) is not a reliable indicator these days
because more than half the stocks on the NYSE are interest rate plays
and therefore tend to move in same direction as the bond market each
day. The NASDAQ MO, however, still appears to be a useful short-term
indicator on those occasions when it reaches an extreme.
The below chart shows that the NASDAQ MO is getting close to a level
from which rallies have invariably materialised in the past. What this
means is that if the market were weak enough during the next few days
to take the NASDAQ MO down to around -60 then a 2-4 week rally would
become a likely prospect. A more bearish outcome, however, would be
some strength during the first half of this week to work-off the
oversold condition.
A longer-term
indicator worth paying attention to is the % of NYSE stocks above their
200-day exponential moving average (see chart below). Drops to 20% by
this indicator have coincided with major lows over the past few years.
We expect that the
stock market will continue to make lower lows between now and the
September-October period (when an intermediate-term bottom is likely).
We wouldn't be surprised, though, if there were an intervening rebound
in the stock indices beginning from at, or just below, their May lows.
The May lows for the S&P500 and the Dow Industrials are 1076 and
9852, respectively, versus Friday's closing levels of 1086 and
9962.
This week's
important US economic events
| Date |
Description |
| Monday Jul 26 |
Start of Democratic National Convention
|
| Tuesday Jul 27 |
Consumer Confidence
|
| Wednesday Jul 28 |
Durable Goods Orders
|
| Thursday Jul 29 |
End of Democratic National Convention |
| Friday Jul 30 |
Q2 GDP (preliminary)
|
Gold and
the Dollar
Currency Update
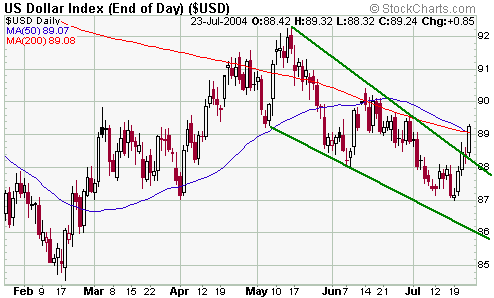
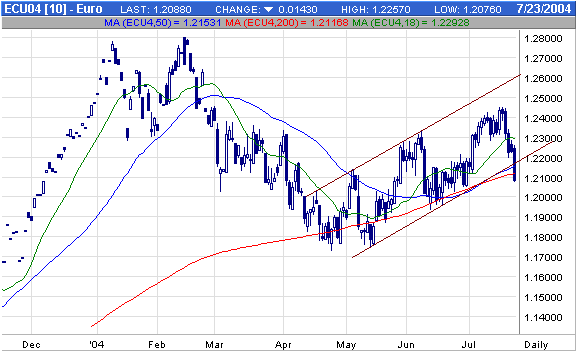
In last week's Interim Update we noted that the euro's break below
support was a sign that the dollar had already bottomed, but that the
Dollar Index had not yet displayed enough strength to convince us of
this. In particular, we mentioned that it remained below its 50-day MA
and that Wednesday's rebound had halted at the short-term trend-line.
Friday's upward move in the US$ has, however, shifted the odds firmly
in favour of a bottom being in place. For example, the Dollar Index's
short-term downtrend has been decisively breached and the euro has
dropped below the bottom of its upward-sloping channel (see charts
below). The Dollar Index also managed a marginal close above its 50-
and 200-day moving averages at the end of last week.
Our intermediate-term
target for the Dollar Index over the past 2 months has been 100 and
last week's action suggests that a rally to around this level has
begun. This doesn't mean, though, that it's onward and upward for the
US dollar from here because even if our view is on the mark there will,
of course, by pullbacks along the way. In fact, we would not be
surprised if last week's obvious confirmation of strength in the buck
was followed, in fairly short order, by a 1-2 week pullback. What it
does mean is that the dollar should now start making higher lows and
higher highs.
On a side note, when a market makes a sizeable move in one direction it
prompts commentators to come up with 'reasons' for the price move.
These reasons will often be wrong, but as long as the price continues
to move in that direction the reasons will look right. So if the Dollar
Index works its way up to our target of 100 over the coming 6 months be
aware that a bunch of fundamental 'reasons' will be concocted to
explain the rally and most of these explanations won't be realistic.
For example, it's a fair bet that strong US productivity growth and
real economic growth will be trumpeted in some quarters as reasons for
a dollar rally, but such explanations should be ignored unless there is
a dramatic change in the structure of the US economy over the next few
months. Another explanation that might emerge revolves around the idea
that US consumer debt represents a massive short position on the dollar
and that the dollar is experiencing a short-covering rally due to US
households paying back their debts. This explanation won't make any
sense, though, unless the total supply of credit happens to be
contracting at the time (you can't have a short-covering rally when the
short position is expanding).
As mentioned in previous commentaries, if a dollar rally does unfold as
per our expectations then it will most likely be driven by technical
factors, sentiment, central bank intervention, and the unwinding of
carry trades and other short-term trades that were based on the
perception that US interest rates were going to remain low indefinitely.
Gold Stocks
Alternatives
There are always a myriad of possibilities for each of the financial
markets, but if we tried to present most of these possibilities at TSI,
or even just a few of them, many of our readers would either be
confused or would get the impression that we were trying to hedge our
bets. Therefore, although we are always considering many different
possible outcomes we usually only present what we see as the most
likely outcome in these commentaries. Occasionally, though, we feel
that by far the best approach is to run the risk of creating confusion
and present two or three different scenarios. Now is one of those times.
In the latest Interim Update we showed that seasonal/cyclical
influences pointed towards a November low for gold stocks. However, the
speed of the recent decline in the AMEX Gold BUGS Index (the HUI has
fallen by around 10% over the past 10 trading days) forces us to
discuss two other possible outcomes.
First, the speed of the recent decline in the HUI from its rebound peak
actually opens up the possibility that October-November will be a high
rather than a low. This is because fast declines are invariably short
declines. A November low, on the other hand, would require a lengthy
(3-4 month) downward move from the recent peak. The bottom line is that
if there were enough near-term weakness in the gold stocks to take the
HUI back to the vicinity of its May low within the coming week or so
then we would potentially have a set-up for a powerful rally into the
October-November period. This would be a more bearish pattern from a
longer-term perspective, but would obviously be welcomed by gold-stock
investors who were eager to reduce their exposure to the sector.
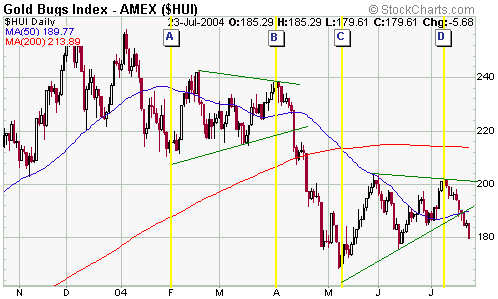
Second, with reference to the below chart of the HUI note that:
a) The rebound in the
HUI from its May low to its July peak (point C to point D) was almost
identical to the February-March rebound (point A to point B) in terms
of time, and was very similar in terms of price action.
b) The time between the HUI's peak at the beginning of April and its May low (B to C) was 26 trading days.
The current decline is 10 trading days old, so if the similarities to
the February-May period persist then a bottom will occur after 16 more
trading days (mid August). This would, in all likelihood, be the
ultimate correction low (the low that preceded the next major upward
leg in the gold-stock bull market).
We still favour the
"November low" scenario discussed in the Interim Update because it
meshes with our expectations for the US dollar and the broad stock
market, but if the HUI drops back to near its May low within the coming
1-2 weeks we will need to give more serious consideration to the
above-described alternatives.
The HUI/gold ratio
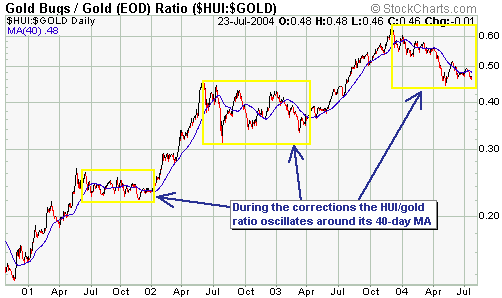
Below is a chart showing the HUI/gold ratio and its 40-day moving
average from the beginning of the gold-stock bull market to the present
day. The chart shows that a) HUI/gold has remained above its 40-day MA
during the upward legs with pullbacks finding support at this moving
average, and b) during the major corrections HUI/gold tends to
oscillate around its 40-day MA.
Belated confirmation that a new upward leg was in progress would
therefore be provided by HUI/gold moving above its 40-day MA, dropping
back to 'test' this moving average, and then moving to a new recovery
high. However, we will hopefully have identified the new upward leg
well before this technical confirmation occurs.
What to do?
During a long-term bull market you should endeavour to do most of your
buying into weakness and most of your selling into strength.
Right now is not a good time to be selling and, in fact, many of the
gold stocks we follow and all of the gold stocks in the TSI List look
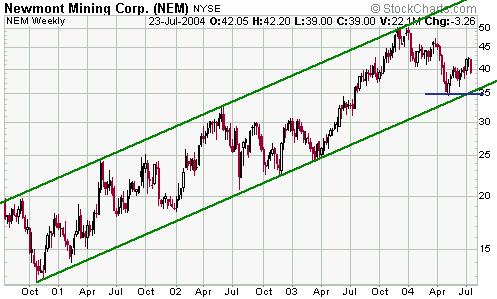
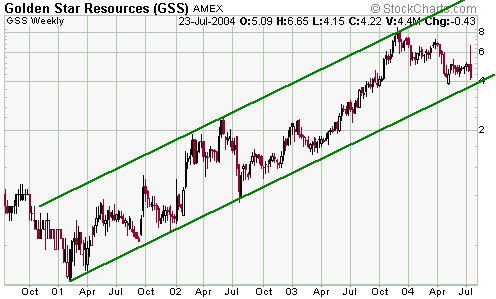
like strong buys from a valuation perspective. Furthermore, many gold
stocks are within 10% of long-term technical support levels. For
example, the below weekly charts of Newmont Mining and Golden Star
Resources show that these high-profile stocks ended last week about 10%
above the bottoms of their long-term price channels.
Most gold stocks are probably going to trade below current levels at
some point over the next 4 months, but the longer-term outlook is
extremely bullish. Anyone who has taken our advice to maintain
substantial cash reserves this year should therefore be looking forward
to more short-term weakness as an opportunity to add to existing
positions, or to purchase new positions, in a sector of the market that
has enormous profit potential over the coming few years. There was a
great buying opportunity in May and there will probably be another
great buying opportunity soon (perhaps as soon as the coming fortnight
but almost certainly within the coming 4 months).
Hedging your exposure
In the latest Interim Update we discussed Newmont Mining put options as
a way of hedging a gold stock portfolio. It shouldn't be necessary to
buy puts for insurance purposes if you have substantial cash reserves,
but for someone who is light on cash and heavy on gold stocks it might
be an appropriate tactic. Unfortunately, the market didn't provide much
of an opportunity to buy NEM put options at attractive prices following
the Interim Update because NEM was up a little on Thursday but then
tanked on Friday.
Buying some NEM September or December $35 put options into any strength
over the coming few days would be something to consider if your gold
stock exposure was causing you to lose sleep, but as a standalone trade
we much prefer the Phelps Dodge (PD) October $60 put options
recommended two weeks ago at TSI. This is because we perceive
considerably more downside risk in the industrial metals and the stocks
of industrial metal producers than we do in gold and gold stocks. In
particular, in the case of a large-scale terrorist attack in the US or
Europe -- a possibility that needs to be seriously considered --
gold-related investments would probably move sharply higher while
copper-related investments would most likely plunge (refer to the 2001
chart shown earlier in today's report). Also, from a technical
perspective NEM appears to be much closer to a correction low than does
PD.
Current Market Situation
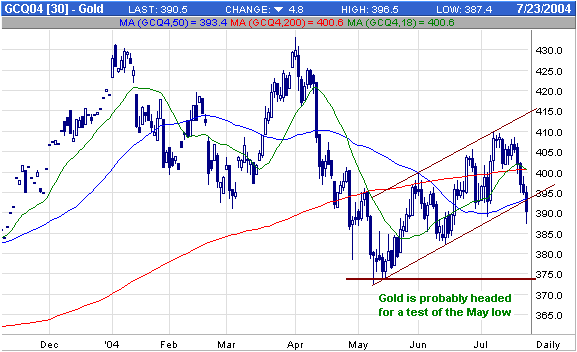
Gold broke below the bottom of its short-term channel on Friday (see
chart of August gold futures below), indicating that a test of the May
low will probably occur within the next few weeks. Judging by the
Commitments of Traders data and the performance of gold stocks relative
to the metal, there didn't seem to be much speculative enthusiasm in
the gold market when the gold price was near its peak earlier this
month. Therefore, we don't think there is significant downside risk
beyond the May low.
Copper
Weakness in the US$ from
mid May through to mid July contributed to the rebound in the copper
price over this period, but if the dollar has turned higher on an
intermediate-term basis then the copper market is now facing a
substantial headwind. In fact, if the dollar has just bottomed then the
2-month rebound in the copper price most likely peaked about one week
ago.
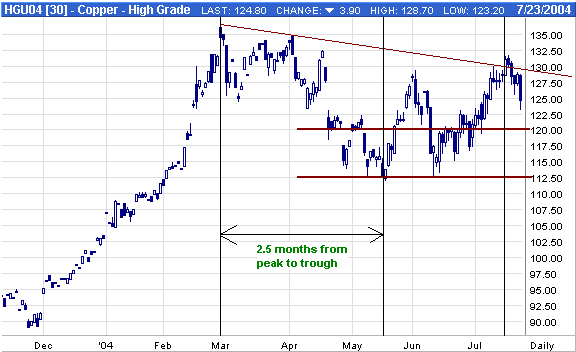
The below daily chart of September copper futures shows the support
that exists at 120 and at the 112.50 'double bottom'. We've also noted,
on the chart, that the initial decline in copper's correction lasted
2.5 months. If the second, and most likely final, decline also lasts
2.5 months then copper will bottom in early October. Interestingly,
this would mesh with our view that the stock market is going to
experience substantial weakness between now and October because a big
slide in equities would lead to economic growth expectations being
ramped down and this would, in turn, prompt speculators to anticipate
less demand for copper.
Update
on Stock Selections
 The
story, at the moment, is a market story, with positive developments in
individual stocks generally being overridden by the market-wide
downward pressure. The
story, at the moment, is a market story, with positive developments in
individual stocks generally being overridden by the market-wide
downward pressure.
Chart Sources
Charts appearing in today's commentary
are courtesy of:
http://stockcharts.com/index.html
http://www.futuresource.com/
http://www.decisionpoint.com/

|

