|
-- Weekly Market Update for the Week Commencing 26th August 2013
Big Picture
View
Here is a summary of our big picture
view of the markets. Note that our short-term views may differ from our
big picture view.
In nominal dollar terms, the BULL market in US Treasury Bonds
that began in the early 1980s will end by 2013. In real (gold)
terms, bonds commenced a secular BEAR market in 2001 that will continue
until 2014-2020. (Last
update: 23 January 2012)
The stock market, as represented by the S&P500 Index,
commenced
a secular BEAR market during the first quarter of 2000, where "secular
bear market" is defined as a long-term downward trend in valuations
(P/E ratios, etc.) and gold-denominated prices. This secular trend will bottom sometime between 2014 and 2020.
(Last update: 22 October 2007)
A secular BEAR market in the Dollar
began during the final quarter of 2000 and ended in July of 2008. This
secular bear market will be followed by a multi-year period of range
trading.
(Last
update: 09 February 2009)
Gold commenced a
secular bull market relative to all fiat currencies, the CRB Index,
bonds and most stock market indices during 1999-2001.
This secular trend will peak sometime between 2014 and 2020.
(Last update: 22 October 2007)
Commodities,
as represented by the Continuous Commodity Index (CCI), commenced a
secular BULL market in 2001 in nominal dollar terms. The first major
upward leg in this bull market ended during the first half of 2008, but
a long-term peak won't occur until 2014-2020. In real (gold) terms,
commodities commenced a secular BEAR market in 2001 that will continue
until 2014-2020.
(Last
update: 09 February 2009)
Copyright
Reminder
The commentaries that appear at TSI
may not be distributed, in full or in part, without our written permission.
In particular, please note that the posting of extracts from TSI commentaries
at other web sites or providing links to TSI commentaries at other web
sites (for example, at discussion boards) without our written permission
is prohibited.
We reserve the right to immediately
terminate the subscription of any TSI subscriber who distributes the TSI
commentaries without our written permission.
Outlook Summary
Market
|
Short-Term
(1-3 month)
|
Intermediate-Term
(6-12 month)
|
Long-Term
(2-5 Year)
|
|
Gold
|
Bullish
(17-Oct-12)
|
Bullish
(26-Mar-12)
|
Bullish
|
|
US$ (Dollar Index)
|
Neutral
(24-Dec-12)
|
Bullish
(01-May-13)
|
Neutral
(19-Sep-07)
|
|
Bonds (US T-Bond)
|
Bullish
(24-Jun-13)
|
Neutral
(18-Jan-12)
|
Bearish |
|
Stock Market
(DJW)
|
Bearish
(15-Jul-13)
|
Bearish
(28-Nov-11)
|
Bearish
|
|
Gold Stocks
(HUI)
|
Bullish
(24-Dec-12)
|
Bullish
(23-Jun-10)
|
Bullish
|
|
Oil |
Neutral
(30-Jul-12)
|
Neutral
(31-Jan-11)
|
Bullish
|
|
Industrial Metals
(GYX)
|
Neutral
(30-Jul-12)
|
Neutral
(29-Aug-11)
|
Neutral
(11-Jan-10)
|
Notes:
1. In those cases where we have been able to identify the commentary in
which the most recent outlook change occurred we've put the date of the
commentary below the current outlook.
2. "Neutral", in the above table, means that we either don't have a
firm opinion or that we think risk and reward are roughly in balance with respect to the timeframe in question.
3. Long-term views are determined almost completely by fundamentals,
intermediate-term views by
fundamentals, sentiment and technicals, and short-term views by sentiment and
technicals.
T-Bond Update
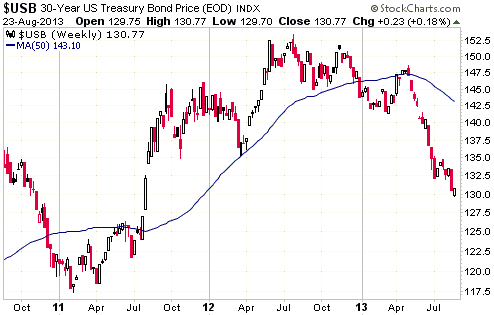
The following weekly chart shows that the US
T-Bond made a new 2-year low last week before recovering to end the week with a
small gain. This could perhaps be construed as a minor positive, but the trading
range was too narrow for the upward reversal to be significant. At this stage,
therefore, the T-Bond remains sufficiently 'oversold' to create a short-term and
an intermediate-term price low, but the price action is yet to indicate that a
low is in place.
The next weekly chart shows the yield difference between the 10-year T-Note and
the 10-year TIPS, a quantity that we refer to as the "Expected CPI". The
Expected CPI is a measure of the bond market's inflation expectations.
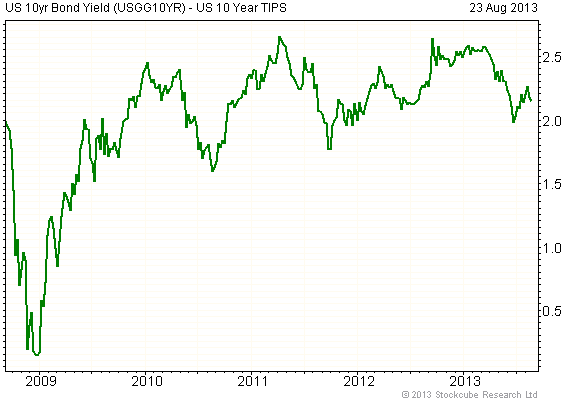
Chart Source:
http://www.fullermoney.com/
As mentioned in previous commentaries, the most remarkable aspect of this year's
decline in the T-Bond price (rise in the T-Bond yield) is that it has been
accompanied by a decline in inflation expectations. This is unusual to the point
of being unprecedented, given that the expected level of "price inflation" is by
far the most important driver of long-term interest rates.
Normally, a multi-month decline in inflation expectations would go with falling
long-term interest rates, but this year's decline in inflation expectations has
gone with a substantial rise in long-term interest rates. The explanation that
long-term interest rates have risen in anticipation of stronger real growth is a
non-starter because real growth leads to a rise in the purchasing power of the
currency and should be accompanied by lower, not higher, yields on default-free
government bonds.
The most reasonable explanation of this year's unusual relationship between the
T-Bond and inflation expectations is that the Fed's machinations had pushed bond
yields so far below where they would otherwise be that the anticipation of
reduced Fed intervention caused yields to rise despite a decline in the expected
level of price inflation.
A reduction in the level of the Fed's bond market intervention will probably
become a reality before the end of this year, but a major bear market in the
T-Bond will certainly require a large rise in inflation expectations. The reason
is that in the absence of higher inflation expectations, a 4%+ T-Bond yield (the
current yield is 3.8%) will look very attractive to many large investors after
it becomes apparent that the stock market has peaked.
The Stock
Market
The misunderstood relationship between
the stock market and long-term interest rates
Last week we used the chart displayed below to help make the point that the US
stock market entered a secular decline in 2000 and that the decline is probably
not complete. Our argument was that long-term equity trends are determined by
valuations rather than nominal prices, and that the US stock market's overall
valuation commenced a major decline in 2000 (as evidenced by the blue line on
the chart). This week we are using the same chart to make the point that there
is NOT a consistent historical relationship between equity valuations and
long-term interest rates (the red line on the chart).
The conventional wisdom holds that, over the long haul, rising equity valuations
go with declining long-term interest rates and falling equity valuations go with
rising long-term interest rates. The popular "Fed
Model" is predicated on this line of thinking. But as is often the case, the
conventional wisdom is wrong.
The widespread belief that equity valuations and long-term interest rates are
inversely correlated arose because, as shown by the following chart, they were
inversely correlated from 1966 through to 2000. Consequently, if you were
analysing the relationship during the 1990s and you didn't look at what happened
prior to the mid-1960s, you would naturally come to the conclusion that such a
correlation existed. In addition, the idea that rising long-term interest rates
will generally go with declining equity valuations and that falling long-term
interest rates will generally go with rising equity valuations seems reasonable
at a superficial level. However, the inverse correlation has not existed since
2000 and did not exist prior to 1966.
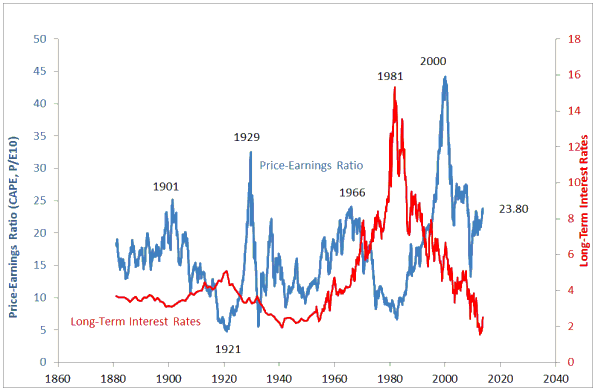
Chart Source:
http://www.irrationalexuberance.com/index.htm
To demonstrate the absence of a consistent correlation between equity valuations
and long-term interest rates, we cite these facts:
First, here's what happened during the last three long-term equity bull markets:
a) The 1921-1929 equity bull market began at a HIGH long-term interest rate and
occurred in parallel with a DOWNWARD-trending long-term interest rate (meaning:
NEGATIVE correlation between equity valuations and long-term interest rates).
b) The 1942-1966 equity bull market began at a LOW long-term interest rate and
occurred in parallel with an UPWARD-trending long-term interest rate (meaning:
POSITIVE correlation between equity valuations and long-term interest rates).
c) The 1982-2000 equity bull market began at a HIGH long-term interest rate and
occurred in parallel with a DOWNWARD-trending long-term interest rate (meaning:
NEGATIVE correlation between equity valuations and long-term interest rates).
And here's what happened during the last three long-term equity bear markets:
a) The 1929-1942 equity bear market began at a MODERATE long-term interest rate
and occurred in parallel with a DOWNWARD-trending long-term interest rate
(meaning: POSITIVE correlation between equity valuations and long-term interest
rates).
b) The 1966-1982 equity bear market began at a MODERATE long-term interest rate
and occurred in parallel with an UPWARD-trending long-term interest rate
(meaning: NEGATIVE correlation between equity valuations and long-term interest
rates).
c) The 2000-20?? equity bear market began at a MODERATE long-term interest rate
and up until now has occurred in parallel with a DOWNWARD-trending long-term
interest rate (meaning: POSITIVE correlation between equity valuations and
long-term interest rates).
To summarise the above: Over the past 90 years, major US stock-market trends
were inversely correlated with long-term interest rates about half the time.
That is, there was no consistent correlation.
The bottom line is that the major trend in the long-term interest rate does NOT
determine the major trend in the stock market. Regardless of the interest-rate
backdrop, long-term equity bull markets begin when equity valuations are very
low and end when equity valuations are very high, and long-term equity bear
markets begin when equity valuations are very high and end when equity
valuations are very low.
Current Market Situation
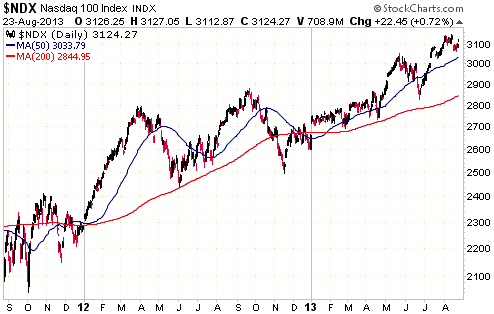
Going by the NASDAQ100 Index (NDX), all that happened this month is a minor
hesitation within a continuing short-term upward trend. As illustrated by the
following daily chart, the NDX is still close to its high for the year and
didn't even reach its 50-day MA during this month's pullback.
Going by the Dow Industrials Index, a correction of at least short-term
significance is in progress. As illustrated by the following daily chart, the
Dow has clearly breeched its 50-day MA.
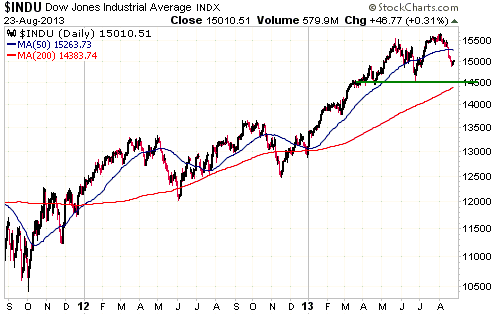
Due to its relative weakness, the Dow will probably be the first of the senior
US stock indices to generate a bear-market warning signal by breaking decisively
below its June low (14,500). Looking from a different angle, as long as the Dow
(the weakest senior index) manages to hold above its June low it will be
premature to conclude that a bear market has begun.
There is currently no evidence that anything more than a short-term top is in
place, although our guess is that a major topping process is underway. Gold's
rebound lends some credence to this guess.
This week's
important US economic events
| Date |
Description |
| Monday Aug 26 |
Durable Goods Orders
Dallas Fed Mfg Survey | | Tuesday
Aug 27 |
Case-Shiller HPI
Richmond Fed Mfg Index
Consumer Confidence | | Wednesday
Aug 28 |
Pending Home Sales Index | | Thursday
Aug 29 |
Q2 GDP (revised)
|
| Friday Aug 30 |
Personal Income and Spending
Chicago PMI
Consumer Sentiment |
Gold and
the Dollar
Gold
Meaningful price trends in the gold market are not driven by Chinese housewives
or US retail coin collectors or Indian wedding-season buyers. They are driven by
large speculators and investors trading in anticipation of, or in reaction to,
macro-economic, monetary and financial-market developments. The general
assessment of the issues that drive the investment/speculative demand for gold
will not always be correct, but it is what it is. For example, the main driver
of the gold-price decline during the first half of this year was the increasing
popularity of the view that a) central-bank monetary stimulus had set the
economy on a self-sustaining growth path without causing an inflation problem,
and b) a new secular bull market in equities had begun. We are confident that
this assessment is wrong, but right or wrong it clearly had a material adverse
effect on the total demand for gold.
A major shift is probably now happening, with equities in a topping pattern and
gold in a bottoming pattern. But just as it took more than 12 months for the
belief in the return of economic/monetary stability to gain the upper hand, it
will take time for the majority of market participants to embrace a different
reality. Therefore, it is unrealistic to expect that the gold rebound of the
past two months will continue to build upward momentum over the months
immediately ahead. It's far more likely that there will be a short-term top
within the next three weeks followed by at least 1-2 months of 'backing and
filling'. The 'backing and filling' could encompass a test of the June low
during October or November.
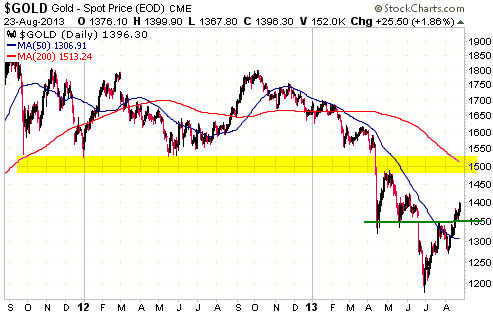
With regard to a likely level for the next short-term price peak in the gold
market, we've had the $1400-$1530 range in mind for a while. That the bottom of
this range has already been reached (last Friday's high was $1399.90) improves
the chances of getting to near the top of the range during the first half of
September, but the main point we want to make right now is that it isn't
realistic to expect gold to do any better than rise to the low-$1500s within the
next three months. So, we suggest that you ignore the far more bullish
short-term targets that will undoubtedly get bandied about if the gold price
breaks decisively into the $1400s in the near future.
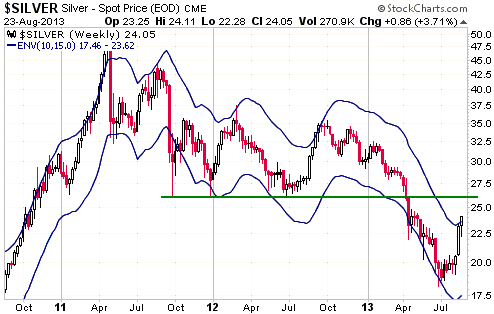
Silver
The following weekly chart contains a moving average envelope that under normal
circumstances limits silver's upside and downside. Once a meaningful silver
rebound was signaled, the top of this MA envelope became a high-probability
short-term target. This target was slightly exceeded last week.
With silver now slightly above the top of its MA envelope and short-term
'overbought' by some measures, the best of this particular rally is probably
behind us. There is a possibility that resistance at $26 will be tested before
the next sizeable price decline gets underway, but $26 for silver should be
viewed similarly to $1530 for gold; that is, it should be interpreted as a level
that defines the MAXIMUM short-term upside potential.
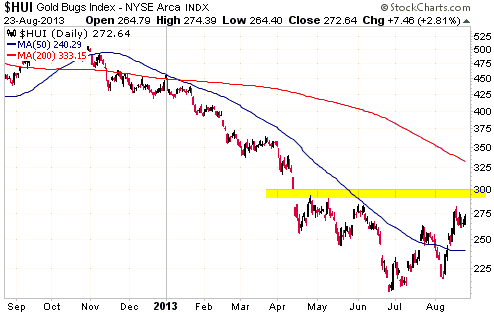
Gold Stocks
On the negative side of the ledger, there was a minor bearish divergence between
the bullion market and the HUI over the past six trading days, with the bullion
making new multi-month highs and the HUI consolidating below its 15th August
high. On the positive side of the ledger, the 1968-1970 model points to strength
in the gold sector over the coming three weeks.
As is usually the case, we do not have a strong opinion on what the markets will
do over the next few weeks. What we do know is that we would view significant
additional strength between now and mid-September as a short-term selling
opportunity.
Currency Market Update
The currency market has been uneventful over the past three weeks, with the
Dollar Index consolidating just below its 200-day MA. This consolidation
improves the odds of a spike to a new 6-month low within the next couple of
weeks.
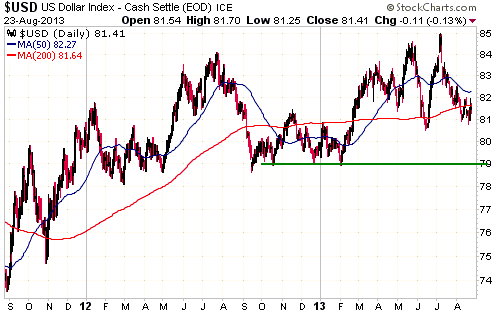
As evidenced by the COT data and Market Vane's sentiment survey, speculators, as
a group, have remained positive about the US dollar's prospects throughout the
Dollar Index's decline from its June high. This is probably why the Dollar Index
hasn't yet reversed upward. It simply hasn't become 'oversold' in a meaningful
way, despite having trended downward for two months. A genuine 'oversold'
condition is not necessarily required for a tradable rally to commence, but it
would certainly help.
Fed-related confusion has no doubt contributed to the reluctance of speculators
to switch from the US$-bullish camp to the US$-bearish camp. Neither the
currency market nor the Fed itself can figure out when and by how much the
monetary accommodation will be "tapered". Nobody knows what's going to happen on
the monetary front, because the Fed's actions are -- by the central bank's own
admission -- data dependent, and nobody knows what the economic numbers are
going to be during the few weeks leading up to the next FOMC meeting.
It's ridiculous and sad that much of what happens in the financial markets these
days revolves around traders trying to guess what central bankers are going to
do and central bankers trying to guess how traders will react to the actions and
words of central bankers. Long gone are the days when interest rates provided
accurate signals about the economy-wide propensities to save and consume.
Update
on Stock Selections
Notes: 1) To review the complete list of current TSI stock selections, logon at
http://www.speculative-investor.com/new/market_logon.asp
and then click on "Stock Selections" in the menu. When at the Stock
Selections page, click on a stock's symbol to bring-up an archive of
our comments on the stock in question. 2) The Small Stock Watch List is
located at http://www.speculative-investor.com/new/smallstockwatch.html
 Company
news/developments for the week ended Friday 23rd August 2013: Company
news/developments for the week ended Friday 23rd August 2013:
[Note: FS = Feasibility Study, IRR = Internal Rate of Return, MD&A =
Management Discussion and Analysis, M&I = Measured and Indicated,
NAV = Net Asset Value, NPV(X%) = Net Present Value using a discount
rate of X%, P&P = Proven and Probable, PEA = Preliminary Economic
Assessment, PFS = Pre-Feasibility Study]
*Carpathian Gold (CPN.TO): It was clear from the quarterly
financial reports issued by CPN during the week before last that
additional financing would soon be needed. We didn't have to wait
long for details of the additional financing, because a CPN press
release after the close of trading last Monday announced a "bought
deal" to raise $16M by issuing 114M new shares at the low price of
C$0.14/share.
$16M is probably enough to see the company through the next two
months, but CPN is not out of the woods. Depending on the time it
takes for the newly-constructed RDM gold mine (Brazil) to get to the
point where it is adding cash to the company's balance sheet, it's
possible that more money will have to be raised in the
not-too-distant future. However, with this $16M equity financing in
place it should be possible for CPN to obtain additional funds by
expanding its debt rather than its equity, thus avoiding further
dilution to the stakes of current shareholders.
The equity financing announced last week is due to close on 5th
September.
*Clifton Star (CFO.V) reported the final set of results from the
2013 drilling program at its Duparquet gold project (Quebec). The
results should enable in-pit resources to be upgraded and could
enable the overall resource to be increased. The most significant
results came from drill holes BD13-23 (2.46 g/t Au over 18.5 m),
BD13-27 (1.14 g/t Au over 72.0 m) and BD13-34 (2.27 g/t over 15m),
the reason being that these holes have potentially expanded the west
pit shell.
CFO also advised that it is waiting for the results of Pilot Plant
tests carried out to evaluate and compare the POX (Pressure
Oxidization) flow sheet as used in the Duparquet project's PEA and
the potential to produce saleable gold concentrates as an
alternative process. These test results will be important in
assessing the economic viability of the project.
As we noted last week, CFO is a reasonable speculation at C$0.30 or
lower. As also noted last week, the main short-term risk is that the
company only has a few million dollars in the bank and will have to
seek additional financing within the next 6 months.
*Pretium Resources (PVG) is topping up its treasury by issuing
1.5M "flow-through" shares at C$10.10 per share. This financing is
not significant.
*Sabina Gold and Silver (SBB.TO) announced results from on-going
drilling at the Back River project's George Property. As usual for
Back River there were several eye-catching gold intercepts within
the results, including 24.96 g/t Au over 11.25m in drill hole
13GRL152. However, we don't know how these latest results will
affect the overall project resource.
The next resource update is scheduled for Q1-2014. Prior to that we
get the next look at the project economics via the PFS scheduled for
mid-October.
Candidates
for new buying
The relatively low-risk/high-quality junior gold stocks that we've suggested for
new buying over the past several weeks have rallied far enough and fast enough
that even though they remain very under-valued based on what we expect to happen
over the coming year, they are no longer in short-term 'buy zones'. Significant
additional price gains are certainly possible over the coming three weeks, but
better buying opportunities will probably arise during October-November.
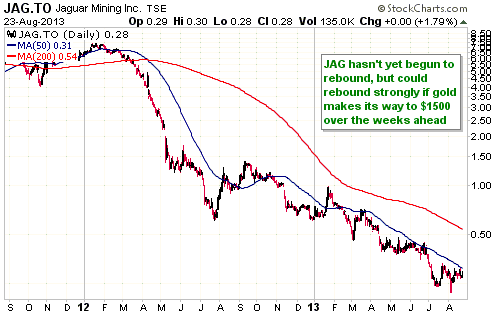
For those prepared to take a lot of risk in exchange for substantial short-term
reward potential, Jaguar Mining (TSX: JAG, US OTC: JAGGF) could be of interest.
JAG is in a very precarious financial position, but it could quickly double or
more in price from its current ultra-depressed level of $0.28 due to receding
fear of bankruptcy if gold rises to around $1500/oz.
Short-term
price targets and candidates for partial selling
Refer to the 19th August Weekly Update for chart-based short-term price targets
for the TSI stocks that have rebounded strongly over the past few weeks. Some
stocks have tested initial resistance levels, but the potential exists for
higher levels to be tested by mid-September.
Our only additional comments at this time are:
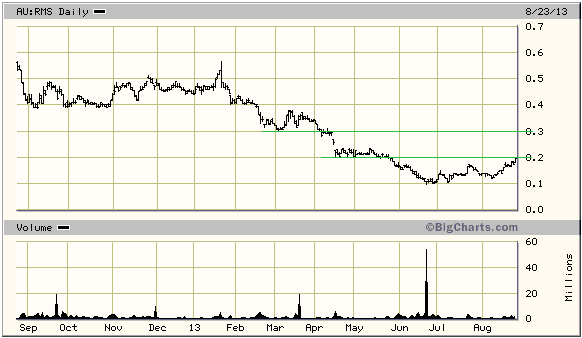
1) Ramelius Resources (RMS.AX) was strong last week and is now testing initial
resistance at A$0.20. This stock's next significant resistance level -- and a
realistic short-term objective if the sector-wide rally continues for 2-3 more
weeks -- is A$0.30.
RMS is extremely under-valued at A$0.20 and will still be extremely under-valued
if gets to A$0.30 in the near future, but if, like us, you were a buyer near the
recent low of A$0.10 then you could reasonably decide to take some profits on
these low-priced purchases into the current strength.
2) As well as a long-term position in EDV.TO, the TSI Stocks List contains a
short-term EDV position that was added two months ago in anticipation of a
rebound to around C$1.00. For TSI record purposes, this short-term position will
be exited if the stock trades at C$0.97. It ended last week at C$0.89.
Fading
Barrick
The strategic decision-makers at Barrick Gold (ABX) have demonstrated an amazing
ability to buy high and sell low. In fact, you could have made a fortune over
the past 13 years by simply doing the opposite of what ABX's top strategists
were doing. As evidence, we point out that they: a) decided to make a
substantial investment in oil production in mid-2008, with the oil price near a
long-term peak; b) decided to make a substantial investment in copper production
in early 2011, with the copper price near a long-term peak; and c) maintained a
huge gold short position (they called it a "hedge position") during the first
ten years of gold's bull market and then spent several billion dollars to unwind
this position. Continuing the pattern, they have just sold 450K ounces/year of
gold production in the world's best country for mining (Australia) to Gold
Fields Ltd. (GFI) for the incredibly low price of $300M.
ABX's loss is GFI's gain. GFI was a reasonable long-term speculation prior to
last week's ABX deal and now looks very good, especially since the market's
initial reaction to the deal was to dump GFI shares.
With this purchase of assets from ABX, GFI's annual gold production will
increase from 1.85M to 2.3M ounces and its average production cost should fall.
Furthermore, its per-ounce valuation and its political risk profile will
improve. With regard to the latter, the ABX deal will result in GFI's production
being geographically spread as follows: 42% from Australia, 34% from Ghana, 13%
from Peru and 11% from South Africa. This means that only 11% of the company's
production will come from a high-risk country.
GFI and Kinross Gold (KGC) now have similar valuations. GFI has the advantage of
lower political risk, but KGC has a stronger balance sheet (GFI will have net
debt of $1.95B after the ABX deal is completed, whereas KGC has approximately
zero net debt) and a lower average production cost. GFI has greater leverage to
changes in the gold price, which could be an advantage or a disadvantage
depending on gold's price trend.
It would be reasonable to begin averaging into GFI shares, but for TSI record
purposes we are going to obtain exposure to the stock via long-dated call
options. Specifically, we have added the January-2015 US$7.00 GFI call option to
the TSI List at Friday's closing price of US$0.84.
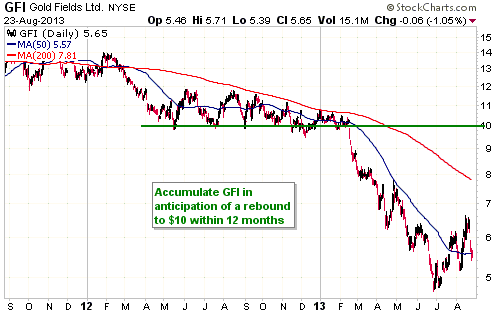
Chart Sources
Charts appearing in today's commentary
are courtesy of:
http://stockcharts.com/index.html
http://bigcharts.marketwatch.com/
http://www.fullermoney.com/

|
