|
-- Weekly Market Update for the Week Commencing 26th September 2011
Big Picture
View
Here is a summary of our big picture
view of the markets. Note that our short-term views may differ from our
big picture view.
In nominal dollar terms, the BULL market in US Treasury Bonds
that began in the early 1980s ended in December of 2008. In real (gold)
terms, bonds commenced a secular BEAR market in 2001 that will continue
until 2014-2020. (Last
update: 4 April 2011)
The stock market, as represented by the S&P500 Index, commenced
a secular BEAR market during the first quarter of 2000, where "secular
bear market" is defined as a long-term downward trend in valuations
(P/E ratios, etc.) and gold-denominated prices. This secular trend will bottom sometime between 2014 and 2020. (Last update: 22 October 2007)
A secular BEAR market in the Dollar
began during the final quarter of 2000 and ended in July of 2008. This
secular bear market will be followed by a multi-year period of range
trading. (Last
update: 09 February 2009)
Gold commenced a
secular bull market relative to all fiat currencies, the CRB Index,
bonds and most stock market indices during 1999-2001. This secular trend will peak sometime between 2014 and 2020. (Last update: 22 October 2007)
Commodities,
as represented by the Continuous Commodity Index (CCI), commenced a
secular BULL market in 2001 in nominal dollar terms. The first major
upward leg in this bull market ended during the first half of 2008, but
a long-term peak won't occur until 2014-2020. In real (gold) terms,
commodities commenced a secular BEAR market in 2001 that will continue
until 2014-2020. (Last
update: 09 February 2009)
Copyright
Reminder
The commentaries that appear at TSI
may not be distributed, in full or in part, without our written permission.
In particular, please note that the posting of extracts from TSI commentaries
at other web sites or providing links to TSI commentaries at other web
sites (for example, at discussion boards) without our written permission
is prohibited.
We reserve the right to immediately
terminate the subscription of any TSI subscriber who distributes the TSI
commentaries without our written permission.
Outlook Summary
Market
|
Short-Term
(0-3 month)
|
Intermediate-Term
(3-12 month)
|
Long-Term
(1-5 Year)
|
| Gold
|
Neutral
(22-Sep-11)
|
Neutral
(24-Jan-11)
|
Bullish
|
| US$ (Dollar Index)
|
Bullish
(07-Sep-11)
| Neutral
(10-Aug-11)
|
Neutral
(19-Sep-07)
|
| Bonds (US T-Bond)
|
Neutral
(19-Sep-11)
|
Bearish
(24-Aug-11)
|
Bearish
|
| Stock Market (S&P500)
|
Bearish
(19-Sep-11)
|
Neutral
(24-Aug-11)
|
Bearish
|
| Gold Stocks
(HUI)
|
Neutral
(22-Sep-11)
|
Bullish
(23-Jun-10)
|
Bullish
|
| Oil | Neutral
(31-Jan-11) | Neutral
(31-Jan-11)
| Bullish
|
| Industrial Metals
(GYX)
| Bearish
(19-Sep-11)
| Neutral
(29-Aug-11)
| Neutral
(11-Jan-10)
|
Notes:
1. In those cases where we have been able to identify the commentary in
which the most recent outlook change occurred we've put the date of the
commentary below the current outlook.
2. "Neutral", in the above table, means that we either don't have a
firm opinion or that we think risk and reward are roughly in balance with respect to the timeframe in question.
3. Long-term views are determined almost completely by fundamentals,
intermediate-term views by giving an approximately equal weighting to
fundamental and technical factors, and short-term views almost
completely by technicals.
Summing up
The following paragraph was included in the email that we sent to TSI subscribers in response to last Thursday's market action. It is a reasonable summary of our short-term expectations and trading approach.
"Gold, silver, gold and silver mining stocks, stock indices such as the S&P500 and commodity indices such as the CCI will probably reach short-term bottoms within the next three weeks, and the short-term bottoms in these markets will probably coincide with short-term peaks in the Dollar Index and the T-Bond. Our guess is that the short-term extremes won't be far from Thursday's closing prices, but it's important not to have preconceived opinions as to where the next significant turning point will occur. It makes sense to buy into panic, but don't make the mistake of committing too heavily too soon based on the notion that prices can't go much lower. Always remember that the market is only rational on a long-term basis. On a short-term basis it regularly behaves as if it is clinically insane."
We now know that in some cases the ultimate extreme will be far from Thursday's closing price. Silver, for example, has already fallen a long way below its Thursday close. However, the speed at which markets moved late last week increases the probability that short-term extremes will be put in place within the next three weeks. We suggest that you do not have any set-in-stone opinions as to the price levels at which these short-term extremes will occur.
Humans are hard-wired to
be poor investors
Barry Ritholtz posted an article
last week about how our brains are wired in a way that often makes us do, or at least causes us to have a strong desire to do, the opposite of what a good investor would do. Consequently, being a successful investor often requires acting counter to one's in-built tendencies.
There was nothing new to us in the article, but we still found it interesting and useful. Here are some excerpts:
"Humans have a tendency to see order in randomness. We find patterns where none exist. While that trait might have helped a baby recognize its parents (thereby improving the odds for its survival), seeing patterns where none exist is counter-productive when it comes to investing.
We also selectively perceive data, hoping to find something that confirms our prior views. We ignore data that contradicts those prior views. We even reinterpret old evidence so it is more in sync with our perspective. Then, we only selectively remember those things that support our case."...
..."If all of human history were a day long, then investing is only about two seconds old. Is it any surprise that most humans do it so poorly? The vast majority of human history has been spent learning to survive, not analyze P/E ratios.
Learning to fight nature wont be easy. To outperform, you sometimes must go against the crowd, despite the appeal and seeming safety in numbers. You must be humble and willing to admit error; meaning youll have to overcome your ego's predisposition to avoid embarrassment, so as to maintain status amongst your tribe (and thereby enhance survival probabilities)."
T-Bond Update
Does the T-Bond market qualify as a bubble?
Based on our hazy view of the future, the T-Bond's current valuation is well into bubble territory. However, an objective analysis indicates that sentiment towards T-Bonds is not consistent with what would typically be seen near the peak of an investment bubble. For evidence we cite the following facts:
1. The percentage of household financial assets allocated to long-dated Treasury securities reached a multi-decade LOW in 2007, and at around 2% is still near the bottom of its long-term range.
2. The proportion of commercial bank assets allocated to Treasury and Agency securities is presently about 13%. Perhaps this seems high, but be aware that the proportion was around 40% in the 1950s.
3. At the T-Bond's blow-off top in December of 2008, Market Vane's bullish consensus peaked at 90% for T-Notes and 92% for T-Bonds. These are high levels, but well below the 97% bullish percentage achieved by silver when it was peaking in April of this year and the 98% bullish percentage achieved by the Swiss Franc when it was peaking last month. On Tuesday of last week (the date of our most recent data), Market Vane's bullish consensus was only 74% for T-Notes and 78% for T-Bonds.
4. The latest COT report shows that speculators were net-SHORT the combination of T-Note and T-Bond futures to the tune of 140K contracts as at 20th September. In other words, the most recent COT data suggest that speculators, as a group, are moderately bearish on long-dated Treasury securities.
There is no rule that enthusiasm for an investment must reach bubble proportions before the investment enters a bear market. We simply wanted to explain that sentiment currently isn't a good reason to forecast a bear market in T-Bonds.
Current Market Situation
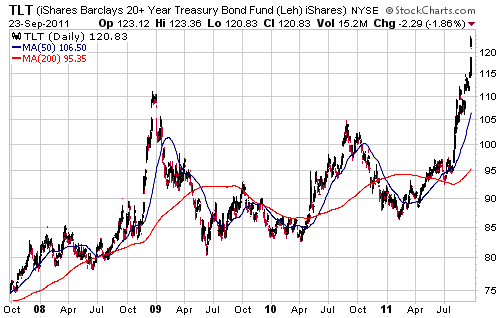
The following daily chart shows the near-vertical rise in the 20+ Year Treasury ETF (TLT) over the past two months. This price action and Friday's downward reversal suggest that some sort of peak was just put in place in response to the combination of stock market weakness, fears about European debt default and the Fed's plan to "twist" bond yields downward.
We expect that TLT will be a lot lower by this time next year, but we have no opinion on whether an intermediate-term peak is already in place. There is simply no basis for such an opinion. By some measures TLT is as 'overbought' as it was at the December-2008 peak, but if the monetary flight from Europe continues then it could easily make new highs within the next three months.
More often than not over the past 5 years we have been short- and/or intermediate-term bearish on the T-Bond, but during this period we have not lost a single dollar betting against the T-Bond. This is because we try to avoid speculating in markets where we don't have a competitive advantage. If we are routinely too bullish or too bearish on a market then we can be sure that we do not have a competitive advantage in that
market.
The Stock
Market
Gaming the Fed
Event A: The official statement issued at the conclusion of last week's FOMC Meeting indicated that the Fed had become more bearish about the US economy's prospects.
Event B: The US stock market plunged in the aftermath of the Fed's statement.
The mainstream financial media tends to operate on the basis that if Event A is followed by Event B, then Event A must have caused Event B. But in reality, there is often no causal relationship between the two events.
We seriously doubt that the economic-growth outlook of any well-heeled speculator would be swayed by the Fed's forecasts. The market's problem isn't that the Fed has become more bearish. Rather, the problem is the reality of an economy in recession and valuations that are only attractive if you make the unrealistic assumption that profit margins will not mean-revert this time around as they have always done in the past. There are definitely pockets of under-valuation in the market, but valuations are far from low on a market-wide basis.
Furthermore, it is clear that the stock market was rolling over prior to the Fed's announcement. The S&P500 Index had risen for 5 days in a row prior to the start of last week, leaving it slightly 'overbought' and just below resistance. This set the stage for what was to come.
Having said all that, the Fed's Wednesday announcement most likely did have some effect; just not for the commonly cited reason. Some traders were undoubtedly betting that the combination of obvious economic deterioration in the US and the debt crisis in Europe would prompt the Fed to initiate a new round of money pumping. When the Fed failed to announce specific plans to generate more monetary inflation ("Operation Twist" is not directly inflationary), these traders would have exited.
The bottom line is that evidence of increasing economic pessimism on the part of the Fed is not a plausible reason for last week's market action. If anything, a pessimistic Fed is bullish for nominal equity prices because the more pessimistic the Fed the more likely it is to resort to inflationary policies. A new round of inflationary policies will unfortunately come, but not as soon as some traders were expecting.
Current Market Situation
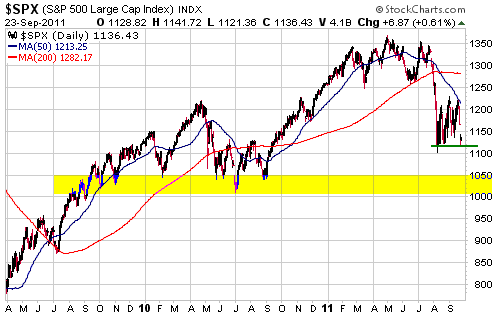
The S&P500 Index successfully tested its August low on Friday, leaving open the possibility that the recent action could be part of a bottoming process. However, the speed with which the market fell after reaching resistance the week before last and the fact that we are still in September (intermediate-term declines that begin during May-August often don't end until October) suggest that the odds are now in favour of the August low being breached prior to the start of the next tradable rally. In the mean time, a routine bounce would take the S&P500 up to 1150-1170.
If the August low is taken out, the most plausible short-term downside target would be support at 1000-1050.
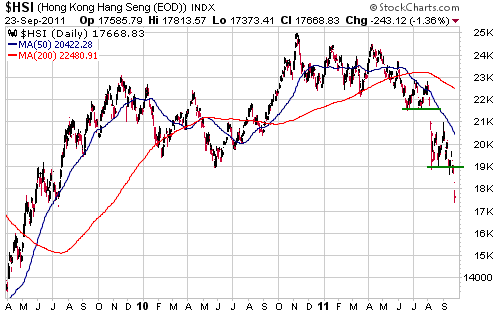
The view that the odds are now in favour of the S&P500 breaching its August low is supported by the performance of Hong Kong's Hang Seng Index (HSI). The following chart shows that the HSI, which often leads at important turning points, broke decisively to new lows last week.
If the S&P500 drops to a new low for the year within the next few weeks, it will be interesting to see if the move is confirmed by the NASDAQ100 Index (NDX), the High-Yield Bond ETF (JNK), and the gold/GYX ratio (gold relative to industrial metals).
This week's
important US economic events
| Date |
Description |
| Monday Sep 26 | New
Home Sales
| | Tuesday Sep 27 | Consumer
Confidence
Case-Shiller Home Price Index | | Wednesday
Sep 28 | Durable Goods Orders | | Thursday
Sep 29 | Q2 GDP (2nd revision)
Pending Home Sales
| | Friday Sep 30 | Personal
Income and Spending
Consumer Sentiment
Chicago PMI
|
Gold and
the Dollar
Gold
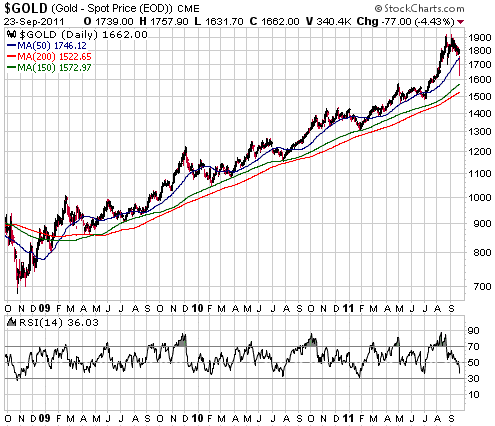
The nearest gold futures contract fell $77 on Friday and at one point during the day was down by more than $100, but the risk parameters haven't changed. We still think that the area around the 200-day moving average (the low-$1500s) defines the maximum downside risk for this correction.
While the 200-day moving average probably defines the maximum downside risk, the following daily chart suggests that the 150-day moving average is now the most likely target for a correction low. With reference to this chart, notice that every significant correction since April of 2009 has bottomed at the 150-day moving average (the green line). Also notice that over the past three years a decline in the daily RSI(14) to the low-30s has always coincided with a good short-term buying opportunity.
Interestingly, the 150-day moving average is not far from lateral support defined by the early-May peak.
For a sensible discussion about the increases in gold, silver and copper margins that will be imposed by the CME on Monday 26th September, go to the article posted
HERE. However, don't bother reading this article if you are totally committed to the view that the margin hikes are part of a conspiracy to suppress prices.
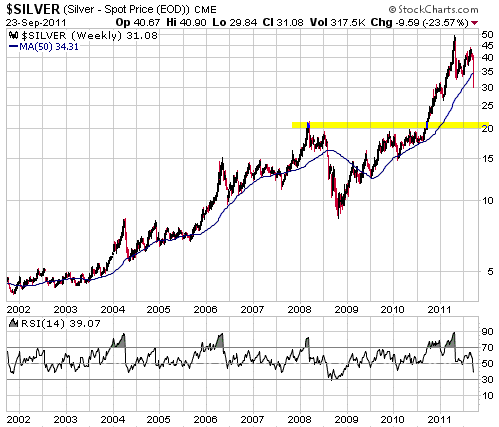
Silver
Since the early days of silver's correction we've thought that a decline to the 200-day moving average was inevitable prior to the start of the next intermediate-term advance. Also, during June-July we noted that no intermediate-term bottom in the silver market over the past 10 years had occurred before the silver price dropped at least as far as its 50-week moving average AND silver's weekly RSI dropped to 45 or lower. Thanks to last week's market action this minimum criteria for a correction low is now in place.
However, it's not like things have gone according to plan. The fact is that the market still managed to confound us by stretching out its post-crash rebound for longer than originally expected and rebounding to a higher level than originally expected. Additional uncertainty was created by gold's sustained advance to well above its early-May high. Due largely to gold's performance we came to doubt that silver would ever drop below, or even re-test, its May low, which we had originally expected it would do following a post-crash rebound.
The current situation is illustrated by the weekly chart displayed below. The top section of the chart shows that silver has moved well below its 50-week moving average and its May low, and the bottom section shows that the weekly RSI has fallen to 39. The only time over the past 10 years when the weekly RSI was significantly lower than it is right now was during the second half of 2008, when it momentarily dipped below 30.
Next up we have a weekly chart of the silver/gold ratio. The ratio reached an overbought extreme in April and is now close to an oversold extreme.
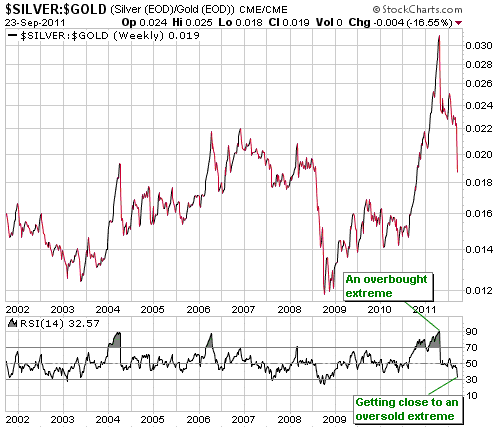
The above charts suggest that both silver and the silver/gold ratio are close to intermediate-term lows, at least in terms of time.
We continue to believe that silver's maximum downside risk is to the low-$20s. We also believe that whatever low is put in place over the next few weeks will be THE correction low.
The "Fundamentals"
We occasionally read analyses containing a message along the lines of: The market can't possibly do such-and-such because the "fundamentals" are too bullish or too bearish. For the following reasons, this message never fails to amuse us:
1. Short-term market movements are usually driven more by sentiment than fundamentals. Consequently, it is not uncommon for large price moves to run counter to the fundamentals.
2. Intelligent people often disagree about the "fundamentals", and anyone who takes the position that their understanding of the fundamentals is 100% complete and correct is a financial accident looking for a place to happen.
3. Major commodity tops occur in parallel with bullish fundamentals and major commodity bottoms occur in parallel with bearish fundamentals. The reason is that commodities only ever reach major price extremes when the fundamentals are so obviously bullish (for price tops) or bearish (for price bottoms) that almost everyone 'gets it'.
4. Fundamentals must be considered in relation to price. For example, it could be argued that silver's fundamentals were bullish at $50/oz in late April of this year, but they were no more bullish at this time than they had been 9 months earlier when the price was below $20/oz. To put it another way, at some level the fundamentals will be more than fully discounted by the current price.
Gold Stocks
It turned out that the XAU's failure to confirm the HUI's early-September upside breakout was important. We now know that the HUI's breakout was a 'fakeout'.
The following charts show that the HUI and the XAU plunged during the second half of last week, with the XAU making a new low for the year on Friday. The correction that began back in December of 2010 is therefore still in progress and a traditional October-November low appears to be on the cards. Buying gold stocks following a multi-month decline into the October-November timeframe is one of the surest ways to make money in the financial markets. At least, it has always worked that way over the past 10 years.
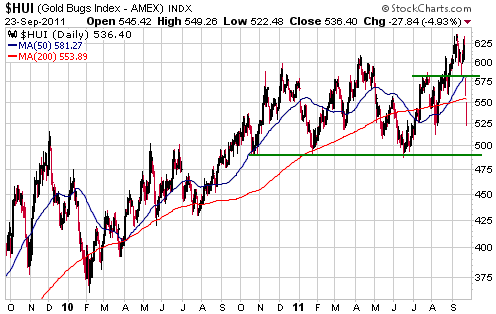
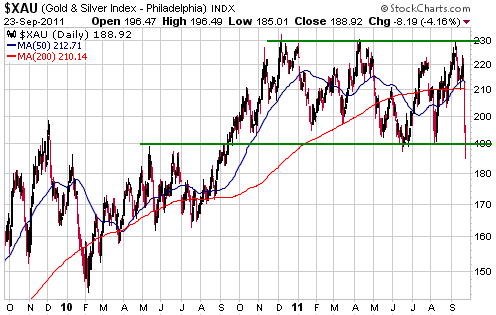
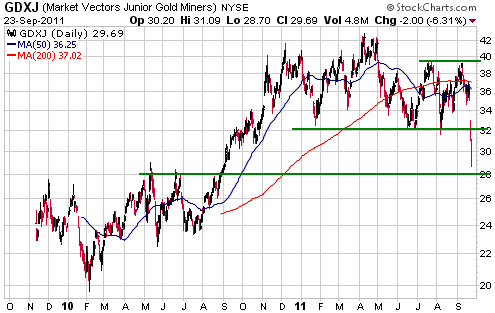
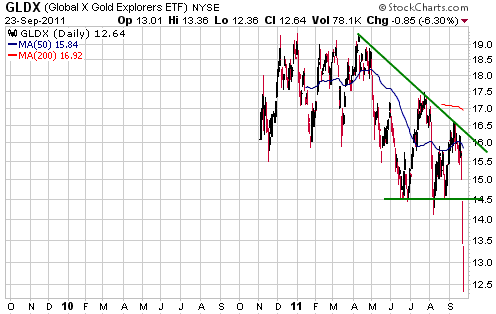
Although they contain some mid-tier miners, the HUI and the XAU mainly represent the stocks of senior gold miners. The seniors have generally done better than the juniors over the past several months, which is why the GDXJ and GLDX charts displayed below reveal much greater weakness than the HUI and XAU charts displayed above.
The recent collapse in GLDX, an ETF that holds exploration-stage gold mining stocks, has created a buying opportunity. If we wanted to avoid the trouble of selecting and monitoring individual gold mining stocks, we would now be scaling into
GLDX.
The best time to buy inflation plays is during a deflation scare. That's when you'll get the best value.
We put about 15% of our cash reserve to work last Thursday-Friday via purchases of gold, silver, copper, oil and gas stocks (inflation plays). This is the most buying we've done in a short period since October-November of 2008.
Some commodity stocks probably bottomed late last week, while many others probably won't hit their lows until October-November. Having just done a significant amount of buying, our intention is to step back from the fray for a while and watch how things develop. It's important to pace yourself.
Currency Market Update
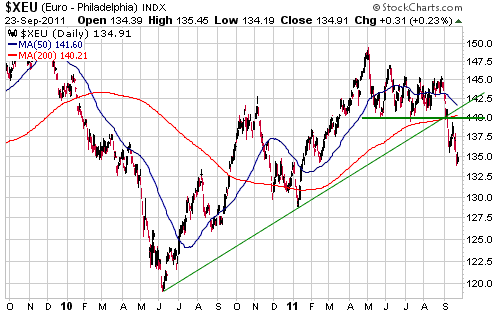
As illustrated below, the euro has clearly broken out to the downside. However, the surprise to us is that it isn't a lot weaker. Considering everything that's happening (the euro-zone's sovereign debt crisis, major problems with European banks, the flight of dollars from Europe to the perceived relative safety of the US), we are surprised that the euro is still holding in the mid-1.30s.
The euro is probably headed much lower, but we can't be confident about the timing. Our view is that currency speculators should take advantage of any near-term euro strength to establish, or add to, positions that would benefit from a decline in this currency.
Update
on Stock Selections
Notes: 1) To review the complete list of current TSI stock selections, logon at
http://www.speculative-investor.com/new/market_logon.asp
and then click on "Stock Selections" in the menu. When at the Stock
Selections page, click on a stock's symbol to bring-up an archive of
our comments on the stock in question. 2) The Small Stock Watch List is
located at http://www.speculative-investor.com/new/smallstockwatch.html
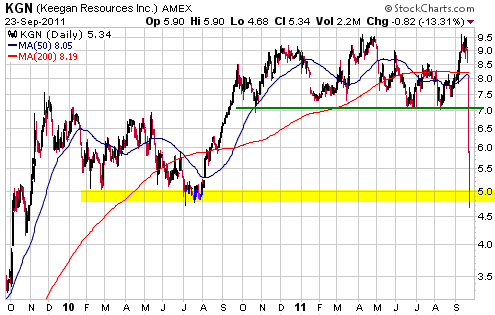
 Keegan Resources (TSX: KGN, AMEX: KGN). Shares: 75M issued, 81M fully diluted. Recent price: US$5.34 Keegan Resources (TSX: KGN, AMEX: KGN). Shares: 75M issued, 81M fully diluted. Recent price: US$5.34
Unfortunately, KGN has joined the long line of development-stage mining companies that have reported large increases in the estimated costs to build and/or operate a gold mine. KGN's new cost estimates were included in the Pre-Feasibility Study (PFS) for its Ghana-based Esaase project, the results of which were announced prior to the start of trading last Thursday. In a nutshell, here is the problem:
- April-2010 Preliminary Economic Assessment (PEA): $344M capex and cash operating cost of $486/oz.
- September-2011 PFS: $506M capex and cash operating cost of $693/oz.
The 47% increase in capex can be partly explained by the 30% increase in the Life-Of-Mine average production rate from 198K ounces/year to 258K ounces/year, although the new capex reflects problematic "inflation" after accounting for the higher production rate. The 42% increase in cash costs within the space of only 18 months is an even bigger problem.
The PFS was worse than expected and would have prompted a sizeable decline in KGN's stock price even if the news had been announced when the overall market was strong. However, the news was announced at the start of a 2-day collapse in the gold sector.
The overall market environment naturally magnified the effect of the news, but the 40% decline in KGN's stock price over the final two days of last week still qualifies as one of the biggest over-reactions we have ever seen. It was a panicked rush for the exit, with indiscriminate selling by 'investors' desperate to get out at any price and some forced margin selling thrown in for good measure.
The decline qualifies as a huge over-reaction because although the PFS was worse than expected, it still confirms that the Esaase project is economically viable. In particular, it reveals that Esaase has a net present value of almost $700M at a gold price of $1500/oz and a net present value of around $1B at a gold price of $1800/oz. This contrasts with KGN's current enterprise value of $188M and the enterprise value of $137M that the market was assigning to the company at Friday's low of US$4.68.
If we'd known what the PFS numbers were going to be then we would have exited KGN near its recent highs, but you can't play cards you haven't been dealt. As a result of last week's action, what we have been dealt is a very good opportunity to buy shares in a well-financed junior gold mining company (KGN has more than $200M in the bank) with an economically viable project in a relatively secure location. We took advantage of this opportunity on Friday by doubling our exposure to KGN at an average price of around US$5/share.
With reference to the following daily chart, Friday's intra-day spike below support at $4.75-$5.00 will probably turn out to have been the bottom or very close to it. Note, though, that the low of a news-related plunge will often be tested following a brief rebound.
Former support in the low-$7 area will now offer strong resistance and will probably cap the upside over the next few months.
Fairborne Energy (TSX: FEL). Shares: 102M issued, 109M fully diluted. Recent price: C$3.16
We haven't mentioned mid-tier natural gas producer FEL since April. The reason is that during the intervening period it never rallied enough to create a good selling opportunity and there were always better candidates for new buying. We are mentioning it now because it has just dropped back to major support near C$3.00. With the exception of a short period during the first quarter of 2009, FEL's price has never been significantly lower than it is right now.
The low level of FEL's stock price can be explained by the weakness of the broad stock market and the low level of the natural gas price. The natural gas market appears to be headed for a traditional September-October cyclical low and most oil-and-gas equities are likely to bottom out with the broad stock market during October. However, different equities will bottom at different times.
A good opportunity to scale into oil-and-gas producers such as FEL has arrived.
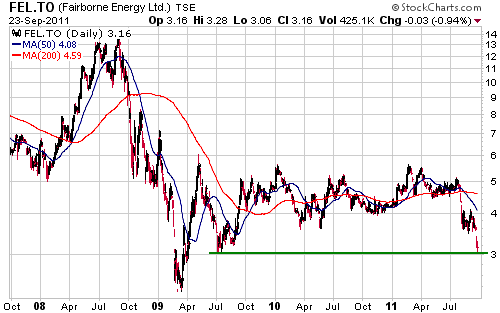
Chart Sources
Charts appearing in today's commentary
are courtesy of:
http://stockcharts.com/index.html

|
