|
-- Weekly Market Update for the Week Commencing 26th October 2009
Big Picture
View
Here is a summary of our big picture
view of the markets. Note that our short-term views may differ from our
big picture view.
In nominal dollar terms, the BULL market in US Treasury Bonds
that began in the early 1980s will end by mid-2010. In real (gold)
terms, bonds commenced a secular BEAR market in 2001 that will continue
until 2014-2020. (Last
update: 09 February 2009)
The stock market, as represented by the S&P500 Index, commenced
a secular BEAR market during the first quarter of 2000, where "secular
bear market" is defined as a long-term downward trend in valuations
(P/E ratios, etc.) and gold-denominated prices. This secular trend will bottom sometime between 2014 and 2020. (Last update: 22 October 2007)
A secular BEAR market in the Dollar
began during the final quarter of 2000 and ended in July of 2008. This
secular bear market will be followed by a multi-year period of range
trading. (Last
update: 09 February 2009)
Gold commenced a
secular bull market relative to all fiat currencies, the CRB Index,
bonds and most stock market indices during 1999-2001. This secular trend will peak sometime between 2014 and 2020. (Last update: 22 October 2007)
Commodities,
as represented by the Continuous Commodity Index (CCI), commenced a
secular BULL market in 2001 in nominal dollar terms. The first major
upward leg in this bull market ended during the first half of 2008, but
a long-term peak won't occur until 2014-2020. In real (gold) terms,
commodities commenced a secular BEAR market in 2001 that will continue
until 2014-2020. (Last
update: 09 February 2009)
Copyright
Reminder
The commentaries that appear at TSI
may not be distributed, in full or in part, without our written permission.
In particular, please note that the posting of extracts from TSI commentaries
at other web sites or providing links to TSI commentaries at other web
sites (for example, at discussion boards) without our written permission
is prohibited.
We reserve the right to immediately
terminate the subscription of any TSI subscriber who distributes the TSI
commentaries without our written permission.
Outlook Summary
Market
|
Short-Term
(0-3 month)
|
Intermediate-Term
(3-12 month)
|
Long-Term
(1-5 Year)
|
Gold
|
Bullish
(02-Sep-09)
|
Bullish
(12-May-08)
|
Bullish
|
US$ (Dollar Index)
|
Neutral
(28-Sep-09)
| Neutral
(02-Sep-09)
|
Neutral
(19-Sep-07)
|
Bonds (US T-Bond)
|
Neutral
(28-Sep-09)
|
Neutral
(09-Sep-09)
|
Bearish
|
Stock Market (S&P500)
|
Bearish
(21-Sep-09)
|
Bearish
(11-May-09)
|
Bearish
|
Gold Stocks (HUI)
|
Neutral
(20-May-09)
|
Neutral
(16-Sep-09)
|
Bullish
|
| Oil | Bullish
(14-Oct-09)
| Neutral
(14-Oct-09)
| Bullish
|
Industrial Metals (GYX)
| Bearish
(21-Sep-09)
| Bearish
(25-May-09)
| Bullish
|
Notes:
1. In those cases where we have been able to identify the commentary in
which the most recent outlook change occurred we've put the date of the
commentary below the current outlook.
2. "Neutral", in the above table, means that we either don't have a
firm opinion or that we think risk and reward are roughly in balance with respect to the timeframe in question.
3. Long-term views are determined almost completely by fundamentals,
intermediate-term views by giving an approximately equal weighting to
fundmental and technical factors, and short-term views almost
completely by technicals.
A mixture of inflation and deflation?
Despite what many
analysts/journalists seem to believe, an economy cannot simultaneously
experience inflation and deflation. And that's regardless of whether
inflation and deflation are defined in terms of money supply, credit
supply or purchasing power (the general price level). Saying that the
economy can simultaneously experience inflation and deflation is akin
to saying that the economy can grow at the same time as it is
shrinking. It is, in our opinion, the most illogical stance a person
could possibly take on the inflation/deflation issue.
People have undoubtedly been drawn to the idea that there is a mixture
of inflation and deflation by the reality that some prices are rising
while other prices are falling. However, regardless of whether the
overall economy is experiencing inflation or deflation it will almost
always be the case that some prices will be rising and other prices
will be falling. For example, regardless of whether inflation is
correctly defined as an increase in money supply or incorrectly defined
as a decrease in money purchasing power, there has been a lot of
inflation within the US economy over the past 15 years; and yet,
computer prices in the US have been in a downward trend throughout this
period. This doesn't mean that the US computer industry is experiencing
deflation; it means that the rate of productivity growth within the
computer industry has been high enough to more than offset the upward
pressure on prices stemming from inflation.
Our point, in a nutshell, is that inflation and deflation are mutually exclusive economy-wide phenomena.
On a related matter, there will sometimes be a mixture of inflationary
and deflationary FORCES within the economy. An example of a
deflationary force is excessive debt and the associated potential for
credit contraction. In fact, this is the only deflationary force of
real importance. An example of something that is NOT a deflationary
force, although it is often portrayed as such, is the downward pressure
on the prices of some goods resulting from increased productivity
(including the increased productivity of China's manufacturing
industry). The inflationary forces are private-sector debt expansion
via the banking industry, government-sector debt expansion via the
private banks and/or the central bank, central bank manipulation of
interest rates, the central bank's direct monetisation of assets, and
the actions taken by central banks to 'manage' currency exchange rates.
Over the past 15 months a battle has been raging between the
deflationary force of private-sector credit contraction and the
inflationary forces of government-sector credit expansion and central
bank monetisation. The inflationary forces are currently ascendant,
and, in our estimation, will remain so.
The Stock
Market
There probably won't be a
large decline in the US stock market within the next 6 months. Both the
1937-1942 Model and the Early-1980s Model discussed in last week's
Interim Update suggest that the upside potential from here is small,
but that the market will spend many months forming a top before it
establishes a clear downward trend. Also of significance is the
monetary backdrop. Having learnt the wrong lessons from both the
early-1930s collapse and the late-1930s relapse, Bernanke has all but
guaranteed that monetary conditions will remain accommodative --
meaning a near-zero funds rate target and the continuing monetisation
of debt securities -- for several more months.
The reason we are short- and intermediate-term bearish on the US stock
market isn't that we think a large decline is likely and imminent; it's
that we perceive small upside potential relative to downside risk. The
stock market has risen on the back of expectations that the worst is
behind the US economy and that global growth will be quite strong over
the years ahead, led by the "emerging markets". In our opinion, these
expectations will prove to be as wrong as they could possibly be,
resulting in most equity and industrial-commodity markets eventually
dropping back to their 2008-2009 lows in nominal currency terms and
plunging to new multi-decade lows in gold terms. This is the downside
potential; and although we don't expect that this downside potential
will come to the fore prior to the second half of next year, the risk
is that things will happen earlier/faster than we expect. It therefore
makes sense to be very cautious and to avoid getting caught up in the
'economic recovery illusion', but we don't think it makes sense to bet
heavily against the broad stock market at this time. To put it another
way: hedging is appropriate, but large speculative bearish bets are
not.
There's a good chance that the economic recovery theme will fall apart
shortly after the Fed and its central banking cohorts begin to remove
monetary support, which prompts the question: Why won't the Fed
maintain monetary support indefinitely?
Because the Fed's job is to inflate the money supply whilst keeping
inflation expectations in check. The second part of this job is very
important, the reason being that if inflation expectations get out of
hand then monetary inflation will become counter-productive (monetary
inflation always acts counter to real economic progress, but we are
referring, here, to the perspective of policymakers). Monetary
inflation can be used to fund promises, buy votes and channel wealth to
supporters up until the time that the masses wake up to what's
happening, at which point the monetary injections start to cause
immediate and disproportionately large increases in the WRONG prices
(the prices of gold and credit, for example). The central bank must
avoid this situation for as long as possible and at almost any cost.
This week's
important US economic events
| Date |
Description |
Monday Oct 26
| No important events scheduled
| | Tuesday Oct 27 | Case-Shiller Home Price Index
Consumer Confidence
| | Wednesday Oct 28
| Durable Goods Orders
New Home Sales
| | Thursday Oct 29
| Q3 GDP (prelim)
| | Friday Oct 30
| Personal Income and Spending
Employment Cost Index
Chicago PMI
Consumer Sentiment
|
Gold and
the Dollar
Gold
Gold's Fair Value
A well known gold-market analyst likes to calculate a "fair value" for
gold by assuming that the percentage change in the gold price should
approximate the percentage change in the money supply, which amounts to
applying the simplistic "Quantity Theory of Money" (QTM) to the gold
price. The reality, though, is that QTM creates a misleading picture of
how changes in the money supply affect prices. It should not be applied
to anything, including (especially) the gold market.
It is vitally important to understand that an X% increase in the money
supply will NOT lead to an across-the-board X% increase in prices. The
reason is that new money does not get evenly spread throughout the
economy; rather, it enters the economy at specific points and benefits
the first recipients at the expense of everyone else. Monetary
inflation is, in effect, a means for stealing and redistributing wealth
as opposed to a means for raising the average price level.
Due to the way it works, monetary inflation will lead to dramatic
increases in some prices while other prices barely rise or perhaps even
decline. The distortion of relative prices will, in turn, create major
economic problems, and once these problems start becoming evident to
the masses (including policymakers) the response will tend to be
twofold. First, policymakers will try to mitigate the problems caused
by monetary inflation by promoting even more monetary inflation.
Second, the public will attempt to increase its savings, but due to the
blatant efforts of policymakers to inflate their way out of the
economic morass created by prior inflation it will begin to dawn on
people that it is no longer prudent to save in terms of the official
currency. At this point gold could become the focal point of the
public's collective desire to save, resulting in a gold price that
bears absolutely no relationship to the growth in the money supply.
A "fair value" for gold can't be determined based on changes in money
supply, but the more general point is that there is no such thing as a
fair value for gold. The whole concept of a fair value for gold is
nonsensical, because value is subjective. If we had enough data we
could perhaps conclude that over extremely long periods of time the
gold price had tended to oscillate around a number determined by the
difference between the change in money supply and the change in gold
supply, but because the gold price has only been 'untethered' since
1971 we don't have anywhere near enough data to do such an analysis.
Furthermore, even if we had enough data to do the aforementioned
analysis it wouldn't lead us to a "fair value" for gold and it may not
tell us anything about gold's future (since the future is not just an
extrapolation of the past).
Although we shouldn't kid ourselves that it is somehow possible to
calculate gold's "fair value", history does give us some clues as to
what we can expect from gold over the coming decade. For example, the
previous two secular bear markets in US equities have taken the
Dow/Gold ratio down to 1, versus its current level of around 10.
Financial-market history therefore suggests that gold has additional
long-term upside potential of around 900% relative to the Dow
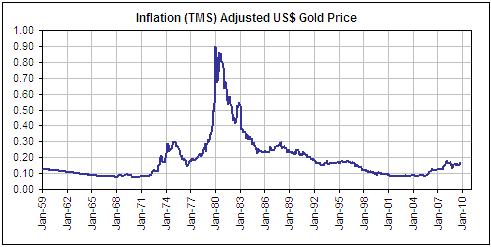
Industrials Index. For another example, the following chart shows that
the gold/TMS ratio (gold relative to the True Money Supply) was about
5-times higher at its January-1980 extreme than it is today.
Current Market Situation
Over the past 8 trading days the gold market has been consolidating in
bullish fashion in the $1045-$1070 range. It appears to be readying
itself for a move up to $1100.
Short-term support in the December contract lies at $1025.
On a short-term basis, silver is in a similar position to gold and will probably soon resume its advance.
Gold Stocks
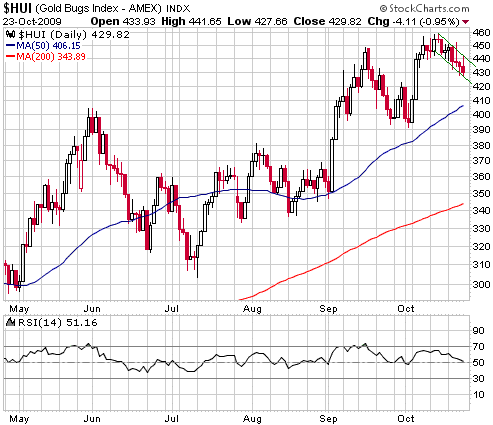
Like gold bullion, the AMEX Gold BUGS Index (HUI) has spent the past 8
trading days consolidating in bullish fashion. Our guess is that the
HUI will move up to around 475 within the next few weeks.
As we've mentioned
numerous times, the rallies in gold and gold stocks over the past
several months have had a lot more to do with US$ weakness than real
strength. This is evidenced by the fact that gold bullion and most of
the major gold stocks are yet to exceed their January-February highs in
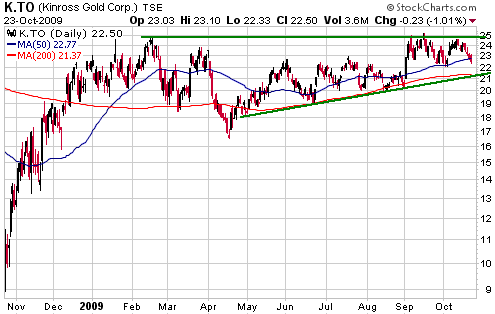
terms of currencies other than the US$. For example, the following
chart of the C$-denominated shares of Kinross Gold reveals a
February-2009 peak followed by about 8 months of consolidation.
The Kinross pattern is typical of what has occurred throughout the gold
sector when performance is measured in C$ terms. The gold sector is yet
to break out to the upside in terms of the Canadian currency, but the
chart looks bullish because the post-February price action appears to
be a base. The chart will retain a bullish tinge as long as K holds
above C$20.
A solid daily close above C$25 would create a measured objective of C$33-C$34.
Thanks to the
introduction of a new ETF, it will soon be possible for investors to
obtain diversified exposure to the junior end of the gold mining
universe without going to the trouble of selecting and following
individual companies. The junior gold mining ETF will be managed by Van
Eck Global and will trade in the US under the symbol GDXJ. The initial
38 components of GDXJ are listed HERE.
GDXJ will probably begin to trade within the coming two months. It
should be of interest to investors who want exposure to the part of the
stock market with the greatest long-term upside potential, but have
neither the time nor the expertise to analyse individual stocks. It
could also be a good trading vehicle, especially because it should be
liquid enough to enable the effective use of protective stops.
Whether or not it will be appropriate to purchase GDXJ as soon as it
begins to trade will be determined by the market situation at the
time.
Currency Market Update
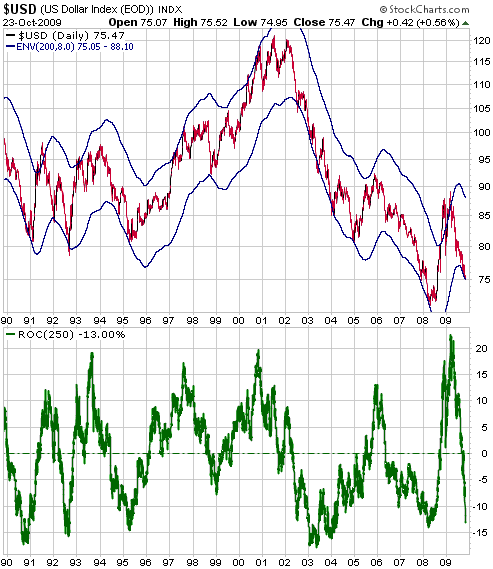
The following chart shows that the Dollar Index is now almost as
'oversold' as it ever gets. In particular, the chart shows that:
a) The Dollar Index has reached the bottom of a moving-average envelope
(the blue lines on the chart), and that every other time over the past
20 years when it reached a similar level it was close to at least a
short-term low.
b) The Dollar Index's 250-day rate-of-change (ROC) (the green line in
the bottom section of the chart) is about 2% from an extreme that, with
one exception, has always marked an intermediate-term bottom. The
exception was early-2003, when a drop by the 250-day ROC to -15% marked
only a short-term bottom.
As noted in an
earlier commentary, the main missing ingredient for a US$ bottom is a
stock market peak. The following chart shows the strong positive
correlation between the S&P500 Index and the euro, and thus
reflects the strong inverse relationship that presently exists between
the broad stock market and the Dollar Index.
It is quite possible
that a multi-month topping process in the broad stock market will
coincide with a multi-month bottoming process in the Dollar Index.
Update
on Stock Selections
(Note: To review the complete list of current TSI stock selections, logon at http://www.speculative-investor.com/new/market_logon.asp
and then click on "Stock Selections" in the menu. When at the Stock
Selections page, click on a stock's symbol to bring-up an archive of our comments on the stock in question)
 Endeavour Financial (TSX: EDV). Shares: 96M issued, 131M fully diluted. Recent price: C$2.01 Endeavour Financial (TSX: EDV). Shares: 96M issued, 131M fully diluted. Recent price: C$2.01
EDV gained 13% on Friday on high volume and is in the process of
breaking out from the base that has formed over the past 12 months. As
far as we can tell, Friday's surge was driven by news that the
previously-announced deal to acquire 54% of Etruscan Resources had been
completed.
Near Friday's closing
price of C$2.01, EDV is still a good candidate for new buying because
it remains very under-valued and is not technically 'overbought' on
even a short-term basis. We estimate that the company's net asset value
now exceeds C$3.00/share, so the stock is trading at a large discount
to the underlying assets. Moreover, EDV will still have almost $100M in
cash after paying for its Etruscan stake and is planning to use this
cash to do similar value-enhancing deals over the months ahead.
 The Canadian 'Gassy' Trusts The Canadian 'Gassy' Trusts
In the 16th September Interim Update we said that the Canadian
natgas-focused energy trusts included in the TSI Stocks List looked
like they had completed, or were about to complete, major bottoming
patterns. These bottoming patterns are now complete, thanks in part to
news last Thursday that state-owned Korea National Oil had agreed to
purchase Harvest Energy Trust (TSX: HTE.UN) at a 37% premium to its
market price at the time. This news lit a fire under the energy-trust
sector of the Canadian stock market.
We expect that the natural gas market will be very strong during the
first half of next year, mainly because by that time the large decline
in drilling activity that has occurred over the past year should be
having its maximum effect on production. However, we know from the
experience of the past 2 years that natgas producers are capable of
quickly boosting supply in response to rising prices. Also, we expect
that by mid-2010 the artificial economic rebound will have come to an
end. Our current plan is therefore to make a complete exit from our
'gassy' trusts and other natural gas positions by around May of next
year.
If the recent rally continues then an opportunity to begin the
scaling-out process, or to do some selling with the aim of buying back
following a pullback, could actually present itself within the next few
weeks. In particular, we would make partial exits from trusts that rise
sharply over the weeks ahead to near intermediate-term resistance
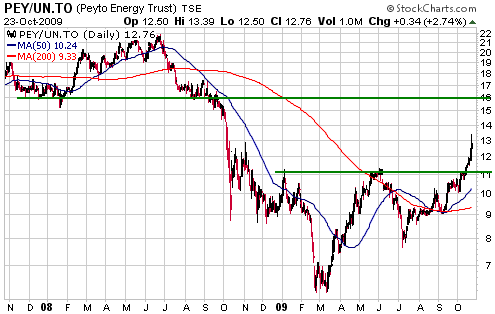
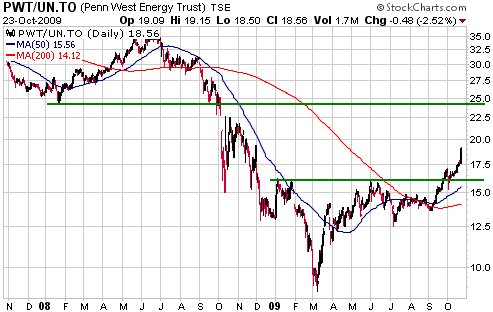
levels. For example, the following charts of Peyto Energy (TSX: PEY.UN)
and Penn West Energy (TSX: PWT.UN, NYSE: PWE) illustrate the recent
upside breakouts achieved by these trusts and the intermediate-term
resistance levels that lie at C$16 and C$24, respectively. Some selling
would be appropriate if these resistance levels were approached within
the next few weeks.
The one member of the
TSI Energy Trust Index (TETI) that looks suitable for new buying at
this time is Daylight Resources (TSX: DAY.UN). The following chart
shows that DAY has only just broken above the top of its base and is a
long way below intermediate-term resistance. Also of note is that DAY
is trading at a comparatively low valuation (we estimate that DAY is
presently being valued by the market at around $53,000 per BOE/d of
production, versus the $77,000 paid by Korea National for HTE) and has
a relatively secure yield of 10.4%.
Chart Sources
Charts appearing in today's commentary
are courtesy of:
http://stockcharts.com/index.html
http://www.futuresource.com/

|

