|
-- Weekly Market Update for the Week Commencing
27th January 2014
Big Picture
View
Here is a summary of our big picture
view of the markets. Note that our short-term views may differ from our
big picture view.
In nominal dollar terms, the BULL market in US Treasury Bonds
that began in the early 1980s ended in 2012. In real (gold)
terms, bonds commenced a secular BEAR market in 2001 that will continue
until 2018-2020. (Last
update: 20 January 2014)
The stock market, as represented by the S&P500 Index,
commenced
a secular BEAR market during the first quarter of 2000, where "secular
bear market" is defined as a long-term downward trend in valuations
(P/E ratios, etc.) and gold-denominated prices. This secular trend will bottom sometime between 2014 and 2020.
(Last update: 22 October 2007)
A secular BEAR market in the Dollar
began during the final quarter of 2000 and ended in July of 2008. This
secular bear market will be followed by a multi-year period of range
trading.
(Last
update: 09 February 2009)
Gold commenced a
secular bull market relative to all fiat currencies, the CRB Index,
bonds and most stock market indices during 1999-2001.
This secular trend will peak sometime between 2014 and 2020.
(Last update: 22 October 2007)
Commodities,
as represented by the Continuous Commodity Index (CCI), commenced a
secular BULL market in 2001 in nominal dollar terms. The first major
upward leg in this bull market ended during the first half of 2008, but
a long-term peak won't occur until 2014-2020. In real (gold) terms,
commodities commenced a secular BEAR market in 2001 that will continue
until 2014-2020.
(Last
update: 09 February 2009)
Copyright
Reminder
The commentaries that appear at TSI
may not be distributed, in full or in part, without our written permission.
In particular, please note that the posting of extracts from TSI commentaries
at other web sites or providing links to TSI commentaries at other web
sites (for example, at discussion boards) without our written permission
is prohibited.
We reserve the right to immediately
terminate the subscription of any TSI subscriber who distributes the TSI
commentaries without our written permission.
Outlook Summary
Market
|
Short-Term
(1-3 month)
|
Intermediate-Term
(6-12 month)
|
Long-Term
(2-5 Year)
|
|
Gold
|
Bullish
(13-Jan-14) |
Bullish
(26-Mar-12) |
Bullish
|
|
US$ (Dollar Index)
|
Neutral
(13-Jan-14) |
Bearish
(27-Jan-14) |
Neutral
(19-Sep-07) |
|
Bonds (US T-Bond)
|
Bullish
(11-Dec-13)
|
Neutral
(18-Jan-12)
|
Bearish |
|
Stock Market
(DJW)
|
Bearish
(13-Jan-14)
|
Bearish
(28-Nov-11) |
Bearish
|
|
Gold Stocks
(HUI)
|
Bullish
(13-Jan-14) |
Bullish
(23-Jun-10) |
Bullish
|
|
Oil |
Neutral
(30-Jul-12) |
Neutral
(31-Jan-11) |
Bullish
|
|
Industrial Metals
(GYX)
|
Bullish
(15-Jan-14) |
Neutral
(06-Jan-14) |
Neutral
(11-Jan-10) |
Notes:
1. In those cases where we have been able to identify the commentary in
which the most recent outlook change occurred we've put the date of the
commentary below the current outlook.
2. "Neutral", in the above table, means that we either don't have a
firm opinion or that we think risk and reward are roughly in balance with respect to the timeframe in question.
3. Long-term views are determined almost completely by fundamentals,
intermediate-term views by
fundamentals, sentiment and technicals, and short-term views by sentiment and
technicals.
Random thoughts about the
year ahead
1) The monetary backdrop continues to be
very different in the US today than it was in earlier post-bubble periods. This
is slowing the corrective process and introducing new price distortions that
will have to be 'resolved' via another devastating economic bust. When will they
ever learn?
2) Economic declines will become progressively more serious and economic
recoveries will become progressively weaker until there is wide recognition that
the central bank is a big part of the problem as opposed to part of the
solution.
3) At this time last year, we wrote: "It has become clear that the Fed's
policy of throwing new money at the economy in a horribly misguided effort to
generate real growth is not only going to continue in 2013, but also going to be
applied more aggressively than was the case in 2012. This money-pumping could
prevent widespread recognition of recessionary economic conditions for several
more months, but only at a substantial long-term cost. For an economy to
function efficiently, price signals must be genuine; that is, price signals must
accurately reflect sustainable consumption and production trends."
The Fed is now beginning to slow the pace of its money-pumping, but the damage
has been done. The seeds of the next economic bust have been sown.
4) The economic data will probably be OK during the first few months of 2014,
but if commercial-bank credit growth continues at its present slow pace then by
the third quarter of this year there will probably be enough stock market
weakness and enough signs of economic deterioration to prompt the Fed to step
away from its "tapering" plan.
5) At the beginning of 2013, we wrote: "China has huge economic problems, but
these problems will come to the fore gradually over the space of a few years and
won't likely be the cause of big moves in global financial markets during 2013."
The same statement applies to this year.
6) At the beginning of 2013 we thought that the euro-zone's government debt
disaster would return to "Page 1" during the second half of the year. It didn't.
Another euro-zone banking/debt crisis is inevitable, but there are currently no
signs that it is imminent. For example, the yield on 10-year Spanish government
bonds is near a 5-year low and the EURO STOXX Banks Index recently made a 2-year
high. We will monitor European bonds and bank shares in an effort to determine
the timing of the inevitable crisis. All we can say right now is that it
probably won't happen during the first half of 2014.
7) Last year we thought that unexpected weakness in the US economy was an
intermediate-term threat worthy of attention, but not one of the top three
risks. Unexpected weakness in the US economy is now one of the top three risks,
although it is a risk that probably won't materialise until the second half of
the year.
8) As 2013 got underway we considered greater instability in the Middle East to
be one of the biggest intermediate-term risks facing the financial markets. We
also thought that if this risk was going to materialise it was more likely to do
so during the second half than the first half of the year. Our reasoning was
that the US government (by far the greatest threat to world peace) would be more
inclined towards aggressive military intervention in the Middle East after it
became clear that the US economy had sunk into recession, something that was
unlikely to happen prior to the second half of 2013. To further explain,
governments tend to view external threats as useful distractions during periods
of economic weakness. Additionally, in a world dominated by "Keynesian"
policy-makers and political advisors, large-scale military action can be
perceived as a convenient excuse for more government spending and more monetary
inflation.
The threat that the pot of territorial disputes, religious hatreds, political
grievances and economic problems known as the Middle East will boil over is
ever-present. However, with a deal now in the works regarding Iran's nuclear
program, with the start of the next US recession still lying more than 6 months
into the future and with US mid-term elections scheduled for this November, the
next Middle East 'boil over' of global importance is probably not going to
happen in 2014.
9) Last year we wrote: "There's a new big intermediate-term risk facing the
financial world as 2013 gets underway: the risk that the government bond bubble
will burst. The bursting of the government bond bubble is a more pressing
concern today than it was, say, 6 months ago due to the immense political
pressure being put on the Bank of Japan (BOJ) to reduce the purchasing power of
the Yen."
The government bond bubble probably did burst last year, but the other financial
markets took the first phase of the new secular bond bear in stride.
Furthermore, despite the actions taken by the BOJ to bring about higher
"inflation" in Japan, the JGB market recovered from a sharp April-May sell-off
to end the year with a gain. That is, the JGB yield was lower at the end of the
year than at the start of the year.
Even though a secular bond bear has probably begun, for the reasons outlined in
our 20th January commentary we don't perceive much intermediate-term downside
risk for US Treasury bonds. In fact, we suspect that the T-Bond market will end
2014 with a gain.
There is a lot more risk in Japanese Government Bonds. This is mostly because
they have a much higher valuation (lower yield), but it is also because the JGB
market is much further along in its long-term topping process.
10) Due to the downward trend in the US monetary inflation rate and the
valuation-related downside potential in the US stock market, a US deflation
scare is a realistic possibility for the second half of the year.
11) For speculators in commodities and commodity-related equities it will be
much easier to make money on the 'long' side during 2014 than it was during 2012
and 2013. This is especially so for the year's first half (the second half could
contain a deflation scare) and for speculators in gold and gold-related
equities.
Commodities
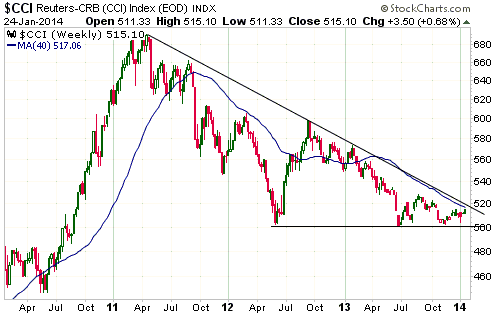
The Continuous Commodity Index (CCI), a proxy for
commodity prices, peaked during the first few months of 2011 and is only a few
percent above its 3-year low. The following weekly chart illustrates the
situation.
Clearly, there isn't yet any evidence that the commodity bear market has ended,
although all it would take to establish the first piece of evidence is a weekly
close above 520. In other words, all the CCI would have to do to provide a
preliminary signal of an important trend reversal in commodity prices is end a
week more than 1% above last week's close.
 The Stock
Market
The US Market
We never watch financial TV and spend only a small amount of time scanning the
daily news in the mainstream financial press, but we get the impression that
data pointing to an economic slowdown in China was the most popular explanation
for last week's swoon in the US stock market. This explanation makes no sense
whatsoever, because a) commodity markets (the markets most sensitive to changes
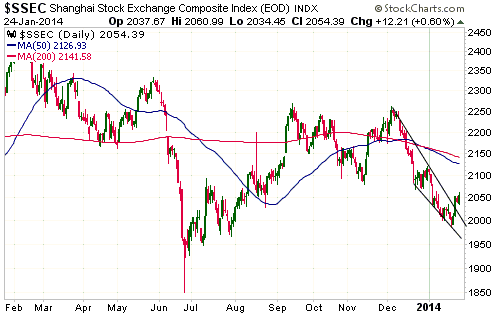
in China's economy) were stable, and b) the Shanghai Stock Exchange Index (SSEC)
gained some ground last week and achieved a mini upside breakout in the process
(see chart below). Although on an intermediate-term trend basis there is no
relationship between China's stock market and China's economic progress, fears
of a slowing Chinese economy would still be more likely to cause a short-term
decline in China's stock market than a short-term decline in the US stock
market.
If you want a plausible explanation for the decline in the US stock market late
last week, look no further than the simple fact that the market is very
'overbought' and in need of a correction.
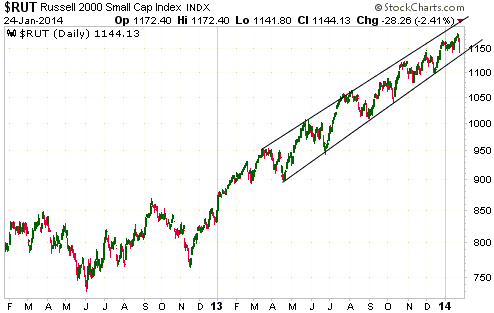
In any case, the weakness in the US stock indices is minor at this time. For
example, the following daily chart shows that the Russell2000 Small-Cap Index
remains within the steep, upward-sloping channel that has defined its progress
over the past year. However, that the Russell2000 and other high-profile indices
haven't YET fallen far from their highs is not a reason to be optimistic; it is
a reason to believe that if a correction worthy of the name has finally begun,
then it has a lot further to go.
The idea that a correction worthy of the name has finally begun applies to many
other stock markets around the world, including the stock markets of Germany and
Japan.
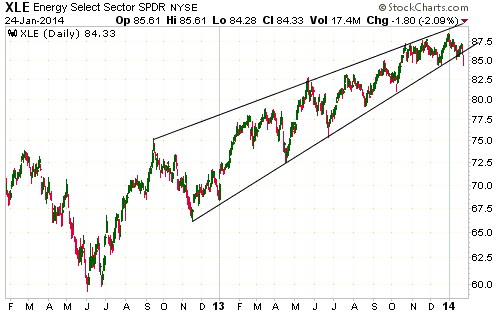
Oil stocks have been strong over the past 18 months relative to most other
commodity-related equities and have even managed to hold their own relative to
the S&P500 Index, but there are signs that they are shifting out of favour. One
sign is last Friday's downside breakout by XLE, an energy ETF dominated by oil
stocks, from a very well-defined chart pattern.
We are anticipating a relative-strength shift within the broad market towards
commodity-related equities, and a relative-strength shift within the commodity
sector from oil to metals.
The "Emerging" Markets
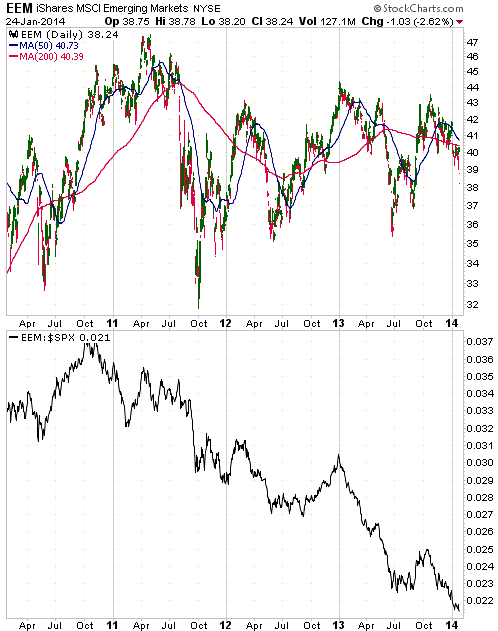
There is now a great deal of concern about "emerging market" equities and
currencies. This concern would have been useful in 2011 or 2012 or even during
much of last year, but with the downward trend in the EEM/SPX ratio
(emerging-market equities relative to US equities) now into its fourth year it
is too late to be getting bearish on the emerging markets. At the same time it
is too early to be getting bullish on the emerging markets, as a final
capitulation could still lie ahead.
We will be monitoring the EEM/SPX ratio (refer to the bottom half of the
following chart) for signs that the multi-year downward trend has ended.
This week's
important US economic events
| Date |
Description |
| Monday Jan 27 |
New Home Sales
Dallas Fed Mfg Survey | | Tuesday
Jan 28 |
Durable Goods Orders
Case-Shiller Home Price Index
Consumer Confidence
Richmond Fed Mfg Index | | Wednesday
Jan 29 |
FOMC Announcement | | Thursday
Jan 30 |
Q4 GDP
Pending Home Sales
|
| Friday Jan 31 |
Personal Income and Spending
Employment Cost Index
Chicago PMI
Consumer Sentiment |
Gold and
the Dollar
Gold
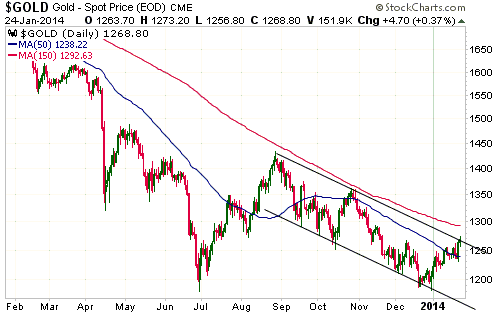
If we use a magnifying glass we see that gold broke out to the upside last
Friday, but if you have to use a magnifying glass to see a breakout then a
breakout hasn't really happened. The US$ gold price is clearly very close to
providing us with preliminary evidence of an upward trend reversal by breaking
above its channel top and its December-2013 rebound peak, but some additional
strength is required.
A weekly close above $1300 would be conclusive evidence of an upward trend
reversal.
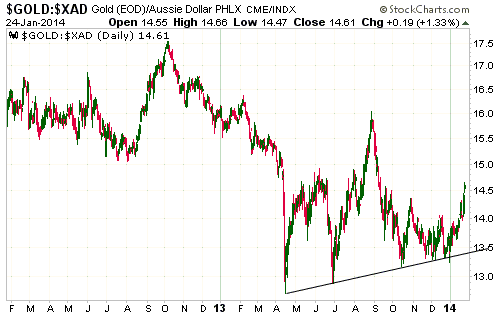
In A$ terms, gold bottomed last April and has since made a sequence of higher
lows. This price action should lead to relatively good results for gold
producers with operations in Australia.
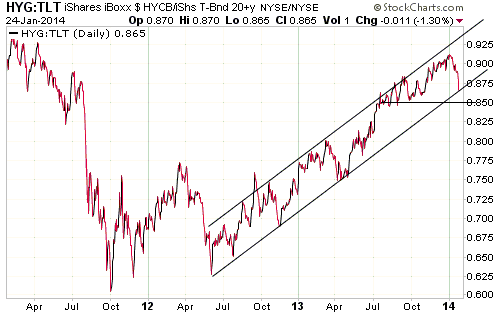
In the 6th January Weekly Update, we wrote:
"Gold's fundamentals turned more bullish in mid-2013 and in our opinion will
become increasingly so over the next 6 months, but right now the fundamental
backdrop for gold can best be described as mixed. The reason, in a nutshell, is
that there is still a lot of economic optimism and confidence in both the Fed
and the ECB. That's why credit spreads have been relentlessly narrowing since
June of 2012 and are now almost as narrow as they ever get.
The narrowing of credit spreads is indicated on the first of the following
charts by the upward trend in the HYG/TLT ratio (high-yield bonds relative to
Treasury bonds), because HYG outperforms TLT when investors become less risk
averse and bid-up high-yield (junk) bonds relative to US government bonds. The
HYG/TLT ratio probably can't go much higher, but it needs to start trending
lower to become 'gold bullish'. A break below 0.85 would confirm a downward
trend reversal."
The HYG/TLT ratio hasn't yet become 'gold bullish' by confirming a downward
trend reversal, but the following chart shows that it is now heading in the
right direction.
Gold Stocks
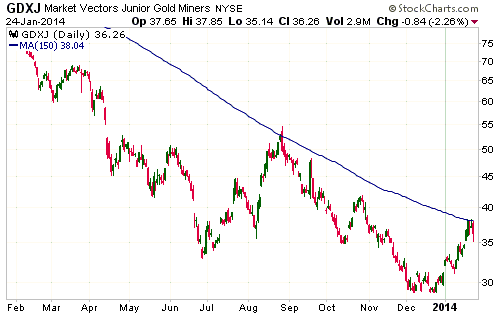
In last week's Interim Update we noted that the Junior Gold Miners ETF (GDXJ)
had reversed lower from its 150-day MA, just as it had done at the August peak.
It subsequently rose to this moving average and reversed lower on both Thursday
and Friday of last week. Here is the daily chart:
The following chart shows that the XAU is positioned similarly with respect to
its 150-day MA. Moreover, for the XAU the 150-day MA limited the October rebound
as well as the August rebound.
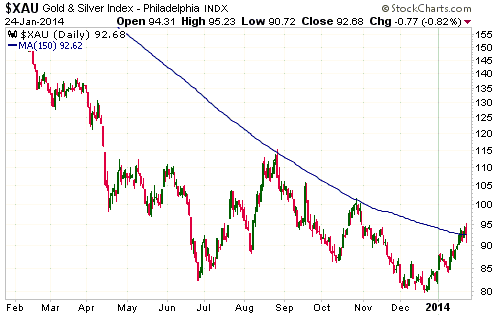
Why is the 150-day MA acting as resistance for the gold-mining sector? We don't
know; it just is.
The gold-stock indices and ETFs will obviously have to break above their
respective 150-day moving averages to provide the next piece of evidence that
major bottoms are in place.
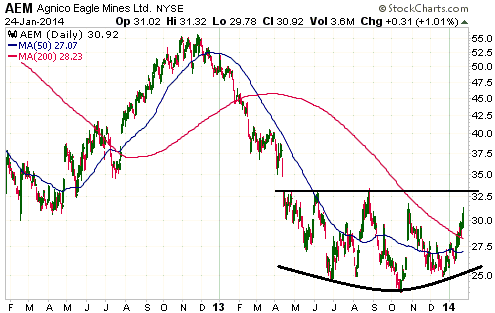
Agnico Eagle (AEM) is a relatively expensive gold miner; however, it has one of
the most bullish chart patterns in the gold-mining sector. The chart (see below)
contains a 9-month base, with a low in October and a higher low in December. The
top of the base is at $33.
A break above $33 would create a chart-based target of $40.
Currency Market Update
How the US$ reacts to a global stock market correction and what could turn out
to be the final phase of relative weakness in the "emerging markets" will give
us clues about the Dollar's short- and intermediate-term prospects. The US$
should benefit from a flight-to-safety bid during periods of significant global
stock-market weakness. Therefore, if it doesn't it will imply that the path of
least resistance is down and that there will be one more visit to the low-70s to
complete the long-term bottoming pattern. In this regard we thought it was
interesting that last week's stock-market turbulence did nothing for the US$.
The main beneficiary was actually the Yen.
The global stock market correction has probably just begun, so there is still
time for the potential 'flight-to-safety' US$ bid to appear. However, recent
market action and the absence of any evidence that the euro-zone banking/debt
crisis will soon resume have skewed the probabilities in favour of the Dollar
Index revisiting the low-70s before commencing a major upward trend. Our
intermediate-term US$ outlook has therefore shifted to bearish.
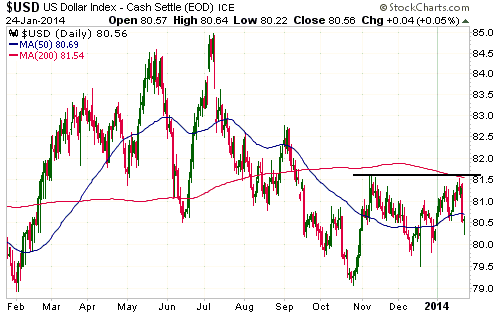
As illustrated below, the Dollar Index has resistance at around 81.6. This is
the top of the narrow range in which it has traded over the past few months and
just above the 200-day moving average. A weekly close above this resistance
would suggest that significant additional upside was in store and prompt us to
re-think our intermediate-term bearish outlook. Alternatively, a failure to
achieve a weekly close above this resistance in response to additional
'corrective' activity in the stock market over the coming month would be a
bearish omen for the Dollar Index.
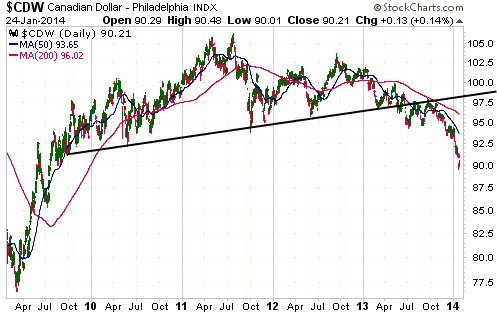
The following chart shows the Canadian Dollar's breakdown from a long-term
topping pattern. The C$ is in the midst of a cyclical bear market that is
probably not close to complete in terms of either price or time, but the
'waterfall' nature of the decline over the past three months creates the
potential for an intermediate-term rebound. This is especially so due to the
large speculative short position in C$ futures and the incipient signs of
strength in the commodity markets.
We began to increase our exposure to the C$ last Friday (by partially removing a
hedge) and will further increase our exposure if there is additional weakness
over the coming month. In our opinion, the C$ has intermediate-term downside
risk to 85 and intermediate-term upside potential to the high-90s.
In our opinion, the major currencies with the best intermediate-term risk/reward
ratios are the A$, the C$ and the Yen. The Yen is the major currency with the
best short-term risk/reward.
Updates
on Stock Selections
Notes: 1) To review the complete list of current TSI stock selections, logon at
http://www.speculative-investor.com/new/market_logon.asp
and then click on "Stock Selections" in the menu. When at the Stock
Selections page, click on a stock's symbol to bring-up an archive of
our comments on the stock in question. 2) The Small Stock Watch List is
located at http://www.speculative-investor.com/new/smallstockwatch.html
 Company
news/developments for the week ended Friday 24th January 2014: Company
news/developments for the week ended Friday 24th January 2014:
[Note: AISC = All-In Sustaining Cost, FS = Feasibility Study, IRR =
Internal Rate of Return, MD&A = Management Discussion and Analysis,
M&I = Measured and Indicated, NAV = Net Asset Value, NPV(X%) = Net
Present Value using a discount rate of X%, P&P = Proven and
Probable, PEA = Preliminary Economic Assessment, PFS =
Pre-Feasibility Study]
*Almaden Minerals (AAU) reported more results from the 2013 infill
drilling program at its Tuligtic gold-silver project in Mexico.
However, the moderately positive drilling news was overshadowed by a
very positive resource update announced later the same day. The
resource estimate published after the close of trading last
Wednesday updated the initial resource estimate completed 12 months
ago.
At a 0.5-g/t cutoff, the January-2013 estimate was as follows:
Measured (M): 0
Indicated (I): 2.0M oz gold-equivalent (Au-eq) at 1.1-g/t
M&I: 2.0M oz Au-eq
Inferred: 1.55M oz Au-eq at 1.16-g/t
Total: 3.55M oz Au-eq
At the same (0.5-g/t) cutoff, the new estimate is:
Measured (M): 1.35M oz Au-eq at 1.38-g/t
Indicated (I): 2.18M oz Au-eq at 1.08-g/t
M&I: 3.53M oz Au-eq
Inferred: 0.72M oz Au-eq at 0.98-g/t
Total: 4.25M oz Au-eq
This represents a moderate increase of 0.7M ounces in resource
quantity, but a substantial increase in resource quality.
After having risen substantially ahead of the positive resource
news, the stock has begun to consolidate its gains.
*Dragon Mining (DRA.AX) reported some good intercepts from 11
holes drilled below the current underground workings at its Orivesi
gold mine in Finland. The highlights were 18.65m averaging 20.6-g/t
from Hole KU-1343 and 18m averaging 5.33-g/t from Hole KU-1346.
These holes validate the current geological model.
Despite these drilling results, we do not view DRA as a good
candidate for new buying at this time. Many other gold stocks have
better risk/reward ratios.
*Endeavour Mining (EDV.TO): The EDV C$2.50 warrants expire on 4th
February and will be delisted from the TSX on that date. With the
stock price a long way below the warrant exercise price, the
warrants will expire worthless. The EDV warrant position in the TSI
List was one of many failed trading ideas during the 2011-2013 bear
market. On the plus side, we've learned some valuable lessons.
*Pilot Gold (PLG.TO) reported more drilling results from its TV
Tower project in Turkey.
As noted in our 13th January commentary: "...at this stage TV
Tower is known to host a deep and relatively high-grade
gold-silver-copper zone at the KCD Target, a near-surface zone of
silver-only mineralization that partially overlies the high-grade
gold-silver-copper zone at the KCD Target, and the shallow
oxide-gold K2 Target located approximately eight kms south of KCD."
Based on drilling results and other information presented in a PLG
press release last Tuesday, we can now add an extensive blanket of
supergene copper mineralisation underlying the oxide gold zones at
the K2 Target.
The TV Tower opportunity is continuing to grow. The problem is, it
is also becoming a very complicated story.
PLG also reported initial resource estimates for the gold and silver
zones at the TV Tower project's KCD Target. Using a 0.5-g/t cut-off,
the gold zone is presently estimated to contain 456K ounces of gold
in the M&I category at an average grade of 1.74-g/t plus a small
amount of "Inferred" gold. The silver zone is presently estimated to
contain 17.2M ounces of silver in the M&I category at an average
grade of 46.7-g/t plus 15.4M ounces of silver in the "Inferred"
category at an average grade of 52.7-g/t.
It's still early days for the TV Tower project, but the initial
resource estimate for the gold zone was surprisingly small. We
thought that it would be well over 1M ounces. The initial resource
for the silver zone was positive and suggests that it should at
least be possible to develop KCD into an open-pit silver mine.
*Rio Alto Mining (RIOM, RIO.TO) announced its Q4-2013 production
and its guidance for 2014.
RIO produced a quarterly record of 59K ounces of gold during the
third quarter of last year, but blew away this record during the
final quarter by producing 70.5K ounces. The excellent Q4 result
took the total production for 2013 up to 214K ounces, or 14K ounces
above plan.
The stock price didn't react to the good news because it had already
moved up sharply during the 2-week period leading up to the news.
Also, market participants might have been a little disappointed by
the company's 2014 guidance.
The 2014 guidance is for 190K-210K ounces of gold production at an
AISC of $824-$911/oz. If this forecast is achieved then RIO will be
profitable at any gold price above $1100/oz and will be a veritable
"cash cow" if gold averages at least $1350/oz. However, considering
that the company produced gold at an annualised rate of 258K ounces
over the final 6 months of last year the market was probably
expecting higher production guidance for this year.
RIO's management has a history of under-promising and
over-delivering, so it's a good bet that actual 2014 production will
come in well ahead of the aforementioned guidance.
RIO also announced that it will complete an update of the gold oxide
resources and reserves at its La Arena project in February, and at
the same time release an updated life-of-mine production plan,
financial model and sustaining capital estimate for the oxide mine.
This news could act as a catalyst for another upward re-rating of
the stock.
A pullback to around C$2.00/US$1.80 would create a new short-term
buying opportunity.
*Sabina Gold and Silver (SBB.TO) advised that it has submitted the
draft environmental impact statement (DEIS) and associated water
licence applications for the Back River gold project to the Nunavut
Impact Review Board (NIRB) and the Nunavut Water Board (NWB),
respectively. This is a significant permitting milestone, but at
this time it is of much lesser importance than the project's
economics.
With regard to the project's economics, the next piece of
potentially market-moving news will be an updated resource estimate.
This is due in the near future.
*Sprott Inc. (SII.TO), a Canadian asset management company focused
on resource-related investments, estimates that its AUM (Assets
Under Management) ended 2013 at around $7.0B. This is slightly lower
than the $7.3B figure reported for the September quarter.
Due to the performances of some of its favourite sectors, 2013 was a
bad year for SII. However, it looks like the worst case was already
priced into the stock by the middle of the year. The stock price
bottomed in the C$2.20s in July-2013 and has since been slowly
recovering as the market -- correctly, in our opinion -- has begun
to price in a better 2014 for commodity-related investments in
general and precious-metals-related investments in particular.
Considering how this year has begun, SII's AUM is likely to show a
significant gain when the Q1 results are reported.
 List
of candidates for new buying List
of candidates for new buying
From within the ranks of TSI stock selections, below is a list of the best
candidates for new buying at this time.
1) AKG (last Friday's closing price: US$1.63)
2) EDV.TO/EVR.AX at C$0.65 or lower (last Friday's closing price: C$0.68)
3) EVN.AX (last Friday's closing price: A$0.62)
 New
short-term trading position New
short-term trading position
As Australia's second-largest gold producer, Evolution Mining (EVN.AX) stands to
greatly benefit from the recovery in the A$-denominated gold price. However, up
until now the rebound in its stock price has been lacklustre. This creates the
potential for a catch-up move over the weeks ahead. In anticipation of this
catch-up move we have added a short-term EVN trading position to the TSI Stocks
List. This position is separate from the existing EVN position.
The following daily chart shows that EVN has resistance at A$0.75, A$1.00.
A$1.25 and A$1.50. The highest of these resistance levels is a realistic upside
target for 2014, but A$1.00 is the target for our short-term trade.
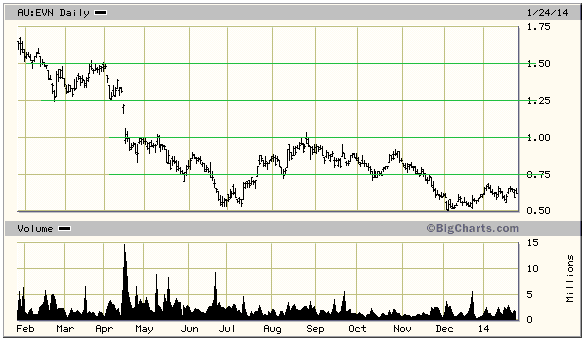
Chart Sources
Charts appearing in today's commentary
are courtesy of:
http://stockcharts.com/index.html
http://bigcharts.marketwatch.com/

|

