|
-- Weekly Market Update for the Week Commencing 27th February 2006
Big Picture
View
Here is a summary of our big picture
view of the markets. Note that our short-term views may differ from our
big picture view.
Bonds commenced a secular BEAR market in
June of 2003. (Last
update: 22 August 2005)
The stock market, as represented by the S&P500 Index, commenced a secular BEAR market during the first quarter of 2000. The rally
that
began in October of 2002 will end by the first quarter of 2006 and will
be followed by a substantial decline to a higher low (above the
Oct-2002 bottom) during the second half of 2006. The ultimate bottom of
the secular bear market won't occur until the next decade. (Last update: 12 December 2005)
The Dollar commenced a secular BEAR market during the final quarter of 2000. The
first major downward leg in this bear market ended during the first
quarter of 2005, but a long-term bottom won't occur until 2008-2010. (Last update: 28 March 2005)
Gold commenced a
secular bull market relative to all fiat currencies, the CRB Index,
bonds and most stock market indices during 1999-2001. The first major
upward leg in this secular bull market ended in December of 2003, but a
long-term peak won't occur until at least 2008-2010. (Last update: 13
February 2006)
Commodities, as
represented
by the CRB Index, commenced a secular BULL market in 2001. The first
major upward leg in this bull market will end during the first quarter of
2006, but a long-term
peak won't occur until at least 2008-2010. (Last update: 13 February 2006)
Copyright
Reminder
The commentaries that appear at TSI
may not be distributed, in full or in part, without our written permission.
In particular, please note that the posting of extracts from TSI commentaries
at other web sites or providing links to TSI commentaries at other web
sites (for example, at discussion boards) without our written permission
is prohibited.
We reserve the right to immediately
terminate the subscription of any TSI subscriber who distributes the TSI
commentaries without our written permission.
Outlook Summary
Market
|
Short-Term
(0-3 month)
|
Intermediate-Term
(3-12 month)
|
Long-Term
(1-5 Year)
|
Gold
|
Bullish
(20-Feb-06)
|
Bearish
(06-Feb-06)
|
Bullish
|
US$ (Dollar Index)
|
Bullish
(13-Feb-06)
| Bullish
(31-May-04)
|
Bearish
|
Bonds (US T-Bond)
|
Bearish
(11-Jan-06)
|
Bearish
(02-Jan-06)
|
Bearish
|
Stock Market (S&P500)
|
Neutral
(10-Jan-06)
|
Bearish
(05-Jan-05)
|
Bearish
|
Gold Stocks (HUI)
|
Neutral
(30-Nov-05)
|
Bearish
(06-Feb-06)
|
Bullish
|
General Commodities (CRB)
|
Neutral
(14-Nov-05)
|
Bearish
(23-Mar-05)
|
Bullish
|
Notes:
1. In those cases where we have been able to identify the commentary in
which the most recent outlook change occurred we've put the date of the
commentary below the current outlook.
2. "Neutral", in the above table, means that we either don't have a
firm opinion on which way the market will move or that we expect the
market to be trendless during the timeframe in question.
3. Long-term views are determined almost completely by fundamentals,
intermediate-term views by giving an approximately equal weighting to
fundmental and technical factors, and short-term views almost
completely by technicals.
Iran and Oil
...the
pricing-oil-in-euros issue is a storm in a teacup. ... The brewing
conflict over Iran's nuclear program does, however, have the potential
to develop into a major driver of market action over the remainder of
this year.
Iran has been on the minds of many investors over the past few months,
for two main reasons. First, there's the Iranian Government's
clearly-stated intention to push ahead with its nuclear ambitions.
These ambitions have not been spelt out, but Iran's refusal to allow
its nuclear facilities to be inspected, combined with the perception
that senior members of the country's government are Islamic extremists
bent on initiating a military conflict, creates the suspicion that
efficient electrical power generation is not the only goal of the
nuclear program. Second, there's Iran's decision to establish an oil
bourse on which the world's most important commodity will trade in
euros rather than US dollars. This, according to some commentators,
threatens the status of the US$ and, as a consequence, poses a threat
to the economic well-being of the US.
We can dismiss the second of the aforementioned concerns because Iran
pricing its oil in euros will not have a material effect on the US
dollar. If Iran wants euros or some currency other than the US dollar
then it can simply convert any dollars it happens to receive into the
currency of its choice on the foreign exchange market. And this is
almost certainly what it has been doing for many years. Demanding that
it receive payment in euros would therefore just mean that the
conversion from dollars to euros happened at a different stage in the
process, but the overall demand for each currency would be unchanged.
Some people have argued that the US can, and regularly does, create
dollars 'out of thin air', and that this provides a substantial benefit
to the US by effectively allowing it to get something (valuable
resources such as oil) for nothing (dollars created at zero cost by the
US Fed). This statement contains an element of truth in that today's
monetary system exists for the purpose of allowing governments and
banks to get something for nothing, but the US companies that import
oil can't just print the dollars they need; they have to earn them. And
again, the overall demand for US dollars will be the same regardless of
whether a US oil importer pays for oil in dollars, with the seller of
the oil then converting the dollars to euros, or pays for it in euros.
In our opinion, the pricing-oil-in-euros issue is a storm in a teacup.
It won't have a significant effect on the financial markets and it
won't prompt a dramatic response from the US Government. The brewing
conflict over Iran's nuclear program does, however, have the potential
to develop into a major driver of market action over the remainder of
this year.
If the conflict with Iran escalates then all the financial markets will
be affected in a big way with the greatest positive effect likely to be
seen in the oil market and the greatest negative effect likely to be
seen in the stock market. And of these two markets we think the oil
market will be the more reliable leading indicator of escalating
conflict in the Middle East. This is because there are good reasons
that are unrelated to Iran to anticipate a sizeable stock market
decline over the coming 6 months, but for the oil price to move to new
highs during 2006 it will probably have to garner a much larger
geopolitical risk premium than currently exists.
The financial markets are quite good at 'sniffing out' the likely
impact of a known threat, and at this stage the price action in the oil
market suggests that a military conflict with Iran will not occur
within the next several months. We say this because although the oil
price jumped $2 on Friday in response to a thwarted attack by suicide
bombers on a large Saudi oil facility, the overall impression created
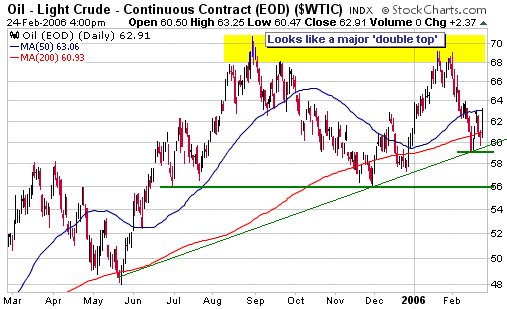
by the following daily oil futures chart is more bearish than bullish.
Note, in particular, that a) the December-January surge in the oil
price appears to have resulted in a successful test of the August-2005
peak, and b) it is taking a steady stream of oil-bullish geopolitical
news (Iran, Nigeria, Saudi Arabia) just to prevent the oil price from
breaking down through important support in the mid-to-high 50s.
In the absence of major supply shock we think the oil market will, over
the next few months, complete the topping process that began during the
third quarter of last year and break below support in the mid-50s. A
daily close below the February low ($59 on the following chart) would
be a clear signal that the story was, in fact, unfolding in this way,
whereas a daily close above $66 would be a warning that a major supply
shock -- potentially related to military conflict with Iran -- was on
the cards.
Bonds
An intermediate-term indicator
...if
the BKX/SPX ratio starts to trend higher in earnest then we will have
to re-evaluate our intermediate-term bearish view on the bond market.
Interest rate sensitive stock market sectors such as the homebuilders
and the banks were quite firm last week. In fact, the Philadelphia
Banking Index (BKX) has just moved to a new all-time high. Given that
we are intermediate-term bearish on bonds (we are anticipating higher
long-term interest rates) this market action grabbed our attention.
There's a strong tendency for bank stocks to trend higher relative to
the overall stock market when bonds are in an upward trend (when
interest rates are falling) and to trend lower relative to the overall
stock market when bonds are in a downward trend, a relationship that is
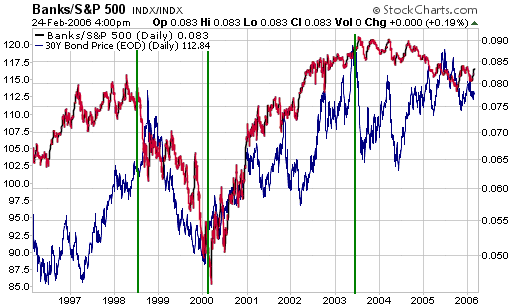
illustrated by the following chart. The chart shows that the BKX/SPX
ratio (the red line) trended higher during 1997-1998 in parallel with a
rally in the T-Bond price (the blue line), plunged during the bond bear
market of 1999, rallied throughout the bond bull market that began in
January of 2000 and culminated in June of 2003, and d) drifted lower
alongside the post-June-2003 consolidation in the bond market.
Regardless of what happens to the absolute levels of the BKX and the
S&P500 over the coming weeks/months, if the BKX/SPX ratio starts to
trend higher in earnest then we will have to re-evaluate our
intermediate-term bearish view on the bond market.
Current Market Situation
Below is a daily chart of T-Bond futures.
As far as our short-term bond market view is concerned, a daily close
above resistance at 113.50 would take us from "bearish" to "neutral"
whereas a close below 112 would reinforce our short-term bearish stance
and suggest that a test of the March-2005 low (around 109) lay ahead.
By the way, a drop to 109 by T-Bond futures would probably cause a big
problem for the stock market while a break below support at 109 would
almost certainly cause a big problem for the stock market.
Interestingly, over the past 7 months there's been a strong positive
correlation between the oil market and the bond market, meaning that
substantial weakness in the oil market might not prove to be a bullish
factor for the stock market.
The Stock
Market
Current Market Situation
The direction of the intermediate-term trend in the SOX/NDX ratio (the
Semiconductor Index divided by the NASDAQ100 Index) tends to be the
same as the direction of the broad market's intermediate-term trend, so
last week's downward reversal in SOX/NDX supports our current outlook.
We continue to expect that an important peak will be put in place in the US stock market over the coming month or so.
This week's
important US economic events
| Date |
Description |
Monday Feb 27
| New Home Sales
|
| Tuesday Feb 28
| Chicago PMI
Q4 GDP (revised)
Consumer Confidence
Existing Home Sales
| | Wednesday Mar 01
| Personal Income and Spending
Construction Spending
ISM Index
| | Thursday Mar 02
| No important events scheduled
| | Friday Mar 03
| ISM Services
|
Gold and
the Dollar
Gold and the Yen
...should
the Yen begin to act like its bear market is over then an important
source of financial market liquidity will disappear and the markets
that have floated higher on the rising sea of liquidity -- the gold
market included -- will fall...
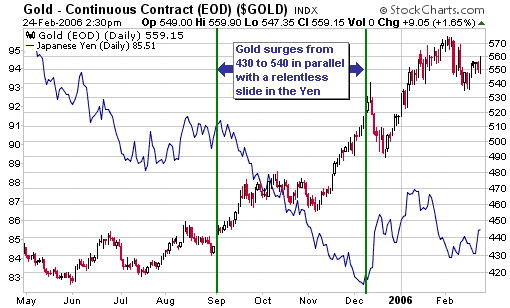
The following chart indicates that gold -- shown as candlesticks and
scaled at right -- and the Japanese Yen have been inversely correlated
over the past year. This inverse correlation is not 'normal' and has
arisen for two reasons. First, the Japanese public has been an
aggressive buyer of gold futures in response to Yen weakness and has
scaled-back these positions whenever the Yen has shown signs of
strengthening. Second, the Yen carry trade -- a trade that puts
downward pressure on the Yen -- has been used, over the past year, to
finance long-side speculations in the gold and commodity markets.
We've recently given
the relationship between gold and the Yen a lot of thought and have
come to the conclusion that the second of the above-mentioned reasons
for the past year's abnormal inverse correlation is the more important.
This is because 'the public' usually only gets bullish in response to
rising prices, so the buying of gold futures by the Japanese public is
more likely an EFFECT of the rally in the Yen gold price than a CAUSE
of something. On the other hand, one of the main underlying CAUSES of
the coincident strength in the US$ gold price and weakness in Yen/US$
-- a circumstance that results in extreme strength in the
Yen-denominated gold price -- is probably the burgeoning popularity of
the Yen carry trade.
What has happened over the past year and what continues to happen is
the large-scale borrowing of Yen at the extremely low interest rates
available in Japan in order to finance 'long' positions in markets that
are trending higher. This is a trade that has been working extremely
well and will continue to work well as long as the Yen remains in a
bear market. However, should the Yen begin to act like its bear market
is over then an important source of financial market liquidity will
disappear and the markets that have floated higher on the rising sea of
liquidity -- the gold market included -- will fall unless replacement
sources of liquidity are found. As discussed in the 15th February
Interim Update, there has been a strong positive correlation between
the gold sector of the stock market and some of the best-performing
Asian stock markets over the past year, which is what we'd expect to
see if gold-related investments were being pushed higher as part of a
general liquidity play.
The bottom line is that a sharp rebound in the Yen at this time would
probably cause the gold market to sell-off whereas additional weakness
in the Yen would probably help support the current upward trends in
gold, gold stocks, most stock markets, and the industrial metals.
Gold Stocks
Current Market Situation
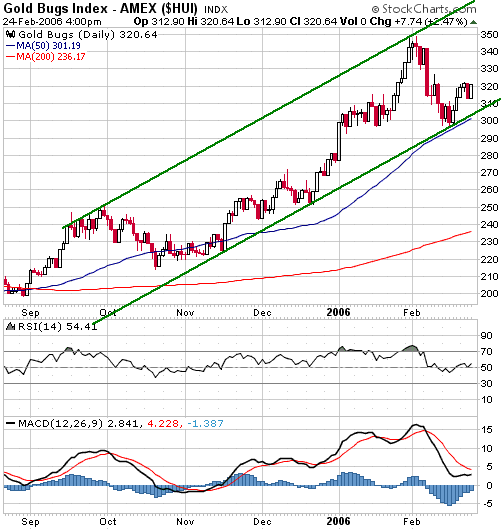
Below is a daily chart of the AMEX Gold BUGS Index (HUI) covering the past 6 months.
At this stage there isn't much to differentiate the downturn that began
on 31st January from last October's correction. Unfortunately, there
also isn't much to differentiate it from the downturn that followed the
December-2003 peak. Following its major peak in December of 2003 the
HUI dropped about 15%, rebounded to test its high, then embarked on a
large multi-month decline. Similar price action now would result in the
HUI moving higher over the coming days, perhaps testing its 31st
January peak in the process, before reversing sharply lower.
Even if an
intermediate-term correction is in progress we don't think the downside
potential over the coming months is anywhere near as great as it proved
to be during the first half of 2004. Instead, we suspect that the
correction would take the form of a consolidation that lasted at least
6 months and took the HUI back to support at around 260. In the mean
time, as long as the HUI does not close below the bottom of the channel
drawn on the above chart then the potential will remain for a final
surge -- concurrently, perhaps, with a final surge in global stock
markets -- over the coming 1-2 months.
Gold stocks and the US yield-spread
The
post-May-2005 divergence is probably explained by the financial world
remaining awash in liquidity despite the Fed's attempts to tighten
monetary policy.
A widening yield-spread (an increase in long-term interest rates
relative to short-term interest rates) tends to indicate rising
inflation expectations and/or 'easier' Fed monetary policy, whereas a
contracting yield-spread tends to occur when inflation expectations are
falling and/or Fed monetary policy is becoming 'tighter'. For this
reason the gold sector of the stock market typically trends in the same
direction as the yield-spread.
The following chart shows that the HUI (the red and black candlesticks)
trended higher with the yield-spread (the blue line) during 2000-2003
and then consolidated during 2004 and the first half of 2005 in
parallel with a large contraction in the yield-spread. However, a huge
divergence -- the shaded area of the chart -- then developed with the
HUI commencing a rally that would ultimately take it to new highs while
the yield-spread continued to contract. (Note: The yield-spread will
probably never move above its early-2004 high whereas the HUI is in a
long-term bull market and will therefore make a sequence of higher
peaks over the coming several years. The visually neat correlation
between the two markets that evolved during 2000-2003 is therefore not
going to recur on long-term charts, but if the basic relationship
continues to work then the direction of the yield-spread over periods
of more than one year will generally match the direction of the HUI's
trend over the same timeframe.)
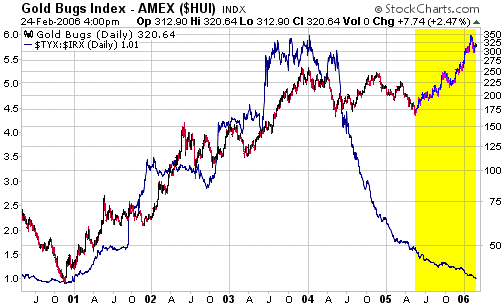
The post-May-2005
divergence is probably explained by the financial world remaining awash
in liquidity despite the Fed's attempts to tighten monetary policy.
However, the on-going contraction of the yield-spread represents
increasing downward pressure on the prices of gold stocks and all the
other assets whose prices have been elevated by the past year's deluge
of liquidity. Furthermore, the pressure will probably continue to
increase (the Fed will continue to hike short-term rates) until after
the financial markets start to show clear signs that the monetary
tightening is having an effect.
The gold sector should be a major beneficiary of the next multi-year
expansion in the yield-spread (expected to begin during the second half
of this year), but between now and the beginning of this expansion
there is likely to be a lengthy consolidation.
Currency Market Update
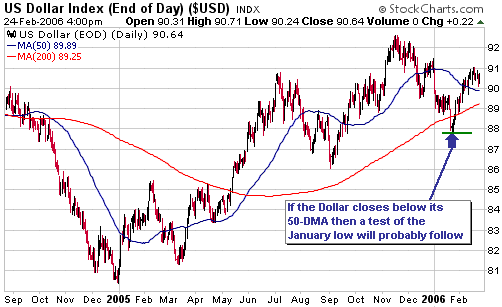
Our view is that the US dollar's correction bottomed in January and
that interest rate differentials will push the Dollar Index higher over
the next 6 months. We are still, however, allowing for the possibility
of the Dollar Index testing its January low before it breaks decisively
above last year's high. As noted on the following chart, we think that
a daily close below the 50-day moving average would warn that such a
test was coming up.
Update
on Stock Selections
 An article posted at http://www.resourceinvestor.com/pebble.asp?relid=17338
on 23rd February provides a good overview of the investment case for
Nevsun Resources (TSX and AMEX: NSU). The article mentions that
Canaccord recently valued NSU at US$4.23 per share. This, we think, is
a reasonable 12-month target for the stock. An article posted at http://www.resourceinvestor.com/pebble.asp?relid=17338
on 23rd February provides a good overview of the investment case for
Nevsun Resources (TSX and AMEX: NSU). The article mentions that
Canaccord recently valued NSU at US$4.23 per share. This, we think, is
a reasonable 12-month target for the stock.
We would consider NSU a buy at less than US$2.40/share and a strong buy
near US$2.00/share. As mentioned in our 22nd February commentary, the
Tabakoto gold project in Mali is probably worth at least US$1.80 per
NSU share so if you can buy NSU in the low-$2.00 area you will be
paying almost nothing for the large upside potential provided by the
Bisha project in Eritrea. In the stock market it is sometimes possible
to get something for nothing.
 We wrote the following about Western Silver (AMEX: WTZ) in the 14th November Weekly Market Update: We wrote the following about Western Silver (AMEX: WTZ) in the 14th November Weekly Market Update:
"Given WTZ's low market
cap relative to the enormous size of the Penasquito project we think it
would make sense for a mid-tier silver or gold producer with an
over-priced stock -- Glamis Gold and Pan American Silver spring to mind
-- to make a takeover bid, although the best long-term gains for WTZ
shareholders would probably stem from the company remaining
independent."
A takeover bid for WTZ came on Friday and it came from the most logical
place: Glamis Gold (NYSE: GLG). It makes a lot of sense for GLG to use
its extremely over-priced stock to buy WTZ because, even though the
agreed price represents a hefty premium for WTZ shareholders, doing so
substantially reduces GLG's market cap per reserve ounce and will end
up substantially reducing GLG's market cap per ounce of production.
The main thing in favour of maintaining some exposure to WTZ, rather
than making a complete exit at this time, is that part of the takeover
consideration involves WTZ shareholders receiving one share of a new
exploration-stage company -- temporarily named "ExploreCo" -- in
addition to receiving GLG stock. ExploreCo will be the new vehicle for
WTZ's current management and is a company in which we would like to
have a stake given the past performance of WTZ's management. However,
from now on the stock price of WTZ will move in lock-step with the
stock price of GLG and we don't want to be exposed to fluctuations in
the stock price of GLG. We are therefore going to immediately exit WTZ
at a profit of 159% based on Friday's closing price of US$21.60 and our
September-2005 entry price of US$8.34. Hopefully, we will be able to
pick-up shares of ExploreCo at a reasonable price when they eventually
begin trading on the stock market.
 In last week's commentary we said we would exit Apex Silver (AMEX: SIL)
if the stock price moved up to US$23. The stock closed at $23.29 on
Friday, so we will make our exit now at a profit of 55% based on our
January-2006 entry price of $15.05.
By the way, the run-up that SIL has experienced over the past two weeks
is the sort of price action we would probably see from Mines Management
(AMEX: MGN) IF it were able to move above US$8.40. There's a manic
quality to the current stock market action that is suggestive of an
important top in the making, but it would certainly be possible for the
mania to continue for another month or so.
 Looking at the gold/silver stocks remaining in the TSI Stocks List, the
most likely recipients of future takeover bids are Cumberland Resources
(TSX and AMEX: CLG), Metallica Resources (AMEX: MRB), and Nevsun
Resources (TSX and AMEX: NSU), with the most likely bidders being
Kinross Gold or Newmont Mining for Cumberland, Falconbridge/Inco for
Metallica, and an African miner such as Randgold Resources or Golden
Star Resources for Nevsun. However, we wouldn't be buying any of these
stocks now based on the off chance that they might receive takeover
bids in the near future.
NSU is presently at a level at which new buying would probably make
sense for those with a tolerance for political risk; MRB recently
traded at the top of the US$2.30-$2.50 buy range suggested in the 15th
February Interim Update, but has since moved back above US$3; and CLG
would have to drop back to the low-US$2 area before it would once again
become a low-risk buy.
 European Minerals (TSX: EPM) announced on Friday that a new contractor
had been appointed to take over the mine construction work at the
Varvarinskoye gold/copper project in Kazahkstan. The work was
originally intended to be done by the troubled MDM Ferroman.
The change in contractors will increase the total construction cost by
US$20M -- from US$125M to US$145M -- and delay project completion by 4
months (the scheduled date for the first gold pour has been pushed back
from December-2006 to April-2007).
We think EPM's management has done a reasonable job of containing the
damage stemming from MDM's delinquency and are pleased that some
uncertainty has now been removed. The project debt facility still has
to be re-negotiated, but in the current environment it shouldn't be
difficult to finance a project with such excellent economics.
The recent weakness in the EPM stock price has created a buying opportunity.
 Richmont Mines (AMEX: RIC) is a gold producer that has struggled over
the past few years despite the generally positive market environment.
RIC has always lacked 'option value' because its in-ground gold
reserves have always amounted to only a few years of production, which
is one reason why the stock has not been a speculative favourite.
However, RIC fell even further out of favour during the second half of
last year due to a sharp drop in gold production (2005's production
ended up being 40,000 ounces, down from 70,000 ounces in the previous
year).
Despite its drawbacks we are interested in RIC at its current price of
US$3.32 (there's a 'right price' for almost everything) and have added
it to the TSI Stocks List. We are interested for two main reasons.
First, the company's operational performance has most likely
bottomed-out and annual production from its three small mines in Canada
should rebound to around 80K ounces in 2006 and to more than 100K
ounces in 2007. If these production figures can be achieved and the
gold price remains near current levels then it will be difficult for
the market NOT to assign a value of at least US$8/share to RIC, even
with the low reserve base, on the basis that at US$8/share the company
would have a market capitalisation of only US$168M (there are only 21M
shares outstanding). This would be a low market cap for a company that
had 100K ounces per year of profitable gold production. Second, as
illustrated by the following 5-year chart the stock price is presently
close to a major support zone.
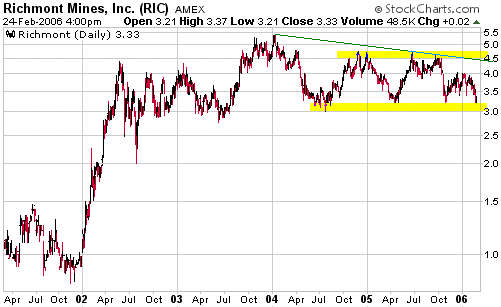
Chart Sources
Charts appearing in today's commentary
are courtesy of:
http://stockcharts.com/index.html

|

