|
-- Weekly Market Update for the Week Commencing
27th April 2015
Big Picture
View
Here is a summary of our big picture
view of the markets. Note that our short-term views may differ from our
big picture view.
In nominal dollar terms, the BULL market in US Treasury Bonds
that began in the early 1980s ended in 2012. In real (gold)
terms, bonds commenced a secular BEAR market in 2001 that will continue
until 2018-2020. (Last
update: 20 January 2014)
The stock market, as represented by the S&P500 Index,
commenced
a secular BEAR market during the first quarter of 2000, where "secular
bear market" is defined as a long-term downward trend in valuations
(P/E ratios, etc.) and gold-denominated prices. This secular trend will bottom sometime between 2014 and 2020.
(Last update: 22 October 2007)
A secular BEAR market in the Dollar
began during the final quarter of 2000 and ended in July of 2008. This
secular bear market will be followed by a multi-year period of range
trading.
(Last
update: 09 February 2009)
Gold commenced a
secular bull market relative to all fiat currencies, the CRB Index,
bonds and most stock market indices during 1999-2001.
This secular trend will peak sometime between 2014 and 2020.
(Last update: 22 October 2007)
Commodities,
as represented by the Continuous Commodity Index (CCI), commenced a
secular BULL market in 2001 in nominal dollar terms. The first major
upward leg in this bull market ended during the first half of 2008, but
a long-term peak won't occur until 2014-2020. In real (gold) terms,
commodities commenced a secular BEAR market in 2001 that will continue
until 2014-2020.
(Last
update: 09 February 2009)
Copyright
Reminder
The commentaries that appear at TSI
may not be distributed, in full or in part, without our written permission.
In particular, please note that the posting of extracts from TSI commentaries
at other web sites or providing links to TSI commentaries at other web
sites (for example, at discussion boards) without our written permission
is prohibited.
We reserve the right to immediately
terminate the subscription of any TSI subscriber who distributes the TSI
commentaries without our written permission.
Outlook Summary
Market
|
Short-Term
(1-3 month)
|
Intermediate-Term
(6-18 month)
|
Long-Term
(2-5 Year)
|
|
Gold
|
N/A |
Bullish
(26-Mar-12) |
Bullish
|
|
US$ (Dollar Index)
|
N/A |
Bearish
(26-Jan-15) |
Neutral
(19-Sep-07) |
|
US Treasury Bonds (TLT)
|
N/A |
Neutral
(18-Jan-12)
|
Bearish |
|
Stock Market
(DJW)
|
N/A |
Bearish
(28-Nov-11) |
Bearish
|
|
Gold Stocks
(HUI)
|
N/A |
Bullish
(23-Jun-10) |
Bullish
|
|
Oil |
N/A |
Bullish
(17-Dec-14) |
Bullish
|
|
Industrial Metals
(GYX)
|
N/A |
Neutral
(15-Sep-14) |
Bullish
(28-Apr-14) |
Notes:
1. Our short-term expectations are discussed in the commentaries, but except in
special circumstances we won't attempt to assign a "bullish", "bearish" or
"neutral" label to these expectations.
2. The date shown below the current outlook is when the most recent outlook change occurred.
3. "Neutral" means that we think risk and reward are roughly in balance with respect to the timeframe in question.
4. Long-term views are determined almost completely by fundamentals and intermediate-term views
are determined by a combination of fundamentals, sentiment and technicals.
Last
week's posts at the TSI Blog
Gold and the HUI are coiling
Gold is not a play on "CPI inflation"
Why gold mining companies should never hedge
What is the Fed about to tell
us?
The oracles of the Eccles Building are about to issue new words of wisdom to
guide us mere mortals in our financial affairs. In other words, the Fed is about
to insinuate its new plans for US monetary manipulation, which is all that
matters anymore. It's all that matters because asset allocation based on genuine
price signals was long ago rendered obsolete.
We are, of course, referring to the FOMC Announcement scheduled for this coming
Wednesday (29th April). Like its immediate predecessor (the announcement that
followed the March FOMC meeting), the 29th April announcement will garner even
more than the usual amount of attention because there is presently more than the
usual amount of uncertainty regarding the Fed's future actions.
With respect to this week's FOMC statement there are two possibilities, neither
of which involves an immediate rate hike. One is that it will contain almost the
same wording as the March statement, which would be a clear signal that there is
NOT going to be a rate hike at the next (that is, mid-June) FOMC Meeting. The
other possibility is that words about removing monetary accommodation at a
measured pace will be inserted into the statement. This would be a clear signal
that the Fed intended to start a rate-hiking program at the mid-June FOMC
meeting unless there were major economic or financial-market changes in the
meantime.
The first possibility is the more likely.
With regard to longer-term possibilities, everyone knows that the Fed will
eventually have to start hiking its targeted interest rate. The most relevant
question is: how many rate hikes will there be this year?
Since the beginning of 2015 our answer has been: no more than one. In other
words, we think that the right answer is either zero or one.
Gold and
FOMC Announcements
We were prompted by one of our
readers to take a close look at how the US$ gold price performs
around FOMC meetings, with a focus on the trading week leading up to
the FOMC Announcement day. Here's what we found:
Since the beginning of 2013 there have been 18 FOMC meetings. The
table presented below shows the announcement date associated with
each of these meetings (the FOMC announcement comes at the end of a
2-day meeting), the gold price at the end of the day prior to the
FOMC announcement, gold's daily closing price 6 trading days prior
to the FOMC announcement, and the difference between these two
prices. When this difference is negative it indicates that the gold
price fell during the 5 trading days leading up to FOMC Announcement
day. The table also shows the price change on the FOMC Announcement
day.
|
Date of FOMC announcement |
Gold price at end of day before FOMC |
Gold price 6 trading days before FOMC |
$ difference (neg means fell during 5 days before FOMC) |
$ chge on FOMC announcement day |
|
18-Mar-15 |
1148.1 |
1161 |
-12.9 |
18.3 |
|
28-Jan-15 |
1292.1 |
1294.2 |
-2.1 |
-9.2 |
|
17-Dec-14 |
1195.3 |
1232.1 |
-36.8 |
-6.1 |
|
29-Oct-14 |
1228 |
1249.7 |
-21.7 |
-16.2 |
|
17-Sep-14 |
1235.6 |
1256.6 |
-21 |
-11.5 |
|
30-Jul-14 |
1298.6 |
1308.1 |
-9.5 |
-3 |
|
18-Jun-14 |
1271.8 |
1260 |
11.8 |
5.9 |
|
30-Apr-14 |
1295.7 |
1283.1 |
12.6 |
-4.6 |
|
19-Mar-14 |
1355.3 |
1349.5 |
5.8 |
-24.9 |
|
29-Jan-14 |
1250.8 |
1240.5 |
10.3 |
16.8 |
|
18-Dec-13 |
1230.5 |
1261.3 |
-30.8 |
-12.7 |
|
30-Oct-13 |
1344.5 |
1340.3 |
4.2 |
-1.9 |
|
18-Sep-13 |
1309.7 |
1363.3 |
-53.6 |
55.3 |
|
31-Jul-13 |
1326.8 |
1348 |
-21.2 |
-3.7 |
|
19-Jun-13 |
1368.4 |
1377.8 |
-9.4 |
-17.4 |
|
01-May-13 |
1476 |
1413.2 |
62.8 |
-18.2 |
|
20-Mar-13 |
1610.9 |
1591.6 |
19.3 |
-5.2 |
|
30-Jan-13 |
1661.5 |
1691.4 |
-29.9 |
15 |
The above table shows that the US$ gold price
fell during the 5 trading days prior to the day of the FOMC announcement 11
times, or 61% of the time, during the period in question. Given that a strong
downward trend was in progress over much of the period there is probably a
better than 50% chance that any 5-day period would be negative, so 61% doesn't
strike us as strange.
Looking from a different angle, there were 115 weeks from the beginning of 2013
until the March-2015 FOMC Meeting. This equates to 6.4 18-week periods. The
cumulative change in the gold price from the beginning of 2013 until 17th March
2015 was -$576 (a loss of $576), which amounts to an average loss of $90 per
18-week period. The cumulative loss during the 18 weeks preceding the FOMC
meetings over the period since the beginning of 2013 was $122. This means that
the cumulative loss during the pre-FOMC weeks was $32 higher than the average
18-week loss. $32 over 18 weeks is about $1.80 per week. In other words, the
data since the beginning of 2013 suggest a downward bias of $1.80 during the
week leading up to the FOMC Announcement day, which is obviously not
significant.
However, if we zoom in on the more recent past we discover that the gold price
has been down during the 5 trading days prior to all of the past 6 FOMC
meetings. This is a more interesting pattern -- a pattern that warrants
additional discussion because it is unlikely to be a purely random outcome.
Furthermore, unless the gold price rebounds strongly over the next two trading
days and closes above $1201.80 this coming Tuesday (the day before the next FOMC
announcement), the uninterrupted run of negative pre-FOMC weekly moves will
stretch to seven.
By the way, prior to the current run of 6 negative pre-FOMC moves, there was a
run of 4 positive pre-FOMC moves.
The current run of negative pre-FOMC moves is probably due to the perception
that the Fed is getting close to signaling the start of a rate-hiking campaign.
What we mean is that speculators, who, as a group, have always been net-long
gold futures to varying degrees over the past 14 years, could be liquidating
long positions in gold futures during the days leading up to FOMC Announcement
day in order to mitigate the risk of being hurt by a 'hawkish' FOMC statement.
This was almost certainly the case in March, when there was more uncertainty
than usual regarding what the Fed would say in its post-FOMC statement (the gold
price fell $12.90 during the 5 trading days prior to the 18th March FOMC day and
then gained $18 when the FOMC statement proved to be less 'hawkish' than
feared).
This could mean that the strong recent tendency for the gold price to fall
during the trading week prior to FOMC day will persist until either 1) the Fed
starts hiking rates (thus removing the uncertainty) or 2) a rate-hike is taken
off the table by bearish economic/financial-market developments.
The last column in the above table shows the change in the gold price on the
FOMC Announcement day. We were hoping to find a reliable/tradable pattern here,
such as: If the gold price is down by $10 or more over the 5 trading days before
FOMC day then there is a high probability of it rising on FOMC day. However, no
such relationship appears to exist. Note that for the 5 FOMC meetings prior to
the March-2015 event the gold price had fallen during the trading week leading
up to FOMC day and then fallen further on FOMC day, so a pattern did appear to
be emerging. However, the market reaction to the March FOMC announcement showed
that it is risky to blindly assume that a pre-FOMC decline implies a further
decline on FOMC day.
A final, related point worth making before we leave this topic is that central
bankers in the US and most other countries don't care about the gold price. They
cared deeply about the gold price during the 1960s and 1970s, they still cared
-- albeit to a lesser extent -- in the 1980s, but nowadays they couldn't care
less. In fact, very few people now care about the gold price apart from those
who invest in gold or gold-related businesses and those who trade gold.
Furthermore, hardly anyone these days views gold as a barometer of stress in the
financial system. Everyone should, but the reality is that almost no-one does.
For example, when the gold price traded as high as $1925 in August-2011 it
wasn't widely considered to be a sign of an inflation problem or a
financial-system problem. Central bankers pretty much ignored the rise and
continued doing what they had been doing, while the mainstream press treated the
price rise as a curiosity rather than a sign of trouble.
As far as gold's long-term price prospects are concerned, this is actually a
plus. It means that the gold price will be able to move well above $2000/oz
before anyone outside the "gold community" gives a hoot.
The Stock
Market
Commodity Stocks
There have been some interesting rebounds in commodity-related equities over the
past few weeks. The rebounds are interesting because they are at odds with or
are seemingly unrelated to the performance of the associated commodities. One
example is the uranium-mining sector.
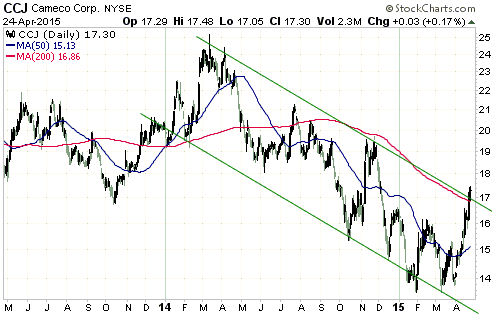
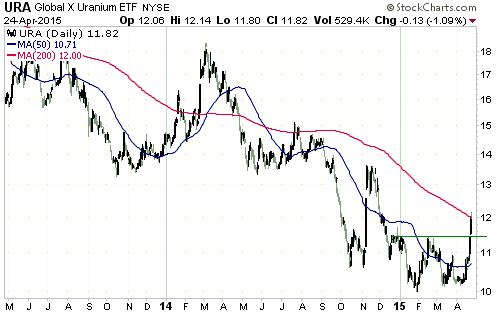
In last week's Interim Update we noted that Cameco (CCJ) and the Global X
Uranium Fund (URA) had rebounded strongly, despite the lack of significant
movement in the uranium price. The rebounds continued over the final two days of
the week, enabling CCJ to break above its 200-day MA and enabling URA to break
above short-term lateral resistance. The relevant charts are displayed below.
CCJ and URA are now up by 24% and 16%, respectively, since the beginning of
April. Over the same period the uranium price is down by around $1/pound.
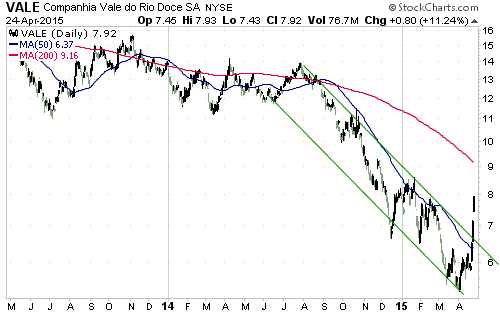
Another example is the iron-ore-mining sector, with Brazil's VALE being the
poster child. This stock has quickly gained 50% (see chart below) in spite of
the apparently dismal short- and intermediate-term prospects for iron-ore.
When the prices of commodity-related equities diverge in a big way from the
prices of the underlying commodities it is usually a reliable warning that the
commodity price trend is about to change. The recent strong rebounds in the
stocks of various commodity producers should therefore not be dismissed as a
temporary effect of irrational speculation. Just as the oil price reversed
upward last month in the face of what appeared on the surface to be
irresistibly-bearish fundamentals, the prices of other commodities could be
about to do the same.
What must now happen to confirm a reversal is for the stock prices to partially
retrace their recent rallies and then move to new multi-month highs.
The US
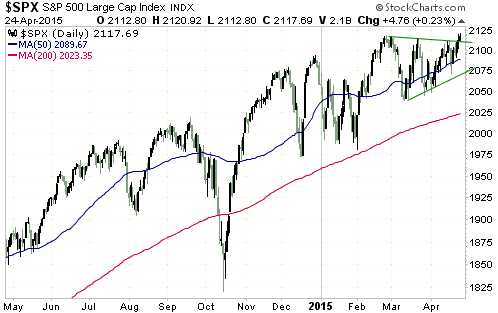
The S&P500 Index (SPX) closed above its early-March high last Friday, which
means that it has just made a new all-time high. It doesn't yet qualify as a
breakout, though, because Friday's close was less than one point above the 2nd
March close.
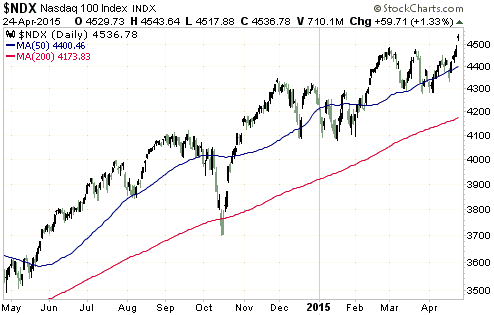
However, the NASDAQ100 Index (NDX) clearly did breakout to a new high for the
year. In the NDX's case it was a new 10-year high, but the March-2000 peak is
still the all-time high.
Also, the article posted
HERE notes that NYSE margin debt hit a new all-time high in March. Due to
the lead-lag relationship between the long-term trends in margin debt and the
S&P500 Index, this suggests that the US equity bull market is still at least a
few months from its end.
Taking into account this long-term indicator and the recent 'surprising'
strength in commodity stocks, what we have possibly witnessed over the past four
weeks is the start of the rotation into commodity-related plays that sometimes
happens during the final phase of a cyclical equity advance.
An additional multi-month extension of the US equity bull market involving a
shift in favour of commodity stocks is one of the two highest-probability
intermediate-term scenarios. The other is that we are witnessing the same type
of short-lived breakout to new highs that marked major tops in 2000 and 2007.
The realistic chance that the second of these scenarios is playing out means
that there continues to be substantial downside risk.
If the second scenario is playing out then the S&P500 Index should definitely
not make a new high after May and should probably not make a new high after
mid-May.
This week's
significant US economic events
(The most important events are shown
in bold)
| Date |
Description |
| Monday Apr 27 |
Dallas Fed Mfg Survey | | Tuesday
Apr 28 |
Consumer Confidence
Case-Siller Home Price Index | | Wednesday
Apr 29 |
FOMC Announcement
Q1 GDP
Pending Home Sales Index | | Thursday
Apr 30 |
Persoanl Income and Spending
Employment Cost Index
Chicago PMI
|
| Friday May 01 |
Motor Vehicle Sales
ISM Mfg Index
Construction Spending
Consumer Sentiment |
Gold and
the Dollar
Gold
The Fundamentals
Gold is generally going to be under downward pressure during any week when the
S&P500 Index gains ground on 4 out of 5 days and ends the week at a new all-time
high. Such was the case last week. However, last week's decline in the gold
price was driven more by sentiment than fundamentals. The reason is that some of
gold's fundamental drivers became slightly more bearish last week while others
became slightly more bullish, with the net effect being no significant change.
In particular, on the bullish side of the ledger there were small declines in
the Dollar Index and the BKX/SPX ratio (bank stocks weakened relative the broad
market), while on the bearish side of the ledger there was a small rise in real
US interest rates and a minor narrowing of credit spreads.
The fundamental backdrop remains neutral for gold.
The Price Action
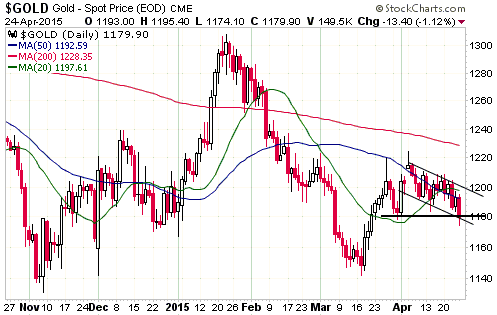
Depending on where we draw lines on the chart, we can show that the US$ gold
price just managed to hold at support last Friday or we can show that the US$
gold price has breached support. Regardless of which of these interpretations we
choose, the probability of gold rising to its 200-day MA or higher prior to its
next multi-week peak was reduced by last week's price action.
Actually, the price action doesn't support any specific view as to what's likely
to happen in the near future, especially since the coming week contains the FOMC
wildcard.
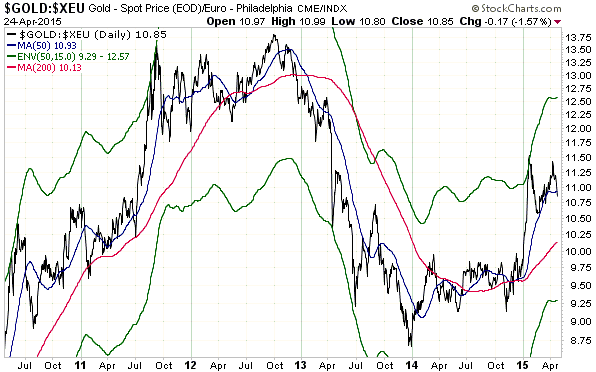
Price-action-wise, one of the biggest problems for gold over the past three
months has been the extent to which the market was 'overbought' in euro terms in
late-January. After gold/euro rocketed up to the top of the MA envelope shown on
the following daily chart and then began to correct, it was likely -- based on
the historical record -- to continue its correction until the 200-day MA was
reached. An upward trend in the 200-day MA is helping to close the gap between
this MA and the current price, but the gap is still quite wide.
Two weeks ago, with gold/euro having just rebounded to near its January peak, we
pointed out the downside risk indicated by gold/euro's position relative to its
200-day MA and said "gold-mining companies operating in Europe should seriously
consider hedging some of their remaining 2015 production near the current
price." The hedging opportunity is not as good now as it was then.
To summarise our current opinion about gold's prospects:
1. We have no opinion about what the gold price will do this week. A lot will
depend on whether the Fed changes the wording of its post-FOMC statement as
discussed earlier in today's report. If there is no change to the wording then
the gold price will probably shoot upward in the hours following the
announcement (more so if there is some additional weakness on Monday-Tuesday),
but if the "remove accommodation at a measured pace" language is inserted then
the downward pressure will intensify and one or two of our well-under-the-market
buy orders should get filled.
2. The extension of the upward trend in the US stock market reaffirms the
likelihood of the US$ gold price re-testing its November-2014 low within the
coming three months. A quick move back into the $1200s in reaction to a 'dovish'
Fed statement wouldn't alter this expectation.
3. We have little doubt that in euro terms a cyclical gold bull market commenced
way back in December of 2013. This bull market's next upward leg probably won't
begin until after the price has returned to its 200-day MA, which could still a
few months away.
Gold Stocks
It's remarkable how often a widely-followed index will end a trading session at,
or almost exactly at, a popular moving average. For example, the US$ gold price
closed exactly at its 50-day MA on Monday and Thursday of last week, and last
Friday the HUI and the US Bank Index (BKX) ended the day within 1c of their
respective 50-day MAs.
This happens due to the influence of technical traders and trading systems.
Moving averages are not natural support/resistance levels (they are
trend-smoothing devices), but the most popular MAs become support and resistance
because they are popular and are used as triggers for buy/sell orders.
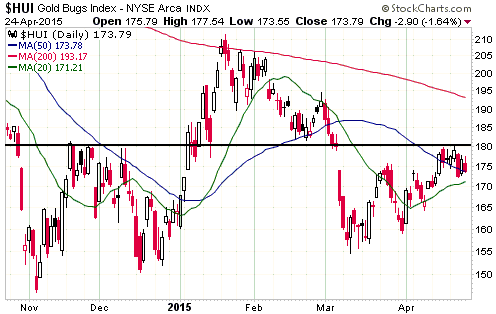
The gold-mining sector generated a few conflicting price signals last week, with
the only clear-cut message being that HUI resistance at 180 is important. On
Friday the gold-stock indices declined in reaction to a sharp pullback in gold
bullion, but at the end of the day the HUI had managed to hold its 20-day and
50-day moving averages. It therefore wasn't a significantly bearish day for the
gold-mining sector.
As illustrated by the following daily chart, the HUI spent the past 7 trading
days chopping back-and-forth near its 50-day MA.
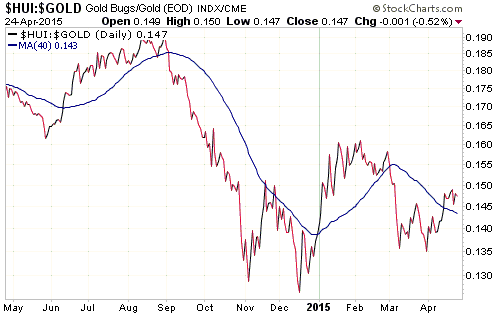
With regard to the gold-mining sector's short-term prospects, the most bullish
picture is presently being painted by the following chart of the HUI/gold ratio.
HUI/gold broke above its 40-day MA during the week before last and sustained the
breakout during last week's consolidation. This chart projects strength in the
gold-mining sector and gold bullion over the weeks immediately ahead.
With regard to the gold-mining sector's intermediate-term prospects, there could
be a rally in gold-mining stocks and gold bullion during the second half of this
year as part of a rotation towards commodity-related investments. This would be
similar to what happened during 1986-1987. However, new cyclical bull markets in
gold and gold mining will almost certainly require a bear market in general US
equities.
The Currency Market
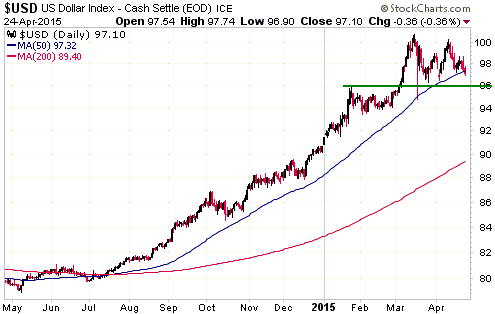
For the first time since last July, the Dollar Index has closed below its 50-day
MA. This is a sign of weakness, but the potential for a re-test of the March
high will remain until there is a daily close below lateral support at 96.
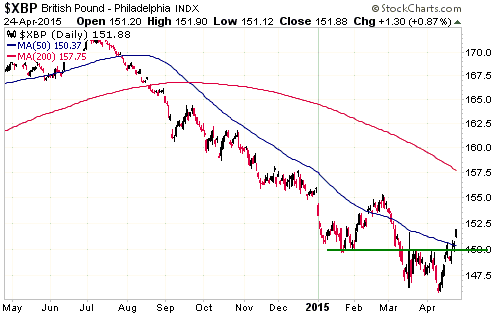
The Canadian Dollar (C$) was the first major currency to definitively signal a
trend reversal (from down to up) against the US$ when it broke above the top of
a multi-month basing pattern earlier this month. The British Pound is the second
major currency to do so, although the Pound's reversal is not as clear as the
C$'s.
Updates
on Stock Selections
Notes: 1) To review the complete list of current TSI stock selections, logon at
http://www.speculative-investor.com/new/market_logon.asp
and then click on "Stock Selections" in the menu. When at the Stock
Selections page, click on a stock's symbol to bring-up an archive of
our comments on the stock in question. 2) The Small Stock Watch List is
located at http://www.speculative-investor.com/new/smallstockwatch.html
 Company
news/developments for the week ended Friday 24th April 2015: Company
news/developments for the week ended Friday 24th April 2015:
[Note: AISC = All-In Sustaining Cost, FS = Feasibility Study, IRR = Internal
Rate of Return, MD&A = Management Discussion and Analysis, M&I = Measured and
Indicated, NAV = Net Asset Value, NPV(X%) = Net Present Value using a discount
rate of X%, P&P = Proven and Probable, PEA = Preliminary Economic Assessment,
PFS = Pre-Feasibility Study]
*Evolution Mining (EVN.AX) announced that it has entered into an
agreement to purchase the Australian assets of La Mancha Resources (LMR), a
privately-held mining company. In exchange for issuing 322M new EVN shares to
LMR, EVN will get the high-grade Frogs Leg underground mine (770K-oz gold
resource at 6.4-g/t) and the White Foil open-pit mine (1.9M-oz total gold
resource at 1.6-g/t). These assets are located within 2kms of each other in
Kalgoorlie, Western Australia, and are expected to add 130K-160K ounces per year
to EVN's production at an AISC of around US$800/oz.
Based on the mid-range of EVN's current production guidance and the 130K-160K
forecast for the LMR assets, EVN is trading 31% of the company to increase
production by 34%. Given that the production costs of the assets being acquired
are roughly the same as the average production cost of EVN's existing assets, in
this respect the acquisition price is slightly accretive to the company's
per-share value. However, as part of the purchase EVN will also be assuming
about A$115M of LMR's net debt. When the debt is taken into account, we estimate
that the acquisition reduces EVN's per-share value by 10%-20%.
On the plus side, adding the two LMR mines to EVN's existing portfolio of four
operating mines reduces risk and could increase the stock's attractiveness to
institutional investors. It is also likely to increase the number of EVN shares
owned by GDXJ. The overall effect on the share price could therefore be positive
after the dust settles, especially since LMR has agreed not to sell any of its
EVN shares for at least two years after the deal is completed.
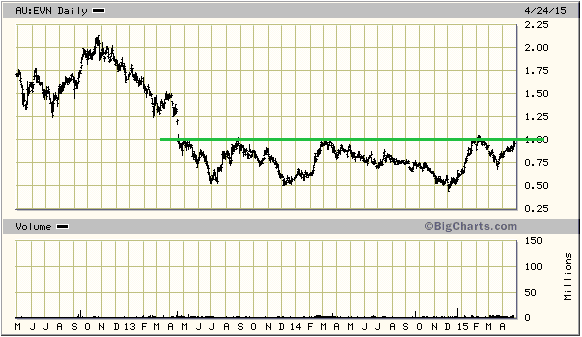
After initially selling off in reaction to the announcement of the LMR
acquisition, EVN shares rallied and ended the week at the top of their 2-year
range (see chart below). This 2-year range is almost certainly a very lengthy
basing pattern.
Whether or not EVN breaks out of its basing pattern this week will largely be
determined by the performance of the overall gold-mining sector.
On a side note, EVN's management should arrange a TSX and/or NYSE listing to
make it easier for investors outside Australia to own the stock of what will,
following the completion of the deal discussed above, be one of the world's best
mid-tier gold producers.
*McEwen Mining (MUX) reported some drilling results from its El
Gallo 1 gold project in Mexico. The results weren't spectacular, but the main
purpose of the drilling was to extend the life of the existing mine and in this
regard the results were probably good enough. In particular, several holes
returned intercepts in the 30-50 gram-metres range (an intercept where the
length multiplied by the average grade is 30 to 50).
An updated resource estimate for El Gallo is scheduled for Q3-2015.
*UEX Corp. (UEX.TO), an exploration-stage junior uranium miner, is
raising about C$2.5M by issuing "flow through" shares at C$0.30/share. We
thought that UEX would wait until the second half of the year before topping-up
its treasury via a small equity financing, so from our perspective the timing of
this financing is a surprise.
If this financing is completed as planned it should leave the company with about
C$10M of cash. This year's exploration budget is C$4.6M.
 List
of candidates for new buying List
of candidates for new buying
From within the ranks of TSI stock selections the best candidates
for new buying at this time, listed in alphabetical order, are:
1) AAU (last Friday's closing price: US$0.80).
2) AKG (last Friday's closing price: US$1.41).
3) EDV.TO (last Friday's closing price: C$0.59).
4) MUX (last Friday's closing price: US$0.98).
Note that the above list is limited to five stocks. It will
sometimes contain less than five, but it will never contain more
than five regardless of how many stocks are attractively priced for
new buying.
 Buying
opportunities on additional price weakness Buying
opportunities on additional price weakness
Listed above are the stocks that we think are the best candidates for new buying
near current prices. However, additional price weakness could create better
opportunities elsewhere. In this regard, Premier Gold (PG.TO) and Dalradian
Resources (DNA.TO) are worth mentioning.
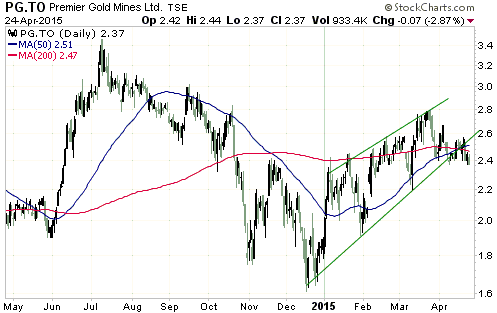
In our opinion, Premier Gold is now perfectly suited to its name in that it is
now the world's premier exploration-stage gold-mining company. This is reflected
to some degree by the relative strength of its stock price since mid-December of
last year.
The strength in its stock price has limited the opportunities for new buying
over the past three months, but the chart pattern suggests that the stock could
again become available in the C$2.00-C$2.20 range. If so, it should be viewed as
a buying opportunity.
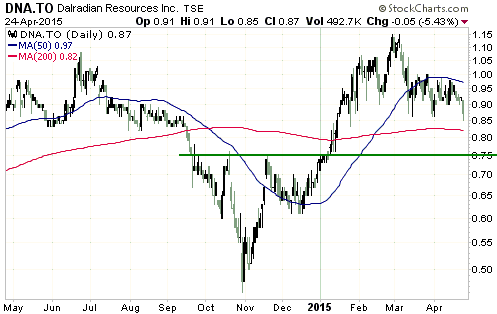
The economics of DNA.TO's gold project in Northern Ireland are determined more
by the euro gold price than the US$ gold price. The relative strength in the
euro gold price is therefore an important plus for this company.
Like PG.TO, recent opportunities to buy DNA.TO have been limited by its
strength. As illustrated by the following chart, the stock price more than
doubled from its Q4-2014 low to its Q1-2015 high. But also like PG.TO, the chart
pattern suggests that a new opportunity to buy DNA shares could soon arrive.
We think that DNA would be a strong buy in the low-C$0.80s or lower. Short-term
downside risk is probably defined by support at C$0.75.
 A
stock to put on your radar screen: NovaCopper (NYSE and TXX: NCQ). Recent price:
US$0.55 A
stock to put on your radar screen: NovaCopper (NYSE and TXX: NCQ). Recent price:
US$0.55
NCQ is an exploration-stage copper junior with
two large,
moderate-grade copper projects in Alaska. We had no interest in owning this
stock until last week, when it was announced that NCQ was buying Sunward
Resources (SWD.TO) in an all-share deal. This deal will add the large, low-grade
Titiribi gold-copper project (Colombia) to NCQ's stable. It will also add about
US$20M of cash, removing the need for NCQ to do an equity financing this year.
We don't think that this is the right time to buy NCQ, for two reasons. First,
large copper deposits in remote locations are likely to remain out of favour
until the copper price makes a sustained break above US$3.00. Second, although
copper has the potential to test resistance at $2.90-$3.00 within the next few
weeks, we doubt that it will break out anytime soon and there is a decent chance
that it will test this year's low near $2.40 before commencing an
intermediate-term rally.
However, NCQ could be a good stock to own later this year.
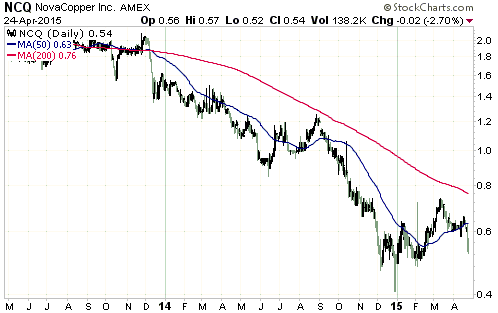
Chart Sources
Charts appearing in today's commentary
are courtesy of:
http://stockcharts.com/index.html
http://bigcharts.marketwatch.com/

|

