![]()
![]()
![]()
![]()
-- Weekly Market Update for the Week Commencing 27th August 2018
Big Picture
View
Here is a summary of our big picture
view of the markets. Note that our short-term views may differ from our
big picture view.
The BULL market in US Treasury Bonds that began in the early 1980s ended in mid-2016, but there will be many years of topping action in bond prices and bottoming action in bond yields before major new trends get underway. A major decline in government bond prices will unfold during the 2020s. (Last update: 11 September 2017)
The stock market, as represented by the S&P500 Index, commenced a secular BEAR market during the first quarter of 2000, where "secular bear market" is defined as a long-term downward trend in valuations (P/E ratios, etc.), gold-denominated prices and inflation-adjusted prices. This secular trend will bottom in 2020 or later. (Last update: 11 September 2017)
A cyclical BEAR market in the US Dollar began in 2016-2017. (Last update: 11 September 2017)
Gold commenced a secular bull market relative to all fiat currencies, the CRB Index, bonds and most stock market indices during 1999-2001. This secular trend will peak in 2020 or later. (Last update: 11 September 2017)
Commodities,
as represented by the CRB Index, commenced a
secular BULL market in 2001 in nominal dollar terms. The first major
upward leg in this bull market ended during the first half of 2008, but
a long-term peak won't occur until 2020 or later.
(Last
update: 11 September 2017)
Copyright
Reminder
The commentaries that appear at TSI
may not be distributed, in full or in part, without our written permission.
In particular, please note that the posting of extracts from TSI commentaries
at other web sites or providing links to TSI commentaries at other web
sites (for example, at discussion boards) without our written permission
is prohibited.
We reserve the right to immediately
terminate the subscription of any TSI subscriber who distributes the TSI
commentaries without our written permission.
True
Fundamentals Summary
[Notes:
1) The date shown next to the current True Fundamentals Model (TFM) signal is
when the most recent change occurred. 2) Charts of the Gold and Equity
TFMs are included in the "Charts and Indicators" section of the TSI web
site]
| Market | True Fundamentals Model (TFM) |
| Gold (US$ Price) | Bearish (20 Jul 2018) |
| US Equity (SPX) | Neutral (24 Aug 2018) |
| Currency (Dollar Index) | Bullish (27 Apr 2018) |
| Commodities (GNX) | Bearish (01 Jun 2018) |
Last week's posts at the TSI Blog
Sentiment pitfalls, the gold edition
Summary of current
thinking/positioning
1) Despite breaking out to the
upside only eleven trading days ago, the Dollar Index may have already
reached a short-term peak.
2) Gold-market sentiment remains extreme
(relative to the past 15 years) and the first evidence of an upward
reversal has emerged. Also, the fundamental backdrop has begun to shift in
gold's favour.
3) It is still not clear that the capitulation in
the gold-mining sector has run its course, but the odds have shifted in
favour of at least a 2-3 week rebound.
4) There are numerous
divergences within the US stock market, but the senior stock indices have
not yet shown significant signs of weakness. This means that new highs
could be achieved before a tradable decline gets underway. However, with
monetary conditions tightening, the short-term downside risk is high.
5) After being relatively strong for the bulk of the past 12 months
the oil market looks set to be relatively weak for the next few months.
6) The T-Bond price should have an upward bias (meaning: the T-Bond
yield should have a downward bias) for at least another 1-2 months. In
fact, with the speculative short position in 10-year T-Note futures making
another new all-time high last week you would have to be desirous of
losing money to bet against the T-Bond at this time.
7) We are
holding a cash reserve of 30-35%.
Will the Fed
buckle under Trump's pressure?
The answer to the above question
is no, Trump's berating of the Fed for continuing to hike its targeted
interest rates will not lead to looser monetary policy. If anything, Trump
is making it more difficult for the Fed to slow or stop its rate-hiking
because if it now does so it will appear to be yielding to political
pressure and will lose credibility. Don't get us wrong, the Fed will
buckle; it just won't be due to the haranguing of Trump.
Until the
past couple of months we thought that the Fed would continue merrily along
the rate-hiking path until something broke, with a large decline in the
stock market being the most likely catalyst for a monetary-policy
directional change. However, recent comments by senior Fed representatives
have indicated that there is another, perhaps even more likely, potential
catalyst for a shift in the Fed's stance. We are referring to fear of the
US yield curve inverting.
At least a few influential members of the
committee that sets the Fed's interest rate targets have got it into their
heads that an inversion of the yield curve CAUSES a recession, and
therefore that a recession can be avoided by preventing short-term
interest rates from becoming higher than long-term interest rates.
Consequently, the closer the 10-year T-Note yield gets to the 2-year
T-Note yield the more likely it will be that the Fed puts its rate-hiking
program on hold.
As illustrated below, the 10yr-2yr yield spread
ended last week at a new cyclical low of only 0.19%. This means that if
the 2-year yield doesn't move it won't take much of a bond rally to bring
about an inversion of the curve. Given the huge speculative short position
in 10-year T-Note futures, an inversion could happen as soon as next
month.
If the Fed soon starts taking actions designed to prevent a yield
curve inversion, the most important ramification could be a dramatic rise
in long-term yields next year due to surging inflation expectations. In
other words, if the Fed tries to stop the yield curve from inverting it
may end up getting what it wants -- good and hard.
Oil Update
Two weeks ago we cited three
reasons to focus on oil's short-term downside potential. One was that
oil's high price relative to other industrial commodities opened up the
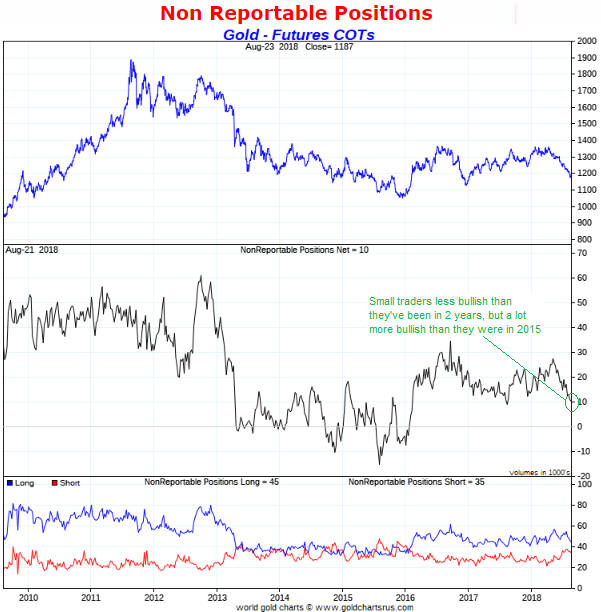
possibility of a catch-up move to the downside. The second was that the
"NonReportable" traders of oil futures (the proverbial dumb money) had
recently experienced a surge of bullish enthusiasm, exactly as happened
near important price tops in 2011, 2012 and 2014. The third was that the
Dollar Index had just broken out to the upside.
We wrote that it
could make sense for speculators to take a bearish oil position, although
a better entry point would be established by a near-term rebound to
$70-$71.
We also wrote:
"We caution that it is always
risky to bet against oil by purchasing a leveraged bear fund or shorting
the futures. The reason is that this is a market that can always rocket
higher in reaction to 'out of the blue' news such as a 'blow-up' in the
Middle East. A protective stop may not help in such a situation.
We
will be making the bet in our own account by purchasing USO January-2019
put options, and we possibly will add a USO January-2019 put option to the
TSI List if the oil price rebounds to around $70 in the near future."
The oil price subsequently dropped to its 200-day MA, where it found
support. It then rebounded and last Friday touched resistance in the form
of its 50-day MA. This is a reasonable place to establish the bet against
oil via the above-mentioned put options.
There are two main threats to a bearish oil speculation at this time.
The first is that the physical supply-demand situation remains supportive.
However and as noted two weeks ago, a correction to the mid-$50s could
occur in parallel with bullish fundamentals and in any case there is no
guarantee that the fundamental backdrop will remain supportive. Also, for
industrial commodities it is normal for the fundamentals to lag the price
at important turning points. The second threat is that the Dollar Index
may have already peaked on a short-term basis.
Despite these
threats we have gone ahead and added a USO (US Oil Fund) January-2019
$13.00 put option to the TSI List at US$0.39 (the option ended Friday's
session at ($0.38-$0.40). A daily USO chart is displayed below. Note that
for those with exposure to O&G stocks this USO put-option position could
be viewed as a hedge (short-term insurance) as well as a speculation.
By the way, although we think that the oil price is headed for a
decline to the mid-$50s or lower, we won't be surprised if the decline
doesn't begin in earnest until October. That's why we have selected
options with about 5 months to expiry. If the anticipated decline is going
to happen it should do so within this time frame.
The Stock Market
The SPX broke out to a new
all-time high last week, although on the following chart you may need a
magnifying glass to see it. Importantly, the breakout was confirmed by the
NYSE Advance-Decline Line, which is shown in the lower section of the
chart.
The bottom section of the next chart shows the TSI Put/Call Indicator
(TPCI). The TPCI is calculated by dividing the 10-day MA of the OEX
put/call ratio into the 10-day MA of the equity put/call ratio and
reflects the sentiment of the public (the dumb money) relative to the
sentiment of professional hedgers (the smart money). The lower the TPCI,
the more optimistic the dumb money relative to the smart money.
A
sell signal is generated when the TPCI moves below 0.30 (the bottom red
line) and a buy signal is generated when the TPCI moves above 0.80 (the
top red line). The buy signals have a higher success rate than the sell
signals, but TPCI sell signals tend to be meaningful when they occur in
parallel with 'overbought' market conditions. If a TPCI sell signal
happened in the near future it would, we think, be an important bearish
warning sign.
We are mentioning this now because the TPCI is not
far from its sell level.
Despite the obvious risks and the potential for a rare put/call sell
signal, it is best not to get enthusiastic about the US stock market's
short-term downside potential until the SPX breaks below the bottom of the
channel drawn on the chart displayed above and/or the NDX breaks below the
bottom of the channel drawn on the chart displayed below.
This week's
significant US economic events
[Notes:
1) The most important events
(to the markets) are shown
in bold. 2) A list of global economic events can be found
HERE]
| Date | Description |
| Monday Aug-27 | No important events scheduled |
| Tuesday Aug-28 |
Case-Shiller Home Price Index Consumer Confidence |
| Wednesday Aug-29 |
Pending Home Sales Q2 GDP (first revision) |
| Thursday Aug-30 | Personal Income and Spending |
| Friday Aug-31 |
Chicago PMI Consumer Sentiment Index |
Gold and the Dollar
Fundamentals Update
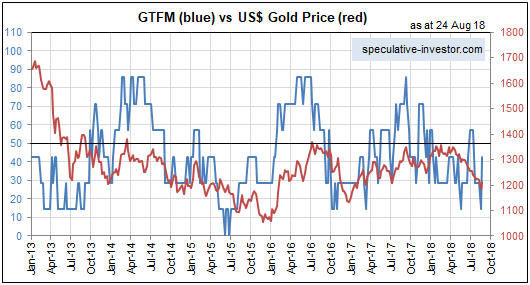
At the
end of last week our Gold True Fundamentals Model (GTFM) was still
bearish, but, as illustrated below, it bounced sharply last week from a
3-year low. This was due to two of the seven inputs (the real
interest-rate and the general commodity-price trend) switching from
bearish to bullish.
It wouldn't take much to shift the Model to
bullish. An extension of the T-Bond rebound would help, as would a
significant pullback in the US stock market.
The Monthly Price Action
It
takes at least five points to properly define a price channel -- at least
3 points on one side and at least 2 points on the other side. It has taken
a while, but as a result of this year's downward reversal from the
mid-$1350s there is now a well-defined channel on the monthly US$ gold
price chart (see below).
There should be plenty of evidence of a
long-term reversal to the upside before the channel top is breached, but
closing a month above the top of the downward-sloping channel that dates
back to the September-2011 all-time high would provide belated
confirmation of such a reversal.
After a new long-term upward trend
gets underway, corrections during intermediate-term rallies will be
limited in most cases by the 8-month MA (the black line on the following
chart).
The Short Term Price Action
The first real evidence that a short-term bottom is in place for the US$
gold price emerged on Friday 24th August via daily closes above initial
lateral resistance at $1210 and the 20-day MA.
Gold will encounter a lot of technical resistance as it attempts to
extend its rebound. For example, it overcame initial short-term resistance
on Friday, but there is additional short-term resistance a little higher
(near $1220) and then intermediate-term resistance at $1240.
Due to
the constructive sentiment situation, the nearby technical resistance
should cause nothing more than a pause for breath on the way to higher
prices as long as the fundamental backdrop continues to shift in gold's
favour. In this regard gold's prospects will be helped by an extension of
the T-Bond rebound, which looks likely. With stable inflation
expectations, a rise in the T-Bond price translates into lower real
interest rates.
The bottom line is that gold stands a good chance
of building on its recent upward reversal. As always we'll take the
evidence as it comes, but at this time the most reasonable assumption is
that we are dealing with a rebound that could last anywhere from a few
weeks to three months.
Further to the discussion earlier in today's
report, one thing that could transform a 1-3 month gold rebound into
something far more bullish would be an attempt by the Fed to steepen the
yield curve.
Gold Stocks
The gold-mining
sector, as represented on the following chart by the Gold Miners ETF
(GDX), hit some sort of low on Thursday 16th August. There was then an
unimpressive 4-day up-move followed by a plunge last Thursday (23rd
August) that retraced the bulk of the up-move and took GDX back to the
vicinity of its 16th August low. At this point the most bullish price
action would have entailed a spike to well below the 16th August low
followed by a reversal, while the most bearish price action would have
been a weak 2-day bounce that retraced only part of the 23rd August
decline. The aforementioned bearish development would have encouraged us
to re-establish an insurance position in the form of GDX put options
during the first half of this week.
As it turned out, the gold
sector's price action was somewhere between the bullish and bearish
patterns described above. It didn't set up the potential for a definitive
reversal by plunging below the 16th August low, but nor did it rebound
weakly. Instead, it rebounded strongly enough on Friday to hint that a
successful test of the 16th August low has occurred.
A lot of pundits will proclaim that a multi-month or longer-term
bottom is now in place. That could be the case, but there's no evidence to
support such an assessment. In fact, GDX could move as high as $21.00
(about 10% above Friday's close) over the next 2-3 weeks without
generating clear-cut evidence that the short-term decline is over.
It's worth noting that on 16th August GDX's daily RSI(14) hit its
second-lowest level in 10 years. This prompted us to write that regardless
of whether or not the short-term price decline was over, the decline's
momentum extreme was in place. It's also worth noting that GDX's lowest
daily RSI in 10 years occurred in July of 2015. The July-2015 RSI extreme
was followed by a multi-week price rebound to the 50-day MA and then a
fast decline that resulted in a test of the price low. Something similar
could be in store this time around.
Another plausible short-term
outcome is that a multi-month rally has begun.
We expect that the
fundamental backdrop, as indicated by the GTFM, will determine whether
there is a 2-3 week rebound to the 50-day MA or a much larger/longer rise.
If the GTFM turns bullish within the coming week or two then we probably
are dealing with a 2-3 month (or longer) rally, but if the GTFM stays
bearish then we probably are dealing with nothing more than a 2-3 week
bounce to resistance.
Of course, there is still the risk that a
plunge to new lows will precede either of the above-described up-moves,
but bullish traders could mitigate this risk by placing a stop slightly
below the 16th August low.
The Currency Market
The global US$ short position
According to the BIS, there is $3.7 trillion of US$-denominated
corporate debt across the "emerging markets". Also, total US$-denominated
debt issued by non-US non-financial corporations is $11.5 trillion. This
is sometimes referred to as the global US$ short position. The equivalent
euro-denominated debt amounts to 3.1 trillion, or less than one-third the
US$-denominated amount.
As we've explained a few times in the
past, the so-called "global US$ short position" always exists and
therefore is never the driver of currency-market trends. To put it another
way, regardless of whether the Dollar Index is immersed in a bull market
or a bear market there will be a huge global US$ short position.
It's just that when the US$ is strong the global US$ short position is
generally perceived to be a problem, because under these circumstances the
debt becomes more difficult to repay and widespread default becomes more
likely.
Fear of default by non-US issuers of US$-denominated debt
can prompt a wave of speculative US$ buying, as occurred a couple of weeks
ago in response to the brewing economic crisis in Turkey. While this adds
to the short-term upward pressure on the US dollar's value relative to
other currencies, US$ strength will always be more of a cause than an
effect of financial stress outside the US. The underlying cause of US$
(Dollar Index) strength is the combination of out-performance by the US
stock market and a widening real interest-rate differential in favour of
the US.
Current Market Situation
Knee-jerk reactions to news are disguising the trend.
A little
more than two weeks ago the Dollar Index (DX) broke above important
resistance at 95.5 on a daily-closing basis and 95.1 on a weekly closing
basis. This was partly a reaction to news of the worsening economic
situation in Turkey and the risk that it would create major problems for
several European banks. Then, during the first half of last week the DX
retreated to below its daily breakout point (95.5) and threatened to break
below 95 in reaction to the news that Michael Cohen, President Trump's
former lawyer, had pleaded guilty to bank fraud, tax fraud and campaign
finance violations. The concern was/is that Cohen will provide evidence
that leads to Trump's indictment or impeachment. On Thursday there was a
rebound possibly in anticipation of a 'hawkish' speech by Fed Chairman
Powell that was fully retraced on Friday, ostensibly in response to Powell
turning out to be more 'dovish' than expected. At the end of the week the
DX had dropped by enough to suggest that a short-term top (a top that
holds for 1-3 months) was in place, but had held its weekly breakout by
the slimmest of margins.
It will be interesting to see if the DX
can end the month of August above 95.1. Even if we are now dealing with a
short-term DX correction, a monthly close above 95.1 would be a
longer-term bullish signal for the US$.
The fundamentals are decisively in the DX's favour and as long as they
remain so we shouldn't expect something more than a short-term downward
correction. At the same time speculators are betting aggressively on
additional US$ strength, especially against the Swiss Franc (SF), the
Australian Dollar and the British Pound. This implies that the correction
could retrace more than half the gains made by the US$ from its Q1-2018
low to its recent high.
We continue to be optimistic about the SF's
short-term prospects. As mentioned in last week's Interim Update, it looks
like the SF is close to completing a multi-month base.
The SF can
be traded on the stock market via FXF, a chart of which is displayed
below. In the TSI List there is exposure to FXF in the form of a
September-2018 $96 call option.
There is still enough time for an
upside breakout in the SF to give a substantial boost to the price of our
September call option, but there is also a high risk that even if we are
right about the SF's basing pattern the upside breakout will happen too
late to be of benefit to this option. Consequently, if we were now taking
a new position we would choose an option with a December-2018 expiry date.
Updates
on Stock Selections
Notes: 1) To review the complete list of current TSI stock selections, logon at
http://www.speculative-investor.com/new/market_logon.asp
and then click on "Stock Selections" in the menu. When at the Stock
Selections page, click on a stock's symbol to bring-up an archive of
our comments on the stock in question. 2) The Small Stock Watch List is
located at http://www.speculative-investor.com/new/smallstockwatch.html
![]() Company
news/developments for the week ending Friday 24th August 2018:
Company
news/developments for the week ending Friday 24th August 2018:
[Note: AISC = All-In Sustaining Cost, FS = Feasibility Study, FY =
Financial Year, IRR = Internal Rate of Return, ISR = In-Situ Recovery,
MD&A = Management Discussion and Analysis, M&I = Measured and Indicated,
NAV = Net Asset Value, NPV(X%) = Net Present Value using a discount rate
of X%, NSR = Net Smelter Return, P&P = Proven and Probable, PEA =
Preliminary Economic Assessment, PFS = Pre-Feasibility Study]
*Sabina Gold and Silver (SBB.TO) reminded the market
about the good chance for resource expansion at its development-stage Back
River gold project in Canada's far north. It did this by reporting an
exceptional intercept of 39.5m grading 11.6-g/t from a hole drilled well
outside the existing resource. This counts as a new discovery and a
potentially-important one at that.
In addition to more drilling
results from Back River, SBB could have market-moving news within the next
three months relating to its silver royalty linked to the Hackett River
zinc-silver project owned by Glencore. We are referring to the fact that
if Glencore hasn't announced a production decision by October-2018 then
SBB will have the right to buy the project for what Glencore has spent on
it over the past few years.
SBB is a takeover candidate, with
Agnico Eagle (AEM) being the most likely acquirer.
*Tinka
Resources (TK.V) published its financial statements for the June
quarter. The statements showed that the company had about C$17M of working
capital at 30th June.
TK's current working capital should be enough
to fund the exploration of its 100%-owned Ayawilca zinc project in Peru
for the next 12 months.
![]() List
of candidates for new buying
List
of candidates for new buying
From within the ranks of TSI
stock selections the best candidates for new buying at this time, listed
in alphabetical order, are:
1) AAU (last Friday's closing price:
US$0.60)
2) CNL.TO (last Friday's closing price: C$3.53)
3)
PG.TO (last Friday's closing price: C$2.08)
4) PRQ.TO (last
Friday's closing price: C$1.06)
5) SBB.TO (last Friday's closing
price: C$1.41)
The above list is limited to five stocks. It will
sometimes contain less than five, but it will never contain more than five
regardless of how many stocks are attractively priced for new buying.
Chart Sources
Charts appearing in today's commentary
are courtesy of:
https://stockcharts.com/
http://www.goldchartsrus.com/