|
-- Weekly Market Update for the Week Commencing 28th January 2013
Big Picture
View
Here is a summary of our big picture
view of the markets. Note that our short-term views may differ from our
big picture view.
In nominal dollar terms, the BULL market in US Treasury Bonds
that began in the early 1980s will end by 2013. In real (gold)
terms, bonds commenced a secular BEAR market in 2001 that will continue
until 2014-2020. (Last
update: 23 January 2012)
The stock market, as represented by the S&P500 Index,
commenced
a secular BEAR market during the first quarter of 2000, where "secular
bear market" is defined as a long-term downward trend in valuations
(P/E ratios, etc.) and gold-denominated prices. This secular trend will bottom sometime between 2014 and 2020.
(Last update: 22 October 2007)
A secular BEAR market in the Dollar
began during the final quarter of 2000 and ended in July of 2008. This
secular bear market will be followed by a multi-year period of range
trading.
(Last
update: 09 February 2009)
Gold commenced a
secular bull market relative to all fiat currencies, the CRB Index,
bonds and most stock market indices during 1999-2001.
This secular trend will peak sometime between 2014 and 2020.
(Last update: 22 October 2007)
Commodities,
as represented by the Continuous Commodity Index (CCI), commenced a
secular BULL market in 2001 in nominal dollar terms. The first major
upward leg in this bull market ended during the first half of 2008, but
a long-term peak won't occur until 2014-2020. In real (gold) terms,
commodities commenced a secular BEAR market in 2001 that will continue
until 2014-2020.
(Last
update: 09 February 2009)
Copyright
Reminder
The commentaries that appear at TSI
may not be distributed, in full or in part, without our written permission.
In particular, please note that the posting of extracts from TSI commentaries
at other web sites or providing links to TSI commentaries at other web
sites (for example, at discussion boards) without our written permission
is prohibited.
We reserve the right to immediately
terminate the subscription of any TSI subscriber who distributes the TSI
commentaries without our written permission.
Outlook Summary
Market
|
Short-Term
(1-3 month)
|
Intermediate-Term
(6-12 month)
|
Long-Term
(2-5 Year)
|
|
Gold
|
Bullish
(17-Oct-12)
|
Bullish
(26-Mar-12)
|
Bullish
|
|
US$ (Dollar Index)
|
Neutral
(24-Dec-12)
|
Neutral
(09-Jan-12)
|
Neutral
(19-Sep-07)
|
|
Bonds (US T-Bond)
|
Neutral
(12-Nov-12)
|
Neutral
(18-Jan-12)
|
Bearish |
|
Stock Market
(DJW)
|
Bearish
(30-Jul-12)
|
Bearish
(28-Nov-11)
|
Bearish
|
|
Gold Stocks
(HUI)
|
Bullish
(24-Dec-12)
|
Bullish
(23-Jun-10)
|
Bullish
|
|
Oil |
Neutral
(30-Jul-12)
|
Neutral
(31-Jan-11)
|
Bullish
|
|
Industrial Metals
(GYX)
|
Neutral
(30-Jul-12)
|
Neutral
(29-Aug-11)
|
Neutral
(11-Jan-10)
|
Notes:
1. In those cases where we have been able to identify the commentary in
which the most recent outlook change occurred we've put the date of the
commentary below the current outlook.
2. "Neutral", in the above table, means that we either don't have a
firm opinion or that we think risk and reward are roughly in balance with respect to the timeframe in question.
3. Long-term views are determined almost completely by fundamentals,
intermediate-term views by
fundamentals, sentiment and technicals, and short-term views by sentiment and
technicals.
Gold stocks versus the
broad stock market - the wide-angle view
With the aim of putting the recent price
action into perspective, we present, herewith, a weekly chart showing how gold
mining stocks (represented by the BGMI) have performed over the long term
relative to the US stock market (represented by the SPX). The chart covers the
last two secular gold-stock bull markets and the intervening secular gold-stock
bear market.
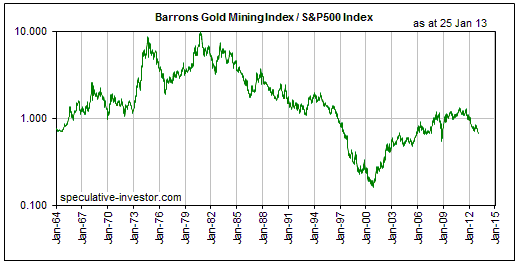
There were two major 'corrections' in the BGMI/SPX ratio during the course of
the bull market of the 1960s-1970s. The current correction, having gone further
than we thought it would, now looks similar to the first of the preceding bull
market's major corrections (the one that began in early-1968 and ended in
late-1972).
The BGMI/SPX ratio's first major correction of the preceding secular gold-stock
bull market ended just prior to the start of a 2-year cyclical decline in the
S&P500. Considering the way the gold mining sector and the broad US stock market
have traded in relation to each other over the bulk of the past 18 months, it's
not unreasonable to expect that the current major correction in the BGMI/SPX
ratio will also end near the start of a cyclical decline in general US equities.
At the end of last week there was obviously no sign that a general equity bear
market had begun. It could begin in the near future, but we recognise the
possibility that the current equity bull market could continue for longer than
we expect. It has already continued for longer than we expected.
Expectations regarding what a market is going to do in the future should be
based in part on the historical record. When we look at the long-term record we
see that cyclical equity bull markets that occur within secular equity bear
markets last anywhere from 1 year to 6 years. The average is 2-3 years. For
example, there were three cyclical bull markets during the secular equity bear
market that extended from the mid-1960s through to the early-1980s. The first
(1966-1968) and second (1970-1973) of these cyclical bulls lasted 2-3 years, but
the third (1974-1980) was an outlier with a duration of 6 years. The current
cyclical bull market will be four years old in March. This means that it is
already much older than average for a cyclical bull within a secular bear, but
still more than two years younger than the maximum age for a bull market of its
type.
What if the current equity bull market really 'pushed the envelope' and
continued for another 1-2 years? Under that unlikely scenario, would the start
of the gold sector's next major advance be pushed into the future by an
additional 1-2 years?
Not likely. Given the US stock market's moderately high valuation, two things
would have to happen for the equity bull market to have any chance of continuing
for another 1-2 years. First, there would have to be a lot of monetary
inflation. Second, there would have to be enough economic weakness and/or fear
of financial crisis to prevent the monetary inflation from creating effects that
collapse the T-Bond market. In other words, the set of circumstances that would
make it possible for the equity bull market to continue for another 1-2 years
would also be bullish for gold. In fact, the economic/monetary backdrop required
to perpetuate the equity bull market well beyond the short-term would be far
more bullish for gold than for general equities.
In summary, it presently looks like the start of the next major advance in the
gold-mining sector will roughly coincide with the end of the cyclical bull
market in general equities, but in any case the conditions that would make a
lengthy extension of the equity bull market possible would be bullish for the
gold sector.
The Stock
Market
The S&P500 Index made another marginal new
multi-year high on Friday 25th January. It has now closed higher for 8 days in
succession, but the cumulative gain over the course of this sequence of up-days
is only 2.2%. This must be one of the smallest cumulative gains for an 8-day
winning streak ever recorded by the S&P500, although for speculators not
participating in the rally it probably feels like the market is running away to
the upside.
Thanks to the September-January collapse in AAPL shares, the NASDAQ100 Index (NDX)
has fared much worse than the SPX over the past few months. Normally we would
consider this to be a very significant bearish divergence, but in this case we
are uncertain of the significance of the divergence because it is almost totally
due to a single stock.
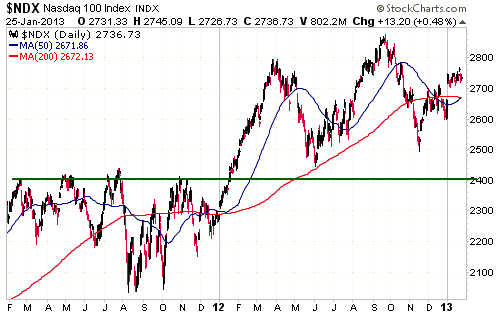
Putting aside any explanations for why the NDX's price chart (see below) looks
the way it looks, one interpretation of the chart that comes to mind is that
this index is still immersed in an intermediate-term correction that began last
September. If this interpretation is valid then the NDX's current short-term
upward trend will end well below the September-2012 high and be followed by a
decline to below the November-2012 low. Important support at around 2400 could
come into play within the next two months.
One of the props supporting the on-going stock market rally is the belief that a
sustainable recovery is in progress in the European banking industry. This
belief was seemingly given some validation last week by news that European banks
had collectively repaid more of their LTRO (Long-Term Refinancing Operation)
borrowings than expected.
European banks remain highly leveraged. On average their balance sheets are a)
far more leveraged than those of their US counterparts and b) not in materially
better shape today than they were in 2008-2009, making these banks far more
vulnerable to a future reversal of the 'positive' price trends in the financial
markets. Leverage is good as long as prices are moving in the right direction.
It's only after prices start heading in the opposite direction that leverage
becomes a problem.
This week's
important US economic events
| Date |
Description |
| Monday Jan 28 |
Pending Homes Sales Index
Durable Goods Orders
Dallas Fed Mfg Survey
| | Tuesday Jan 29 |
Case-Shiller Home Price Index
Consumer Confidence | | Wednesday
Jan 30 |
FOMC Announcement
Q4 GDP | | Thursday
Jan 31 |
Personal Income and Spending
Employment Cost Index
Chicago PMI
|
| Friday Feb 01 |
Monthly Employment Report
ISM Index
Motor Vehicle Sales
Consumer Sentiment
Construction Spending
|
Gold and
the Dollar
Gold
Wood versus Metal
One of the surest ways to generate losses in the financial markets is to do in
the present what you wish you had done over the preceding 12 months. The future
is always uncertain, but an investor who tends to get bullish after a period of
substantial outperformance and bearish after a period of substantial
underperformance is probably not going to do well over the long-term.
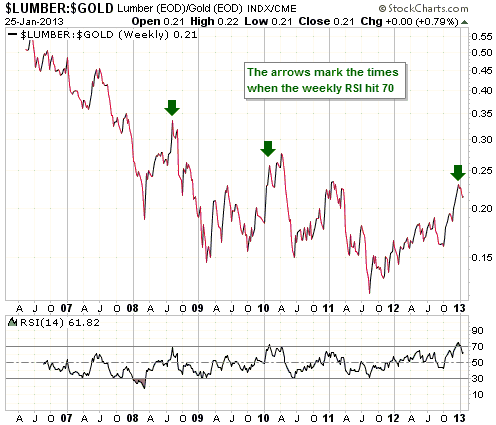
Take the lumber/gold ratio (the performance of the lumber market relative to the
performance of the gold market) as an example. While there was no way of
knowing, in advance, exactly where and when an intermediate-term turning point
would occur, the fact is that by August of 2011 lumber had become very
'oversold' relative to gold. This is evidenced by the unusually low level of the
RSI shown at the bottom of the following weekly chart. It wasn't obvious in
August of 2011 that the ratio was about to bottom and embark on a strong rally
lasting more than 12 months, but it was obvious in August of 2011 that it was a
bad time to be turning bearish or becoming more bearish on lumber relative to
gold.
After reaching an 'oversold' extreme in August of 2011, the lumber/gold ratio
reached an 'overbought' extreme late last year. In fact, the weekly RSI suggests
that lumber/gold became more 'overbought' late last year than it had been at any
time over the preceding seven years. We don't know that last year's peak in the
lumber/gold ratio will turn out to be the major variety. We guess that it will,
be we obviously have no way of knowing for sure. What we do know is that this is
a really bad time to be turning bullish, or getting more bullish, on lumber
relative to gold.
Current Market Situation
Below is a daily chart of gold in euro terms (gold/euro). When gold/euro was
peaking in September of last year we thought that it would experience a routine
short-term correction to no lower than its 200-day moving average before
resuming its advance, but the correction has clearly gone longer and deeper than
originally expected. The correction has even managed to break gold/euro below
the upward-sloping trend-line that dates back to September-October of 2011.
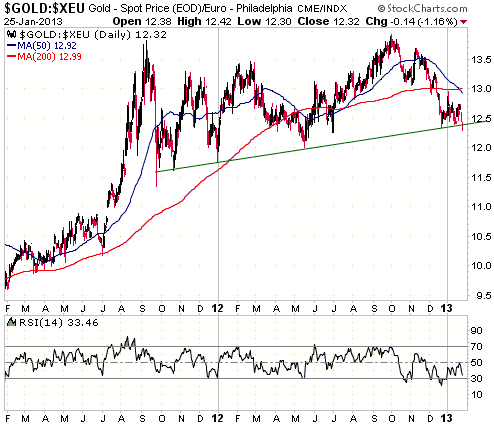
The trend-line break is confirmation of the obvious: that the correction has
gone deeper than expected. However, it doesn't tell us anything about the
future. As far as we can tell, there was only one similar trend-line break in
gold/euro over the past 10 years. It happened in late-2004, just prior to the
start of an 18-month rally.
After rebounding for a short while gold is again becoming very 'oversold' in
both euro and US$ terms. A short-term bottom is likely by early February.
Gold Stocks
With economic confidence on the rise and general risk aversion on the decline it
is not surprising that the gold market has been unable to sustain a rally and
has just moved back to near the bottom of its 5-month range in both US$ and euro
terms. What is surprising is the extent of the recent weakness in the gold
mining sector. Gold mining stocks are riskier than gold bullion and should
therefore hold up better than gold when the financial world is becoming less
risk averse.
The gold sector is in the midst of a short period when nothing matters except
the price action. The sector's inability to rally caused frustrated shareholders
to sell, which made the price action look worse, which prompted more selling,
etc. When the HUI eventually broke below support at 420 last week the selling
quickly intensified. We are now witnessing a capitulation.
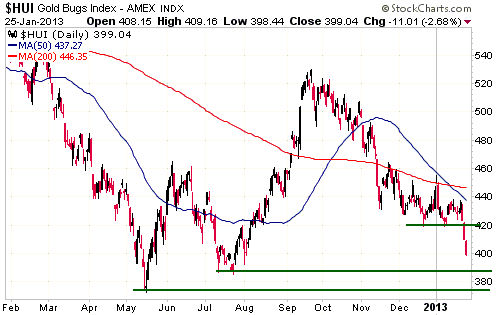
A re-test of the HUI's May-2012 low became an even-money bet after the November
low was breached in early December. A re-test of the May-2012 low is now a
high-probability outcome, but it won't necessarily happen right away. One
possibility is that the capitulation will continue, resulting in the May-2012
low being tested this week or the week after. If this happens then the low that
gets put in place over the next two weeks will probably turn out to be the low
for the year. A plausible alternative is that the HUI reverses upward without
first experiencing significant additional weakness. If this happens then there
will probably be a 4-6 week rebound followed by a decline to test the May-2012
low.
Currency Market Update
The primary fundamental basis for speculative Yen selling was shattered when the
BOJ announced early last week that although it would embrace the government's 2%
"inflation" target, it would do nothing different in an effort to attain the
target and didn't expect the target to be reached within the next two years.
However, the Yen continued its rapid decline after briefly trying to rebound.
When currency speculators get the 'bit between their teeth' and one fundamental
story in support of the desired price action doesn't pan out, they tend to find
another story to replace it. The potential for the BOJ's plans to change after
new board members are appointed in April is a story that can now be used to
support a bearish Yen view, as is the widening Japanese trade deficit. These
stories seem plausible as long as you ignore the fact that the Yen is being
aggressively sold against currencies that are already being inflated like crazy
(no need for any new board members at the Fed in order to get a pro-inflation
consensus) and are associated with much larger trade deficits.
As an aside, if Japan's government wants to eliminate the country's trade
deficit then the quickest and least-damaging way for it to do so would be
restart most of the nuclear power plants that were shut down in 2011 in an
ill-considered knee-jerk reaction to the Fukushima disaster. To make up for the
power generation capacity lost when the nuclear power plants were shut down,
Japan has drastically increased the amount of liquid natural gas (LNG) that it
imports. We calculate that the increase in LNG imports since Fukushima accounts
for about 35% of last year's record 6.9 trillion Yen (US$78B) Japanese trade
deficit, and that the total monetary value of Japan's LNG imports during 2012
was about 90% of the country's trade deficit for the year.
One interesting aspect of the currency market's situation is that sentiment is
now almost diametrically opposite to what it was last July. Speculators were
extremely pessimistic about the euro's prospects just 6 months ago, but they are
now optimistic. Speculators are now extremely pessimistic about the Yen's
prospects, but 6 months ago they were optimistic. As it almost always does, the
market's sentiment has simply followed the price. The average speculator gets
increasingly optimistic as the price rises and increasingly pessimistic as the
price falls, causing him to reach extremes of optimism and pessimism at
inopportune times.
It is worth pointing out, however, that while Yen sentiment is at a pessimistic
extreme, euro sentiment hasn't yet reached an optimistic extreme. This doesn't
preclude the possibility that the euro is near an intermediate-term peak, it
just means that euro sentiment is not yet flashing a warning signal.
Another interesting aspect of the currency market's situation is that recent US$
weakness against the euro has largely been offset by US$ strength against most
other currencies. With the US$ falling against the euro and rising against
almost all other currencies, the Dollar Index, which is dominated by the USD/EUR
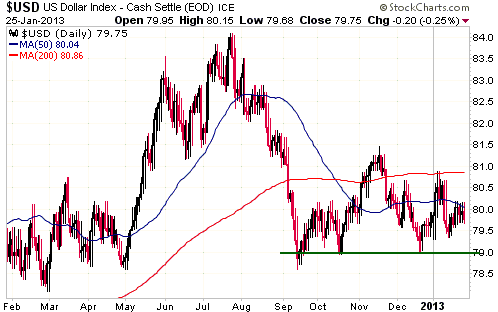
exchange rate, has traded sideways. This sideways trading in the Dollar Index
will probably soon give way to a quick 3-point move, but we currently don't have
an opinion on the most likely direction of this move. If the Dollar Index drops
below support at 79 it will indicate that a 3-point move to the downside is
underway.
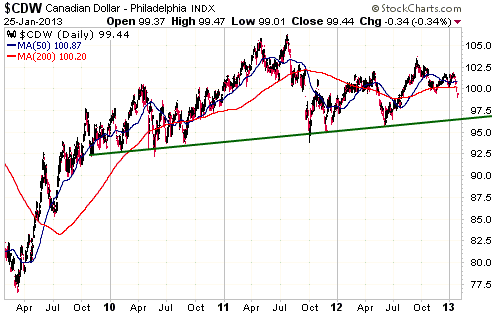
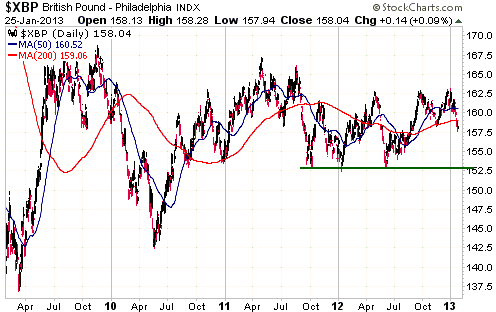
Below are daily charts showing the performances of the Canadian Dollar and the
British Pound over the past 4 years. Both of these currencies traded at 5-month
lows late last week, but on a longer-term basis they remain within wide
consolidation ranges. The C$ has strong support at around 97 and the Pound has
strong support in the low-1.50s. These support levels probably define the
maximum short-term downside potential.
Update
on Stock Selections
Notes: 1) To review the complete list of current TSI stock selections, logon at
http://www.speculative-investor.com/new/market_logon.asp
and then click on "Stock Selections" in the menu. When at the Stock
Selections page, click on a stock's symbol to bring-up an archive of
our comments on the stock in question. 2) The Small Stock Watch List is
located at http://www.speculative-investor.com/new/smallstockwatch.html
 Company
news/developments for the week ended Friday 25th January 2013: Company
news/developments for the week ended Friday 25th January 2013:
[Note: FS = Feasibility Study, IRR = Internal Rate of Return, MD&A =
Management Discussion and Analysis, M&I = Measured and Indicated,
NAV = Net Asset Value, NPV(X%) = Net Present Value using a discount
rate of X%, P&P = Proven and Probable, PEA = Preliminary Economic
Assessment, PFS = Pre-Feasibility Study]
*Dragon Mining (DRA.AX) provided an update on exploration work at
its Kuusamo project in Finland. Kuusamo is expected to be the main
contributor to DRA's production growth over the next few years.
Last week's press release reported a few decent intercepts from
recent drilling at Kuusamo. The press release also noted that the
drilling hasn't expanded the defined resource, although the
confidence level of the resource has increased due to the upgrading
of Inferred resources to the M&I category. The total Kuusamo
resource amounts to 460K ounces of gold, 320K ounces of which are
now classified as M&I.
The overall progress of Kuusamo's development is slower than we'd
like, but we can afford to be patient with DRA as long as its
existing mines generate at least enough cash to cover all costs. An
update on the performance of DRA's existing mines is due within the
next two weeks.
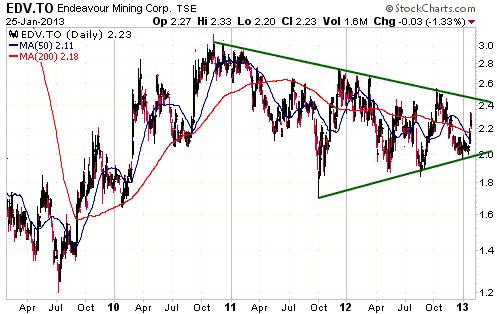
*Endeavour Mining (EDV.TO, EDR.AX) reported its production results
for 2012 and its guidance for 2013. Total production from its three
operating gold mines (Youga in Burkina Faso, Nzema in Ghana and
Tabakoto in Mali) came in at 311K ounces in 2012, which was slightly
better than forecast. The company didn't advise the cost of
production other than to say that it was within the guidance range.
This probably means that the average cash cost was around $680/oz.
2013 guidance is for production of 310K-345K ounces of gold at a
cash cost of $790-$830/oz. The annual production rate should then
increase by about 100K ounces in 2014 due to a new mine (the Agbaou
mine in Cote d'Ivoire) coming into operation.
The 2013 and 2014 guidance from EDV is consistent with what we've
been assuming when valuing the stock. Our valuation is based on a
gold price of $1600/oz and remains at around C$4.00/share.
EDV also reported the results of a PEA for the Hounde project in
Burkina Faso. The Hounde project was part of Avion Gold, the company
that EDV acquired last October.
The PEA suggests the potential for Hounde to be developed into a
160K-oz/year gold mine by 2016, taking EDV's total annual production
to 550K-600K. The economics look good: Post-tax NPV(5%) and IRR of
$584M and 34% at a gold price of $1650/oz. The total initial
start-up capital is estimated to be $345M, an amount that could be
funded by EDV's cash reserve, existing credit facility and cash flow
from its operating mines.
Work has commenced on the Hounde project's FS.
The EDV story continues to evolve in a positive way. The company is
meeting its targets on the production front and taking prudent steps
to grow its business over the next few years.
The stock rallied last week on the back of the positive news
releases and would have rallied a lot more if not for the pronounced
sector-wide weakness. If the sector-wide sell-off continues then EDV
could again become available in the low-C$2.00 area. If so, anyone
without a full position should view it as a buying opportunity.
*Golden Predator (GPD.TO) issued two press releases last week,
neither of which was important.
The first press release was issued at the behest of Canadian
regulators to "clarify and retract certain technical disclosure". In
a nutshell, GPD provided information via interviews and
presentations that wasn't covered in the regulatory reports
submitted by the company. This, apparently, is a no-no. It seems
that aside from information vetted and signed-off by government
representatives, the public is supposed to be kept in the dark
regarding the plans of listed corporations. For the public's own
good, of course.
The only part of GPD's first press release that had any significance
to us was the following sentence:
"The Company has engaged EBA Engineering Consultants Ltd. to
prepare a preliminary feasibility study on the Project, which is
currently expected to be available in the second quarter of 2013."
To our eyes this looks like a delay, but whether it is or not
depends on the meaning of "early". GPD had previously said that the
PFS would be available in early-2013, which we took to mean in Q1.
Maybe in the north of Canada where the winters are long and
oppressive, early can mean any time before the middle.
The second press release announced that high-grade gold had been
discovered in rock samples taken from one of GPD's many properties
in the Yukon. Nobody cares about rock samples.
Last week's most important GPD-related development was the late-week
pullback in the stock price in sympathy with the HUI's breakdown.
GPD's price had moved up from C$0.33 to C$0.39 during the first two
days of last week in reaction to the very positive news announced
after the close of trading on Friday 18th January, but a large
sector-wide decline has since created another good opportunity to
buy at around C$0.35. At this price we think that buyers of the
stock are getting the royalty assets at around 50% of fair value and
the Yukon assets for free.
*Jaguar Mining (JAG) announced after the close of trading last
Friday that it had drawn down the first $5M of the $30M credit
facility provided by Renvest. This was expected.
JAG shares were volatile last week. The stock gained 32% (from
US$0.75 to US$0.99) last Monday on heavy volume and then dropped
back in sympathy with the sharp sector-wide decline during
Wednesday-Friday, but still managed to end the week with a net gain
of about 15%. We don't know the reason for the sudden interest in
JAG.
*Pretium Resources (PVG) announced that it was raising $20M by
issuing 1.57M new flow-through shares at an average price of
$12.74/share. This small financing tops-up PVG's treasury and
guarantees that the company will not run short of funds this year.
In the short-term PVG is probably what stockbrokers call a "sector
perform", meaning that it will probably trade in line with the
overall sector as represented by indices such as the HUI and the XAU.
This is because the next piece of important company-specific news
isn't due until the second quarter of this year. We are referring to
the FS for the Brucejack high-grade project. If the FS is very
positive (we think it will be) it should give the stock price a
hefty boost and could prompt a large mining company to make a
takeover bid.
*Ramelius Resources (RMS.AX) reported disappointing results for
the final quarter of last year. Last quarter's production quantity
of 20K ounces was roughly according to forecast, but costs were much
higher than we (and the market) were expecting. Of particular
importance, the cash cost of quarterly production at the newly
commissioned Mt Magnet mine -- the mine from which almost all of
RMS's production will be sourced during the 2013 calendar year --
was $1199/oz. Although this is $4/oz lower than the preceding
quarter's result, we thought that the production ramp-up at Mt
Magnet would lead to a much larger cost reduction. Specifically, we
were anticipating a decline in the per-ounce cost to around $1000/oz
during Q4-2012, with further improvement to come during the first
half of 2013.
RMS was expected to be cash-flow positive during the December
quarter, but due to the surprisingly high cost of production at Mt
Magnet the company burned through another $5M of its cash. However,
it still has $50M of cash along with no debt, so its balance sheet
remains healthy.
The company's guidance is for 20K ounces of production in each of
the next two quarters, with 16.5K ounces of the March quarter's
production and all of the June quarter's production sourced from Mt
Magnet. Sustained quarterly production of this magnitude would
justify a 100% higher stock price IF the per-ounce cash cost were
reduced to less than $1,000.
With upside potential of at least 100% at the current gold price and
downside risk limited to around 15% by the combination of the low
valuation, the low political risk and the strong balance sheet, we
are going to give RMS another quarter to prove itself.
*UEX Corp. (UEX.TO) announced that it had optioned its non-core
Black Lake uranium project in northern Saskatchewan to Uracan
Resources (URC.V). To earn a 60% interest, URC will have to spend
$10M exploring the project over the next 10 years.
This is a smart move by UEX as it now has no-risk exposure to
exploration success at Black Lake.
*Volta Resources (VTR.TO) reported a big increase in the resource
for its Gaoua copper/gold project in Burkina Faso. The project is
now estimated to contain a total of 3.4M ounces of gold and 2.1B
pounds of copper, almost all in the Inferred category. This
constitutes an increase of about 180% over the previous estimate.
The magnitude of the resource increase in very impressive, but the
resource grade is very low. This type of mineral deposit could
become valuable in the distant future, but it is not going to garner
much interest anytime soon.
As we've previously stated, VTR should focus all of its limited
financial resources on progressing the FS for the Kiaka project.
That's where the opportunity to create shareholder value lies.
 Potential
Agnico Eagle (AEM) call option opportunity Potential
Agnico Eagle (AEM) call option opportunity
One of the few trades that worked well for us in 2012 was a long position in AEM
January-2014 call options. A new opportunity to buy AEM calls could arise this
week.
Due to the indiscriminate sell-off in all things gold-mining-related, AEM's
stock price dropped sharply over the final three days of last week. It's
certainly possible that AEM has just reached a short-term bottom near its
200-day moving average, but our suggestion is to buy AEM Jan-2014 $50 call
options if the capitulation continues and the stock drops to around $43 during
the course of this week. With the stock at around $43 the aforementioned call
options would probably trade at around $3.30, but $3.50 or lower would be a
reasonable price to pay.
AEM is a relatively expensive gold stock, but it is in the process of winning
back its 'market darling' status and stands a good chance of rebounding strongly
in the early part of the gold sector's next rally. This is regardless of whether
the next rally is a counter-trend rebound or the first leg of a new major upward
trend.
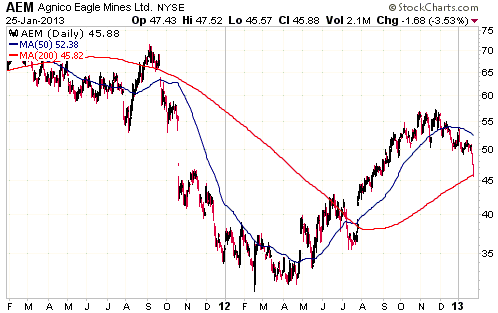
Chart Sources
Charts appearing in today's commentary
are courtesy of:
http://stockcharts.com/index.html

|

