|
-- Weekly Market Update for the Week Commencing 28th March 2005
Big Picture
View
Here is a summary of our big picture
view of the markets. Note that our short-term views may differ from our
big picture view.
Bonds commenced a secular BEAR market in
June of 2003. Bond prices will move considerably lower (long-term
interest rates will move considerably higher) during 2005. (Last
update: 29 November 2004)
The stock market, as represented by the S&P500 Index, commenced a secular BEAR market during the first quarter of 2000. The rally that
began in October of 2002 will end during the first half of 2005 and the October-2002
bottom (775 for the S&P500) will be tested during 2006. (Last update: 29 November 2004)
The Dollar commenced a secular BEAR market during the final quarter of 2000. The
first major downward leg in this bear market ended during the first
quarter of 2005, but a long-term bottom won't occur until 2008-2010. (Last update: 28 March 2005)
Gold commenced a secular BULL market during 1999-2001. The first major upward leg in this bull market ended in December of 2004, but a long-term
peak won't occur until 2008-2010. (Last update: 28 March 2005)
Commodities, as
represented
by the CRB Index, commenced a secular BULL market in 2001. The first
major upward leg in this bull market ended during the first quarter of
2005, but a long-term
peak won't occur until 2008-2010. (Last update: 28 March 2005)
Copyright
Reminder
The commentaries that appear at TSI
may not be distributed, in full or in part, without our written permission.
In particular, please note that the posting of extracts from TSI commentaries
at other web sites or providing links to TSI commentaries at other web
sites (for example, at discussion boards) without our written permission
is prohibited.
We reserve the right to immediately
terminate the subscription of any TSI subscriber who distributes the TSI
commentaries without our written permission.
Outlook Summary
Market
|
Short-Term
(0-3 month)
|
Intermediate-Term
(3-12 month)
|
Long-Term
(1-5 Year)
|
Gold
|
Bearish
(23-Mar-05)
|
Neutral
(6-Dec-04)
|
Bullish
|
US$ (Dollar Index)
|
Bullish
(20-Dec-04)
| Bullish
(31-May-04)
|
Bearish
|
Bonds (US T-Bond)
|
Bearish
(09-Mar-05)
|
Bearish
(20-Sep-04)
|
Bearish
|
Stock Market (S&P500)
|
Bearish
(05-Jan-05)
|
Bearish
(05-Jan-05)
|
Bearish
|
Gold Stocks (HUI)
|
Bearish
(23-Mar-05)
|
Bearish
(01-Dec-04)
|
Bullish
|
General Commodities (CRB)
|
Bearish
(23-Mar-05)
|
Bearish
(23-Mar-05)
|
Bullish
|
Notes:
1. In those cases where we have been able to identify the commentary in
which the most recent outlook change occurred we've put the date of the
commentary below the current outlook.
2. "Neutral", in the above table, means that we either don't have a
firm opinion on which way the market will move or that we expect the
market to be trendless during the timeframe in question.
3. Long-term views are determined almost completely by fundamentals,
intermediate-term views by giving an approximately equal weighting to
fundmental and technical factors, and short-term views almost
completely by technicals.
Revisions to Big Picture Views
We've made the following
small, but significant, alterations to the big picture views included
at the top of every Weekly Market Update:
1. For the dollar we've changed "The first major downward leg in this
bear market will end during the first half of 2005..." to "The first
major downward leg in this bear market ended during the first quarter
of 2005..."
2. For gold we've changed "The first major upward leg in this bull
market will end during the first quarter of 2005..." to "The first
major upward leg in this bull market ended in December of 2004..."
3. For commodities (the CRB Index) we've changed "The first major
upward leg in this bull market will end during the first half of
2005..." to "The first major upward leg in this bull market ended
during the first quarter of 2005..."
In other words, we've made a partial alteration to the tense of the
wording for our US$, gold and commodities views to reflect the
likelihood that an important low is in place for the dollar and that
important highs are in place for gold and commodities.
Commodities
From the 28th February Weekly Market Update: "In
our opinion, what is presently underway is a final blow-off to the
upside in the prices of some commodities and many commodity-related
equities. It's impossible for us to confidently predict how much
further these moves will go before the inevitable downturn gets
underway, although our guess is that major peaks will be in place
before the end of March. What we can say with confidence is that the
decline that follows the speculative blow-off will take back all gains
achieved during the blow-off stage plus a lot more."
We'll deal with commodities in more detail in this week's Interim
Update and at this time will simply note that last week's breakdown in
the bond/dollar ratio (discussed later in today's report) suggests that
an intermediate-term peak is now in place.
The Stock
Market
The stock market versus the dollar
...if
the US$ continues to move higher -- we think it will, perhaps after
consolidating its recent gains -- then the head-wind facing the stock
market will become increasingly strong due to a contraction in global
liquidity.
As mentioned on several previous occasions, our view is that a US$
rally represents a much greater threat to the US stock market than does
a continuing fall in the dollar. The reason is that over the past 2-3
years a falling dollar has been synonymous with rising financial-market
liquidity, a result of which has been that global stock markets in
general and the US stock market in particular have had an INVERSE
correlation to the Dollar Index. Therefore, if the US$ continues to
move higher -- we think it will, perhaps after consolidating its recent
gains -- then the head-wind facing the stock market will become
increasingly strong due to a contraction in global liquidity. It is
reasonable to expect that almost all shares would be adversely affected
by such an outcome, but the commodity-related shares that led the
market higher between the second quarter of 2003 and the first quarter
of 2005 are likely to be amongst the biggest losers. The homebuilders
and REITs are also likely to suffer large declines because they have
been primary beneficiaries of the rising-liquidity backdrop.
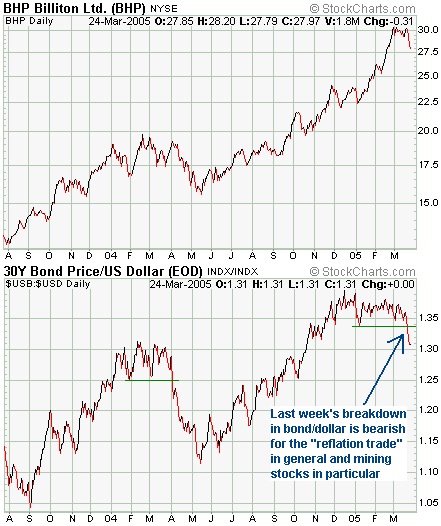
Zooming in on the commodity-related equities, in many previous
commentaries we've noted the strong positive correlation between the
bond/dollar ratio (the T-Bond price divided by the Dollar Index) and
the shares of mining companies. In order to illustrate this correlation
we have, in the past, often compared the stock price of copper producer
Phelps Dodge (PD) with bond/dollar, but for the sake of variety (the
spice of life, it is said) we've decided to use BHP Billiton (NYSE and
ASX: BHP) in today's chart comparison (see below). BHP is the world's
largest mining company so it is a good proxy for the sector.
With reference to the below chart, at this stage the recent pullback in
the BHP stock price doesn't look any different to the other pullbacks
that occurred within the up-trend that began in May of last year.
However, there's a good chance it will evolve into much more than just
a routine 'pause for breath' because a) it was preceded by an
accelerated advance (an upside blow-off), and b) we have just had the
most significant downward move in the bond/dollar ratio since the
beginning of April last year.
Current Market Situation
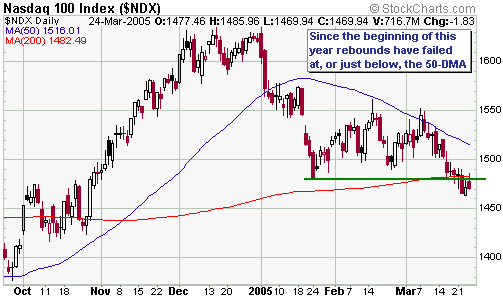
The NASDAQ100 Index (NDX) closed below important support at the end of
last week, but not far enough below that this support level is likely
to act as significant resistance should a rally get started in the near
future. In our opinion a rebound is likely to begin within the next few
days, but we doubt that it will get very far. The other rebounds that
have occurred since early January have failed near the 50-day moving
average, so if we make the assumption that an intermediate-term decline
is in progress (a reasonable assumption, in our opinion) then this
moving average will probably continue to act as resistance.
The oil market
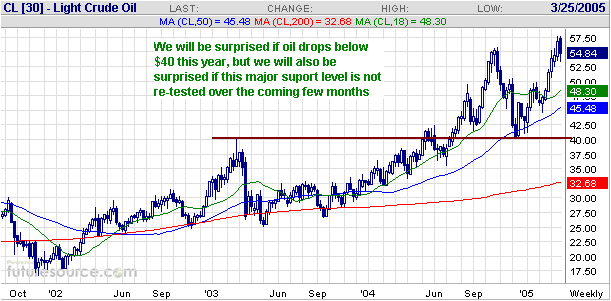
continues to be one of the two biggest short-term influences on the
stock market, the other being interest rates. The oil price, however,
is probably close to an important high, which means that the oil market
has the potential to change from being a negative influence to being a
positive one. A sharp decline in the oil price could result in quite a
feisty recovery in the stock market, but given the technical damage
that has been done over the past few weeks we suspect that even a drop
in the oil price to the mid-40s wouldn't be sufficient to push the
senior stock indices to new highs for the year.
Below is a chart
showing the percentage of NYSE stocks above their 200-day moving
averages. Over the past several years the major lows in the stock
market have coincided with this percentage dropping to around 20
whereas last year's intermediate-term low coincided with a drop to
around 45. At the end of last week 64% of NYSE stocks were above their
200-day moving averages, so although the market looks oversold on a
short-term basis it does not yet appear to be close to an
intermediate-term low.
This week's
important US economic events
| Date |
Description |
Monday Mar 28
| No significant events
|
Tuesday Mar 29
| Consumer Confidence
|
Wednesday Mar 30
| Q4 2004 - Final GDP number
|
Thursday Mar 31
| Personal Spending and Income
Factory Orders
|
Friday Apr 01
| Employment Report
Construction Spending
|
Gold and
the Dollar
Gold Stocks
Intermediate-term Outlook
...nothing
has yet happened to make us doubt our intermediate-term bearish view on
the gold sector. ...strength or weakness in the gold stocks relative to
gold bullion might not be as significant over the next few years as it
was over the past few years...
We are long-term bulls on the gold sector but over the past four months
our intermediate-term outlook has differed markedly from the outlooks
of most other long-term gold bulls, the main differences being:
a) None of the other long-term bulls we know of have been seriously
considering the prospect of the HUI dropping below its May-2004 low
(164) during 2005 whereas we have considered a decline of this
magnitude to be one of the two most likely outcomes (the two outcomes
are re-visited later in this section).
b) Over the past few weeks the majority view has been that the gold
sector had embarked on a major new upward leg, but at no stage during
the fairly predictable bounce that began during the first half of
February did we believe that this was a probable outcome. For example,
in the 9th March Interim Update, with the HUI trading in the mid-220s,
we said "...if we were forced to
come up with a number we'd say the probability that a major new upward
leg is currently underway is no more than 10%."
But regardless of how confident we are we always need to consider the
possibility that we are wrong because there is always a significant
degree of uncertainty when it comes to the future. Furthermore, there
is always the possibility that the facts will change (we will be quick
to alter any of our views if the facts no longer support such a view).
With this in mind we described, in the 9th March Interim Update, two
things that would potentially constitute significant-enough changes in
the facts to cause us to upgrade our intermediate-term outlook on the
gold sector.
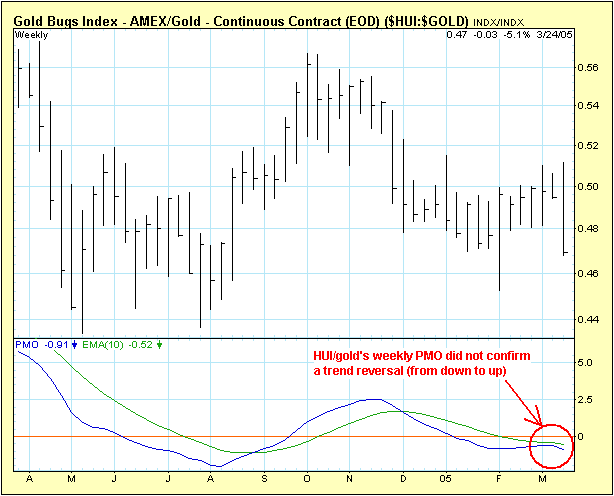
The first of these potential 'outlook changers' was described as "confirmation
of a weekly trend reversal in the HUI/gold ratio where such
confirmation was defined as the Price Momentum Oscillator (PMO) moving
above its 10-week moving average." The below chart, however,
shows that the HUI/gold's weekly PMO has just turned down without
crossing above its 10-week MA. This is evidence that the
intermediate-term downward trend is still in progress.
The second potential 'outlook changer' was described as follows:
"...a sizeable pullback
in the HUI -- to the low-200s, for instance -- that does not result in
the HUI/gold ratio moving decisively below its 40-day moving average.
This would be a bullish development because, as the following chart
shows, during the previous major upward legs every test of the
HUI/gold's 40-day MA was successful with solid breaks below the 40-day
MA only ever occurring at the very ends of upward legs and during the
intermediate-term corrections. That is, if HUI/gold were able to hold
at or above its 40-day MA during the next significant pullback the
pattern would be consistent with what was seen during previous upward
legs. By the same token, a solid break below the 40-day MA by this
ratio would be a very clear signal that the correction that began in
December of 2003 was still in progress."
The HUI has since experienced a sizeable pullback and the following
chart shows that this pullback has resulted in the HUI/gold ratio
making a solid break below its 40-day MA. In other words, the action is
consistent with our intermediate-term bearish outlook.
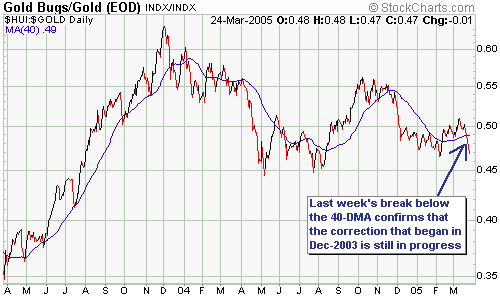
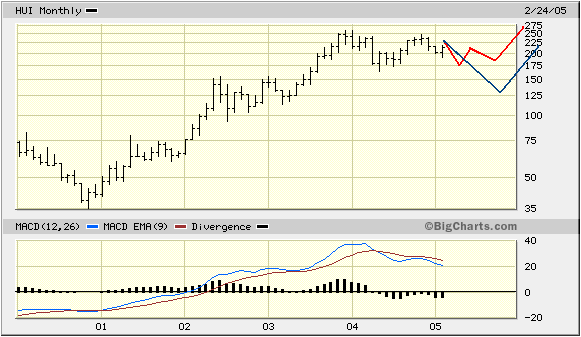
So, last week's
confirmation of our intermediate-term bearish view means that the two
scenarios outlined in previous commentaries continue to be the two most
likely outcomes. The below chart, which was originally included in the
28th February Weekly Market Update, illustrates these scenarios. In
both cases the correction extends well into the second half of this
year, the difference being that under the "red scenario" the HUI
remains within a wide range bounded by its May-2004 low and its
Nov-2004 high while the "blue scenario" involves a drop to well below
the May-2004 low.
The bottom line is
that nothing has yet happened to make us doubt our intermediate-term
bearish view on the gold sector. This doesn't mean, though, that we are
necessarily going to be right (when it comes to the future we are
always dealing in probabilities). What it does mean is that if we are
right, and assuming we are correct to be long-term bulls, then our
readers will hopefully be emotionally and financially prepared for
what's in store. On the other hand, if it turns out that we are wrong
to be intermediate-term bearish then anyone who pays attention to us
will probably suffer an opportunity cost (they will make less money
than if they'd remained fully exposed to the gold sector). The
opportunity cost shouldn't be that great, however, because we won't
stay bearish if the facts change.
On a side note, over the 3+ years that we've used the HUI/gold ratio it
has proven to be a very good (the best, in our opinion) leading
indicator of trends in gold stocks and gold bullion, and as long as it
continues to work well we will continue to use it. It has worked so
well because gold stocks have invariably demonstrated strength relative
to the metal throughout the intermediate-term advances and relative
weakness throughout the intermediate-term declines; however, if the
current secular bull market in gold follows roughly the same pattern as
the secular bull market of the 1960s and 1970s then this indicator's
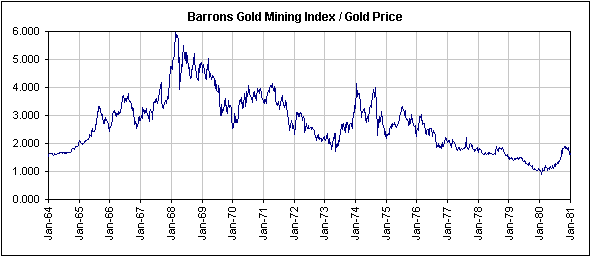
usefulness will decline over the coming years. To show what we mean by
this we've included, below, a chart showing the BGMI/gold ratio (the
Barrons Gold Mining Index divided by the gold price) from the beginning
of 1964 through to the end of 1980. Notice that the major gold stocks
represented by the BGMI dramatically out-performed the metal prior to
1968 and dramatically under-performed thereafter (the major gold stocks
trended LOWER relative to gold during the great bull run of the 1970s).
And notice, in particular, that during the final 3 years of the gold
bull market (1977-1980) the BGMI fell by 50% relative to gold bullion.
We can think of a few
reasons why the major gold stocks under-performed gold bullion during
the 1970s. For one thing, by 1968 the stocks had been bid up to very
high levels in anticipation of a large upward move in the gold price.
For another thing, the supply of shares can be increased quickly and
cheaply to take advantage of a bull market whereas increasing the
supply of physical gold is a slow and costly process. Lastly, the
general shift away from financial assets and towards tangible assets
that occurred during the 70s would have favoured gold bullion over gold
shares. The point is, it is not difficult for us to imagine something
similar happening over the next few years because a) gold stocks were
bid up to very high levels relative to the gold price during 2001-2003,
b) brokerage houses and promoters will almost certainly be just as
quick in the future as they have been in the past to increase the
supply of shares to meet increasing demand, and c) there could well be
another shift towards the added safety provided by bullion. Therefore,
strength or weakness in the gold stocks relative to gold bullion might
not be as significant over the next few years as it was over the past
few years and investors who currently have a lot more invested in gold
shares than in gold bullion should perhaps consider some re-balancing.
Current Market Situation
...even
if NEM is headed towards new lows for the year (we think it is) a
counter-trend rebound is likely to begin within the next few days.
In the Market Alert e-mail sent to subscribers after the close of trading last Tuesday we said "...there
have been some convincing signals that the counter-trend rallies in
gold and gold stocks that began during the first half of February have
ended. In particular, the popular gold stock indices have broken
support and the HUI/gold ratio has closed below its 40-day moving
average. We are therefore going to change our short-term views on gold
and gold stocks from "neutral" to "bearish". As far as the
intermediate-term is concerned we remain bearish on gold stocks and
neutral on gold (the stocks, in our opinion, have more downside risk
than the bullion)." The e-mail has been archived at http://www.speculative-investor.com/new/email.asp.
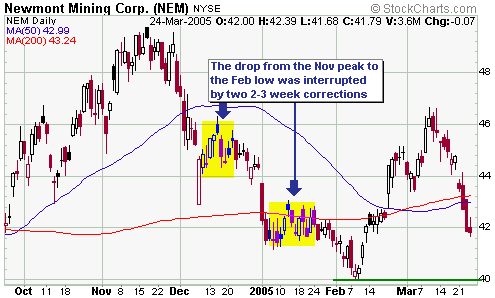
The below chart shows that the Newmont Mining (NEM) stock price has
dropped in almost a straight line over the past 11 trading days.
However, markets almost never get from where they are to where they are
going in a straight line so even if NEM is headed towards new lows for
the year (we think it is) a counter-trend rebound is likely to begin
within the next few days. Notice, for instance, that the decline from
the mid-November peak was interrupted by two multi-week consolidations.
A similar consolidation over the coming 2-3 weeks -- a likely outcome,
in our opinion -- would result in the stock rebounding to $43-$44
before resuming its decline.
Current Market Situation (Gold and the Dollar)
With
gold and silver having ended last week poised just above their
respective 200-day moving averages it's likely that rebounds will begin
very soon. However, we expect that both metals will move to new lows
for the year at some point over the coming 2 months.
Below are daily charts of gold and silver futures. It looks like
silver's failure to confirm gold's upside breakout in March was just as
significant as its failure to confirm gold's downside breakout in
February. Specifically, the ability of silver to remain above its
January low when gold broke to new lows for the year in early February
was a significant bullish divergence whereas the inability of silver to
trade above its February high during the first half of March has proved
to be a significant bearish divergence.
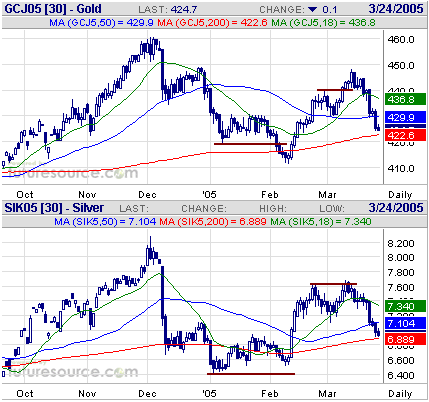
With gold and silver
having ended last week poised just above their respective 200-day
moving averages it's likely that rebounds will begin very soon.
However, we expect that both metals will move to new lows for the year
at some point over the coming 2 months.
Silver has more intermediate-term downside risk than gold and it will
probably under-perform gold over the coming 12 months. However, it also
has greater long-term upside potential. The key to successful trading
and investing in silver is to NEVER buy during periods of strength.
Instead, if you are a trader you should scale-in during the periodic
sharp declines and scale-out during the sharp rallies. If you are an
investor you should scale-in during the periodic sharp declines and
just hold on for the ride. Our thinking has been, and continues to be,
that silver will test its May-2004 low ($5.50) before this year is out,
but that any price below $6.50 represents a reasonable entry level for
long-term investors.
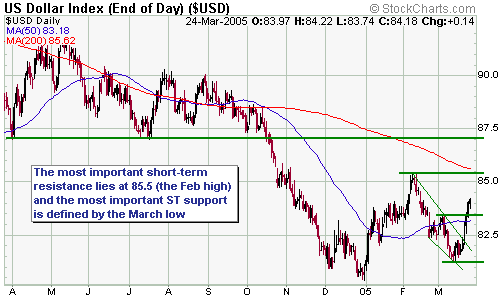
Below is a chart of the Dollar Index. The dollar closed decisively
above its 50-day moving average and its early-March high at the end of
last week, thus providing solid evidence that a secondary low is now in
place. This doesn't mean that it will be onwards and upwards for the
dollar over the coming weeks because following such a strong 5-day
advance some consolidation would be normal. However, if the next leg of
the dollar's advance has begun then the Dollar Index should not trade
below its March low over the coming weeks/months.
In the 9th March Interim Update
we said that a downturn in the A$ lasting at least one year and
potentially as long as two years would likely soon begin, but that one
final surge was possible. Last week's action suggests that a final
surge is not going to occur and that a major peak is already in place.
Update
on Stock Selections
 In
our opinion, the best strategy to have at this time is one that
involves gradually scaling into small-cap gold and silver stocks over
the remainder of this year. We would focus on the small-caps because a
lot more value can be found in this area of the market and, as a
result, many of these stocks are likely to out-perform the bullion by a
wide margin during the next multi-year upward leg in the secular bull
market. On the other hand, large-caps such as NEM, as well as the
stocks of popular mid-tier companies such as Goldcorp, Glamis Gold and
Pan American Silver, are very expensive relative to current metal
prices. As a result they might not out-perform bullion during the next
multi-year advance. Therefore, rather than buy over-valued large- and
mid-cap stocks investors who are uncomfortable owning the small-caps
could consider focusing on exchange-traded bullion funds such as
StreetTRACKS Gold Shares (NYSE: GLD), which is designed to track the
bullion price, and Central Fund of Canada* (AMEX: CEF), a fund that
owns gold and silver bullion. The major unhedged South African gold
stocks -- Gold Fields Ltd and Harmony Gold -- are also worth
accumulating on weakness because they offer substantial leverage to the
gold price, but bear in mind that additional leverage is invariably
associated with additional risk. In
our opinion, the best strategy to have at this time is one that
involves gradually scaling into small-cap gold and silver stocks over
the remainder of this year. We would focus on the small-caps because a
lot more value can be found in this area of the market and, as a
result, many of these stocks are likely to out-perform the bullion by a
wide margin during the next multi-year upward leg in the secular bull
market. On the other hand, large-caps such as NEM, as well as the
stocks of popular mid-tier companies such as Goldcorp, Glamis Gold and
Pan American Silver, are very expensive relative to current metal
prices. As a result they might not out-perform bullion during the next
multi-year advance. Therefore, rather than buy over-valued large- and
mid-cap stocks investors who are uncomfortable owning the small-caps
could consider focusing on exchange-traded bullion funds such as
StreetTRACKS Gold Shares (NYSE: GLD), which is designed to track the
bullion price, and Central Fund of Canada* (AMEX: CEF), a fund that
owns gold and silver bullion. The major unhedged South African gold
stocks -- Gold Fields Ltd and Harmony Gold -- are also worth
accumulating on weakness because they offer substantial leverage to the
gold price, but bear in mind that additional leverage is invariably
associated with additional risk.
Getting back to the small-cap stocks, it is likely that most of these
stocks will trade below their current prices before the next bull
market gets underway. This is not a concern, however, if your plan is
to average into positions over many months. In fact, after you've
purchased an initial stake in a company you have positioned yourself in
such a way that you have some coverage in case the stock price takes
off but are hoping for additional weakness in order to reduce your
average purchase cost. Remember, the idea isn't to buy at the absolute
bottom because nobody knows, in advance, where the bottom is going to
be. Rather, the idea is to accumulate stock when the risk/reward is
very favourable and to build-up cash reserves when it is not. If you
average into fundamentally-sound stocks when the risk/reward is
favourable then you will often be doing your buying on either side of
the ultimate bottom and will end up with an average purchase cost that
gives you a good chance of achieving large gains.
Buying the stocks of those companies that have a lot of cash in their
coffers can mitigate the risk associated with small-caps. As far as the
exploration/development-stage gold and silver stocks in the TSI List
are concerned, the ones that are 'cashed up' and are therefore going to
be under no pressure to raise additional funds over the coming 12
months are CLG, DSM, FR (assuming its recently-announced financing is
successfully completed), MRB, MVG, NG, and NSU.
Our guess is that the next tradable low (equivalent to the 8th Feb low)
in the gold sector will occur during May. In anticipation of this event
we will, over the next couple of weeks, mention some under-the-market
buy levels for several of our favourite gold/silver stocks based on
technical factors.
*We like CEF
because it provides exposure to silver as well as gold, but note that
it sometimes trades at a large premium to its net asset value (NAV). If
you are interested in building up a position in this fund then make
sure you don't pay more than 3% above NAV. The premium/discount to NAV
can be found at http://www.etfconnect.com/select/fundPages/sectors.asp?MFID=3653
Chart Sources
Charts appearing in today's commentary
are courtesy of:
http://stockcharts.com/index.html
http://www.futuresource.com/
http://www.decisionpoint.com/
http://bigcharts.marketwatch.com/

|

