|
-- Weekly Market Update for the Week Commencing 28th March 2011
Big Picture
View
Here is a summary of our big picture
view of the markets. Note that our short-term views may differ from our
big picture view.
In nominal dollar terms, the BULL market in US Treasury Bonds
that began in the early 1980s will end by mid-2010. In real (gold)
terms, bonds commenced a secular BEAR market in 2001 that will continue
until 2014-2020. (Last
update: 09 February 2009)
The stock market, as represented by the S&P500 Index, commenced
a secular BEAR market during the first quarter of 2000, where "secular
bear market" is defined as a long-term downward trend in valuations
(P/E ratios, etc.) and gold-denominated prices. This secular trend will bottom sometime between 2014 and 2020. (Last update: 22 October 2007)
A secular BEAR market in the Dollar
began during the final quarter of 2000 and ended in July of 2008. This
secular bear market will be followed by a multi-year period of range
trading. (Last
update: 09 February 2009)
Gold commenced a
secular bull market relative to all fiat currencies, the CRB Index,
bonds and most stock market indices during 1999-2001. This secular trend will peak sometime between 2014 and 2020. (Last update: 22 October 2007)
Commodities,
as represented by the Continuous Commodity Index (CCI), commenced a
secular BULL market in 2001 in nominal dollar terms. The first major
upward leg in this bull market ended during the first half of 2008, but
a long-term peak won't occur until 2014-2020. In real (gold) terms,
commodities commenced a secular BEAR market in 2001 that will continue
until 2014-2020. (Last
update: 09 February 2009)
Copyright
Reminder
The commentaries that appear at TSI
may not be distributed, in full or in part, without our written permission.
In particular, please note that the posting of extracts from TSI commentaries
at other web sites or providing links to TSI commentaries at other web
sites (for example, at discussion boards) without our written permission
is prohibited.
We reserve the right to immediately
terminate the subscription of any TSI subscriber who distributes the TSI
commentaries without our written permission.
Outlook Summary
Market
|
Short-Term
(0-3 month)
|
Intermediate-Term
(3-12 month)
|
Long-Term
(1-5 Year)
|
Gold
|
Neutral
(09-Mar-11)
|
Neutral
(24-Jan-11)
|
Bullish
|
US$ (Dollar Index)
|
Neutral
(07-Mar-11)
| Neutral
(07-Mar-11)
|
Neutral
(19-Sep-07)
|
Bonds (US T-Bond)
|
Neutral
(20-Sep-10)
|
Bearish
(21-Mar-11)
|
Bearish
|
Stock Market (S&P500)
|
Neutral
(28-Mar-11)
|
Bearish
(11-Oct-10)
|
Bearish
|
Gold Stocks (HUI)
|
Neutral
(09-Mar-11)
|
Bullish
(23-Jun-10)
|
Bullish
|
| Oil | Neutral
(31-Jan-11)
| Neutral
(31-Jan-11)
| Bullish
|
Industrial Metals (GYX)
| Bearish
(03-Jan-11)
| Bearish
(25-May-09)
| Neutral
(11-Jan-10)
|
Notes:
1. In those cases where we have been able to identify the commentary in
which the most recent outlook change occurred we've put the date of the
commentary below the current outlook.
2. "Neutral", in the above table, means that we either don't have a
firm opinion or that we think risk and reward are roughly in balance with respect to the timeframe in question.
3. Long-term views are determined almost completely by fundamentals,
intermediate-term views by giving an approximately equal weighting to
fundamental and technical factors, and short-term views almost
completely by technicals.
The only effective protection against the government
Big government is always a
problem, but it is a problem that 'we the people' willingly bring on
ourselves. The root cause of government growth beyond its proper
boundaries is the widespread desire for a powerful leader that promises
greater security, even if the security comes at the expense of some
individual freedoms.
It has been proven, time and time again, that the democratic process is
not an effective protection against bad government and does not limit
the expansion of government. As put succinctly by H.L.Mencken: "Democracy is the theory that the common people know what they want, and deserve to get it good and hard."
In a democracy, people generally attain positions of political power by
promising benefits to one group at the expense of another group. This
process tends to result in the gradual increase in government power
during normal times and the rapid increase in government power during
times of hardship or crisis (during periods of hardship or crisis, the
population is generally more amenable to giving up freedoms in exchange
for security). Eventually, the government has so much power that the
democratically-elected head of state is, for all intents and purposes,
a dictator. From then on, the democratic process involves the election
of a new dictator every few years.
It has also been proven, most notably via the US experience, that a
constitution does not offer long-lasting protection against the
expansion of government power. The US Constitution held up reasonably
well until the 1930s, but the combination of an economic depression and
an ambitious, popular and totally unprincipled president quickened the
pace at which the government's role deviated from that envisaged by the
Founding Fathers. Some Americans still have a strong belief in the
principles upon which their Constitution is based, but the Constitution
has almost no practical relevance in today's political realm. The
reality is that almost everything the US government does these days is
unconstitutional.
The only truly effective way to restrain government and to protect the
population from its own willingness to give up freedoms in exchange for
security is to ensure that the government stays out of the money
business. The government's ability to expand its reach will be severely
limited if it has no authority to determine what is or isn't money, to
increase the supply of money (either directly or via a central bank),
or to regulate money in any way.
Where a prominent deflation forecaster went wrong
Anyone who writes extensively about the economic situation and/or the
financial markets will inevitably make some statements and forecasts
that subsequently prove to be off the mark. It is therefore not
surprising that Robert Prechter, the world's most prominent deflation
forecaster and a prolific commentator about the economy and the
markets, has said/written many things in the past that turned out to be
wrong. We have also made our share of mistakes, so by discussing where
Mr. Prechter went wrong it can seem that we are throwing stones in a
glass house. However, we are going to do it anyway, because when it
comes to the critical inflation/deflation issue we can make some
important points by highlighting two of the most basic flaws in
Prechter's arguments. These flaws were apparent in his 2001 book
"Conquer the Crash" (CTC) and still appear to permeate his thinking
today.
The first basic flaw that we'll deal with relates to the Fed's role.
According to the CTC chapter entitled "Why the Fed Cannot Stop
Deflation", the Fed doesn't directly expand the supplies of money and
credit. Instead, it encourages the banks to lend and the public to
borrow by lowering the interest rate that banks pay on short-term
money. This method of inflating supposedly works well under normal
circumstances, but there comes a time when low Fed-induced rates cannot
overcome creditors' disinclination to lend and/or the public's
unwillingness or inability to borrow. The Prechter argument is that the
Fed then becomes impotent as far as expanding the supplies of money and
credit are concerned.
The part about the Fed relying on the private banks during normal times
is correct, but the private banks don't have to make loans to the
public in order for the supplies of money and credit to grow. This is
because a) an increase in government borrowing can offset a reduction
in private-sector borrowing, b) the private banks can expand the money
supply by monetising government bonds and other securities, and c) the
Fed has the power to bypass the private banks and expand the money
supply directly (by monetising government debt securities and pretty
much anything else). We've seen all of these factors at work 'in
spades' over the past 2.5 years, paving the way for the US money supply
to increase at the rate of more than 10%/year despite a shrinkage in
bank lending to the general public.
In the same CTC chapter Mr. Prechter acknowledges the scenario in which
the Fed, beginning soon after the onset of deflation, trades banknotes
for portfolios of bad loans, thus replacing a sea of bad debt with an
ocean of banknotes, but he immediately dismisses this possibility. His
reasoning is twofold. First, he states: "...the
Fed is a bank, and it would have no desire to go broke buying up
worthless portfolios, debasing its own reserves to nothing."
This statement is now quite funny given that the Fed has, over the past
few years, done exactly that (bought up worthless portfolios and
debased its own reserves). Second, he claims that in a defensive
emotional environment an attempt by the Fed to aggressively monetise
debt would backfire by causing investors to panic out of long-term
bonds.
Clearly, he was wrong about how the Fed would react to the threat of
deflation and how the markets would react to the Fed's reflationary
policies. In particular, he failed to grasp that in its efforts to
prop-up failed banks and boost asset prices the Fed would totally
disregard the health of its own balance sheet and the long-term
durability of the US$. It seems that he gave the Fed too much credit.
The second flaw that we'll mention is, in our view, Mr. Prechter's most
fundamental error. The error is to lump changes in money supply,
changes in credit supply and changes in the total market value of debt
together as if they were one and the same. This confusion leads to some
downright weird conclusions. For example, he explains that aggressive
monetisation of assets by the Fed could generate considerable fear of
dollar depreciation, leading to a large decline in dollar-denominated
bond prices. He goes on to say: "If
this were to happen, the net result of an attempt at inflating would be
a system-wide reduction in the purchasing power of dollar-denominated
debt, in other words, a drop in the dollar value of total credit
extended, which is deflation." That is, he says that a panic out
of bonds due to the Fed's rapid monetary inflation would constitute
deflation. Or, to put it more simply: inflation is deflation (and war
is peace, and slavery is freedom).
With regard to whether the economy is experiencing inflation or
deflation, changes in the supply of credit can be important -- but only
to the extent that they cause changes in the supply of money. By way of
further explanation, if Bob lends $1000 to Fred then the supply of
credit increases by $1000, but the money supply is unchanged and there
has been no inflation as a result of the transaction. Bob has simply
transferred part of his existing purchasing power to Fred. However, if
Fred borrows $1000 from a bank and the bank makes the loan by creating
new money, then the supplies of both money and credit have increased by
$1000, so inflation has occurred. If Fred defaults on his loan to Bob
(the first case) then Bob will suffer a $1000 loss and the supply of
credit will fall by $1000, but the money supply will be unchanged and
there will be no deflation. The money supply will also be unchanged --
meaning that there will also be no deflation -- if Fred defaults on his
loan to the bank (the second case), but due to the loan default the
bank might have less ability to inflate the money supply in the future.
Changes in the market values of assets should never be part of the
inflation/deflation equation. Market values often react to changes in
the money supply (that is, changes in market value are typical EFFECTS
of inflation/deflation), but an increase or decrease in the price of an
asset doesn't affect the economy-wide purchasing power of money. It is
also worth mentioning that market values can experience large rises and
large falls during both inflation and deflation. For example, bond
prices fell sharply during the inflation of the 1970s, and with the
exception of US government bonds they also fell sharply during the
deflation of the 1930s.
We'll end by pointing out that even though the Fed has done what he
believed it wouldn't or couldn't do, and even though the gold price has
done what he said it wouldn't do, and even though bond investors have
reacted very differently from the way he expected them to react, Robert
Prechter remains as committed as ever to his deflation forecast. Then
again, the way he defines deflation it is possible that he will claim
to be vindicated if the dollar and dollar-denominated bonds eventually
lose all of their value due to hyperinflation.
Uranium
Mickey Fulp's 23rd March article provides a good overview of the current uranium market situation. Here are some excerpts:
"...425 of the
worldís 443 nuclear power reactors are still operating. China,
Russia, South Korea, and the United States have announced they will
press forward with ambitious plans for increased electricity output
from nuclear power. These countries have been driving the nuclear
renaissance along with India. It seems certain there will be delays in
plant design, permitting, and construction around the world. Capital
costs of new plants will increase as we learn from mistakes made at
Fukushima."
"In 2010, mines supplied
about 70% of overall uranium demand. For years the shortfall of mine
supply has been met by sovereign stockpiles and secondary supplies,
mainly thru conversion of Russian heavy enriched uranium into nuclear
reactor fuel. Stockpiles and secondary supply are declining rapidly
with the Russian program scheduled for termination in 2013."
"All facets of the
worldwide nuclear power industry including sovereign companies,
utilities, index funds, manufacturers and suppliers, and uranium
producers, developers, and explorers were hit by panic selling and
market turmoil in the past week. They likely will be strongly oversold
and present good buying opportunities in the short term. In my opinion
it is still too early to make a bottom call on the sector. However,
putting in stink bids and patiently accumulating as the market rises
and falls is always a legitimate strategy if you like the long term
viability of an exploration or mining company."
The Stock
Market
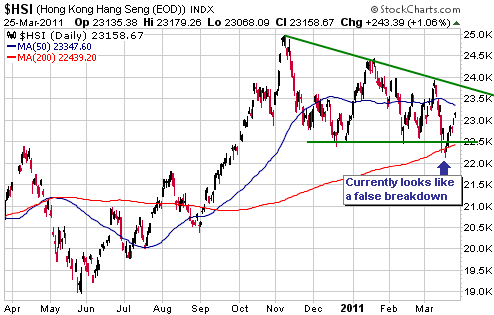
Hong Kong's Hang Seng Index
(HSI) broke below support at 22,500 during the week before last, but
then immediately reversed upward. Consequently, we are now presented
with a potentially-bullish false downside breakout.
In last week's
Interim Update we mentioned that the rebound in the S&P500 Index
(SPX) from its mid-March low had gone about as far as it should if the
recent decline was going to evolve into something more serious than a
routine short-term correction. The additional gains made during the
final two days of last week have therefore shifted the odds in favour
of the routine short-term correction scenario.
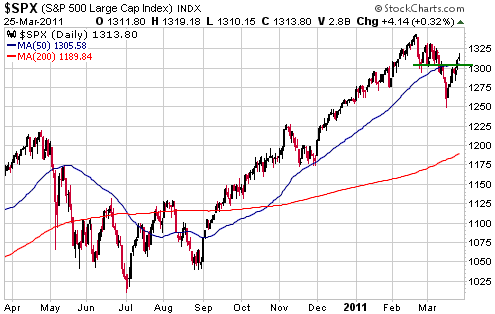
Due to the HSI's
inability to follow through on its downside breakout, the SPX's ability
to move above resistance in the low-1300s, and the fact that neither
the Dollar Index nor the silver/gold ratio signaled a trend change
during the recent stock market swoon, we have upgraded our short-term
stock market outlook from "bearish" to "neutral".
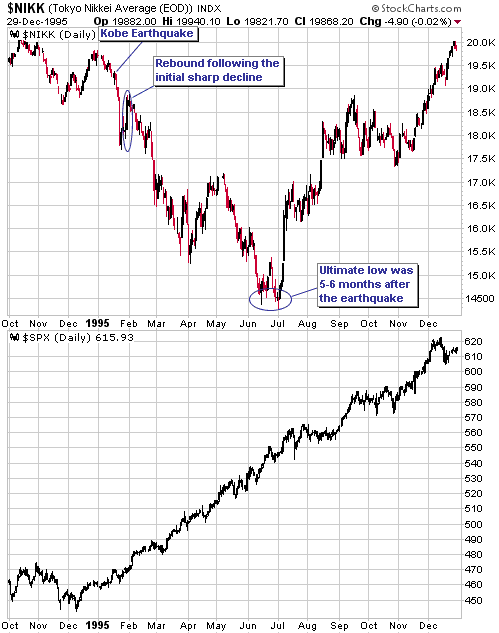
Based on what happened during the months following the massive
earthquake that struck near Kobe, Jan, in mid January of 1995, Japan's
recent massive earthquake will likely lead to significant additional
weakness in the Japanese stock market; however, it probably won't be
the catalyst for an intermediate-term decline in the US stock market.
As illustrated below, the Nikkei's performance in the aftermath of the
Kobe earthquake entailed an initial sharp decline, a quick rebound that
recouped more than half the initial loss, and then a downward trend
that lasted several months. As also illustrated below, over the same
period the S&P500 Index moved steadily upward.
There are many reasons to be concerned about intermediate-term downside
risk in the US stock market. Our point is simply that Japan's recent
earthquake is not one of them.
One of the biggest
threats to all cyclical markets, including the US stock market, is the
possibility that China's credit bubble will burst. China's credit
bubble will burst sooner or later, and when it does it will likely
usher in a global economic slow-down and bear markets in
growth-oriented assets such as equities and industrial commodities.
However, nobody knows the timing of the inevitable bursting of the
bubble.
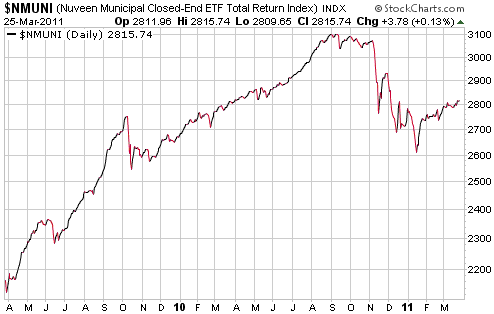
Another important threat is the potential for major problems in the US
municipal bond market. The Nuveen Municipal ETF Index (NMUNI) resuming
its downward trend would signal that this threat was shifting to
centre-stage. Currently, NMUNI is in recovery mode after making an
interim bottom in January.
This week's
important US economic events
| Date |
Description |
Monday Mar 28
| Personal Income and Spending
Pending Home Sales Index
| Tuesday Mar 29
| Consumer Confidence
Case-Shiller Home Price Index
| | Wednesday Mar 30
| No important events scheduled
| | Thursday Mar 31
| Chicago PMI
Factory Orders
| | Friday Apr 01
| Monthly Employment Report
ISM Manufacturing Index
Construction Spending
Motor Vehicle Sales
|
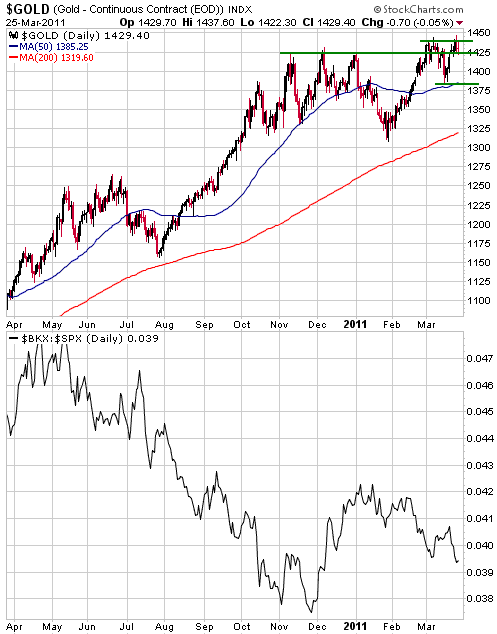
Gold and
the Dollar
Gold and Silver
The top section of the following daily chart shows the US$ gold price.
US$ gold still hasn't made a decisive break to new highs, but it looks
like it will soon do so.
In order to maintain its bullish posture, gold will have to hold above
$1380 on a daily closing basis during any pullback over the days ahead.
The bottom section of the following chart shows the BKX/SPX ratio (the
Bank Index relative to the broad stock market). Relative weakness in
the banking sector -- as indicated by a downward trend in the BKX/SPX
ratio -- is positive for gold. BKX/SPX made a new multi-month low last
week, so this important influence remains supportive.
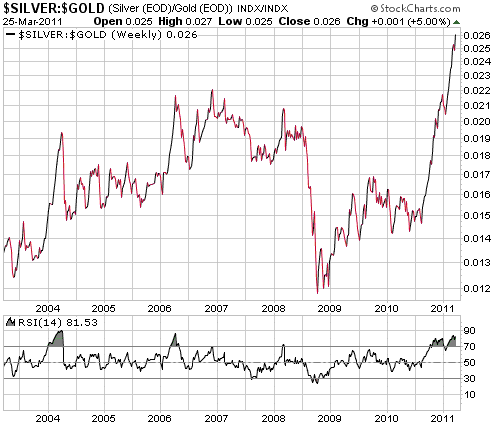
Below is the weekly
chart of the silver/gold ratio that we have fixated on over the past
few months. The chart shows that the ratio made yet another new high
last week. It remains extraordinarily 'overbought' and is likely to
experience a large decline within the next few months, but as long as
it keeps rising it will be reasonable to assume that new highs lie in
the near future for both gold and silver.
This chart will continue to be a regular feature in our commentaries until a trend reversal is confirmed.
Gold Stocks
The following daily chart shows that the HUI reversed lower late last
week from resistance at 580. This price action is normal and doesn't
imply anything bearish.
For the bulls, the ideal short-term outcome would be for the HUI to
consolidate between 550 and 580 for several days and to break above the
580 resistance area in early April. Price action along these lines
would create a chart-based target of 670, which would stand a good
chance of being reached by mid May. This, in our opinion, is one of the
two most likely short-term outcomes.
The second of the two most likely short-term outcomes involves a
'choppy' decline back to the low-500s over the next several weeks to
complete an intermediate-term correction.
As a result of last week's market action, the more bullish of the
above-mentioned short-term outcomes has the higher probability. This
will remain the case as long as the HUI holds above 550 and the gold
price holds above $1380 on a daily closing basis.
The key is the gold price. This might sound like a statement of the
bleeding obvious, but there are times when the gold stocks are leading
the metal and during such times the key to the gold sector is the gold
sector's own price action. This is not one of those times. Currently,
the bullion is leading the stocks. Provided that gold holds support
($1380) during any 'corrective' action over the days ahead and then
breaks out to new highs, the gold-stock indices should follow.

The Junior Gold
Miners ETF (GDXJ) has resistance at $40 and support at $34 (see chart
below). If this ETF is readying itself for an upside breakout then any
pullback over the days ahead will likely end at around $37 (the 50-day
moving average and the mid-point of the recent trading range).
An upside breakout would create a short-term chart-based target of $46-$50.
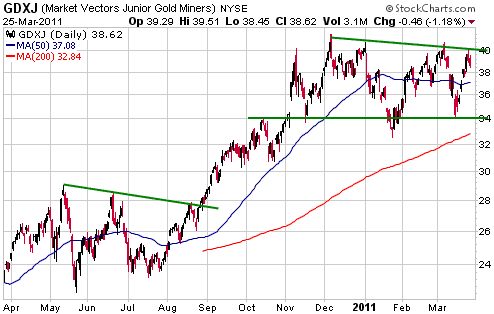
Depending on your
current level of exposure, pullbacks over the days ahead could be used
to accumulate gold stocks in anticipation of an upside breakout and
multi-week surge. This is not, however, a good time to be aggressively
bullish, because the charts of silver and the silver/gold ratio
strongly suggest that we are not going to get lengthy extensions from
here in the precious-metal upward trends.
From an intermediate-term perspective it would actually be more bullish
if the HUI did not break out to the upside in the near future, and
instead worked its way back to the low-500s. In other words, the more
bullish short-term outcome sets the scene for a more bearish
intermediate-term outcome.
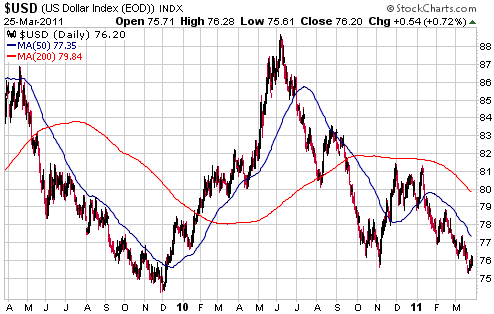
Currency Market Update
We don't have much to say about the currency market at this time. The
Dollar Index will probably soon commence a bottoming process, but there
is no evidence that the bottoming process has already begun.
Consecutive daily closes above 78 by the Dollar Index would be
preliminary evidence that an intermediate-term bottom was in place.
Update
on Stock Selections
(Notes: 1) To review the complete list of current TSI stock selections, logon at http://www.speculative-investor.com/new/market_logon.asp
and then click on "Stock Selections" in the menu. When at the Stock
Selections page, click on a stock's symbol to bring-up an archive of
our comments on the stock in question. 2) The Small Stock Watch List is
located at http://www.speculative-investor.com/new/smallstockwatch.html)
 Clifton Star Resources (TSXV: CFO). Shares: 35M issued, 40M fully diluted. Recent price: C$3.57 Clifton Star Resources (TSXV: CFO). Shares: 35M issued, 40M fully diluted. Recent price: C$3.57
CFO rebounded to former support (now resistance) at C$4.00, and then
pulled back. A decisive break above C$4.00 would be preliminary
evidence that the stock had finally bottomed.
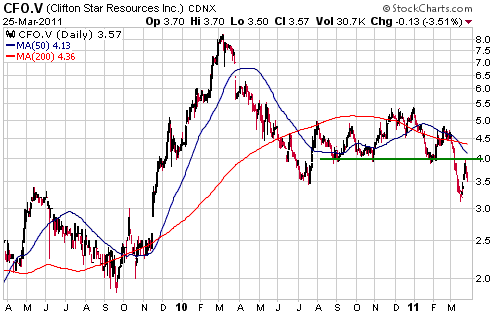
CFO has been a source
of frustration over the past 9 months, but it is still one of our
favourites. As long as reasonable progress continues to be made 'on the
ground' at the company's Quebec-based Duparquet gold project and no
important fundamental problems arise, we will be patient with this one.
We are mentioning CFO today for two reasons. First, if you can tolerate
the risks inherent in exploration-stage mining stocks and don't already
have a position in CFO, then now would be a reasonable time to take an
initial position. Second, we wanted to point out that CFO has always
tended to 'move to the beat of its own drummer', meaning that the
performance of this gold stock doesn't correlate well with the
performance of the overall gold sector. Consequently, it won't surprise
us if CFO ends up making substantial gains after the gold-stock indices
have begun to trend downward. In other words, don't use CFO as a
general gold-sector play and don't assume that the next sector-wide
downturn will necessarily lead to an even better buying opportunity in
CFO shares.
Sabina Gold and Silver (TSX: SBB). Shares: 154M issued, 166M fully diluted. Recent price: C$5.92
Things are progressing well for SBB, both with regard to its two major
Nunavut-located projects and the performance of its shares. Here's the
current situation:
*The Back River gold project:
A new resource estimate was announced earlier this month, which
increased the Indicated portion of the resource to 2.6M ounces (from
1.2M ounces) and the Inferred portion to 1.6M ounces (from 1.2M
ounces). Another resource update is expected in April, after which the
company will commence a Preliminary Economic Analysis that should be
complete during the second half of the year.
As was the case last year, this year's most interesting news is likely
to stem from the drilling program. A 68,000m ($29M) program is planned
for 2011, and we expect that results will start being reported in May.
*The Hackett River silver-zinc project:
This was SBB's flagship project and the main reason for our interest in
the company up until the middle of last year, at which time it began to
slide into the background due to the company's spectacular drilling
success at Back River.
Hackett River contains 206M ounces of silver and 4.4B pounds of zinc in
the Indicated category, and by our calculations still accounts for more
than half of SBB's value. It might again take a back-seat to Back River
in 2011 due to the latter's drilling programs and resource estimates,
but it also has the potential to generate news that brings about a
large increase in the stock price. We are referring to the possibility
that there will be an announcement of a deal with a major mining
company (SBB's management has said that it is looking for a strategic
partner for Hackett River).
*General
Along with its in-ground mineral assets, SBB has about $165M of cash in
the bank. This means that it has more than enough cash to fully fund
its aggressive work programs.
We suspect that SBB will become a double-digit stock within the next 12
months, but we don't think it would be prudent to do any new buying at
this time. Ideally, new buying would be done following a pullback to
the vicinity of the 200-day moving average.
If you are 'long' SBB from when it was trading at much lower levels and
haven't yet done any selling, you should seriously consider taking some
profits now. You should also maintain a core position because the
stock's intermediate-term risk/reward remains attractive.
Just a quick note that a new series of Crocodile Gold warrants began
trading on the TSX last Thursday under the symbol CRK.WT. These
warrants are a long way out of the money (exercise price of $2.25,
versus the current share price of C$0.93), but at the right price they
could be an interesting speculation because they don't expire until
2016.
With CRK trading in the C$0.90s we wouldn't pay more than C$0.20 for the warrants.
Chart Sources
Charts appearing in today's commentary
are courtesy of:
http://stockcharts.com/index.html

|