


-- Weekly Market Update for the Week Commencing 28th March 2016
Big Picture
View
Here is a summary of our big picture
view of the markets. Note that our short-term views may differ from our
big picture view.
The BULL market in US Treasury Bonds
that began in the early 1980s ended in early-2015, but there will be many years
of topping action in bond prices and bottoming action in bond yields before
major new trends get underway. (Last update: 29 June 2015)
The stock market, as represented by the S&P500 Index,
commenced
a secular BEAR market during the first quarter of 2000, where "secular
bear market" is defined as a long-term downward trend in valuations
(P/E ratios, etc.) and gold-denominated prices. This secular trend will bottom sometime between 2018 and 2020.
(Last update: 29 June 2015)
A secular BEAR market in the
US
Dollar
began during the final quarter of 2000 and ended in July of 2008. This
secular bear market will be followed by a multi-year period of range
trading.
(Last
update: 09 February 2009)
Gold commenced a
secular bull market relative to all fiat currencies, the CRB Index,
bonds and most stock market indices during 1999-2001.
This secular trend will peak sometime between 2018 and 2020.
(Last update: 29 June 2015)
Commodities,
as represented by the CRB Index, commenced a
secular BULL market in 2001 in nominal dollar terms. The first major
upward leg in this bull market ended during the first half of 2008, but
a long-term peak won't occur until 2018-2020.
(Last
update: 29 June 2015)
Copyright
Reminder
The commentaries that appear at TSI
may not be distributed, in full or in part, without our written permission.
In particular, please note that the posting of extracts from TSI commentaries
at other web sites or providing links to TSI commentaries at other web
sites (for example, at discussion boards) without our written permission
is prohibited.
We reserve the right to immediately
terminate the subscription of any TSI subscriber who distributes the TSI
commentaries without our written permission.
Outlook Summary
Market
|
Short-Term
(1-3 month)
|
Intermediate-Term
(6-18 month)
|
Long-Term
(2-5 Year)
|
|
Gold
|
N/A |
Bullish
(26-Mar-12) |
Bullish
|
|
US$ (Dollar Index)
|
N/A |
Bullish
(29-Feb-16) |
Neutral
(19-Sep-07) |
|
US Treasury Bonds (TLT)
|
N/A |
Bearish
(19-Oct-15)
|
Bearish |
|
Stock Market
(DJW)
|
N/A |
Bearish
(30-Dec-15) |
Bearish
|
|
Gold Stocks
(HUI)
|
N/A |
Bullish
(23-Jun-10) |
Bullish
|
|
Oil |
N/A |
Neutral
(26-Oct-15) |
Bullish
|
|
Industrial Metals
(GYX)
|
N/A |
Neutral
(09-Nov-15) |
Bullish
(28-Apr-14) |
Notes:
1. Our short-term expectations are discussed in the commentaries, but except in
special circumstances we won't attempt to assign a "bullish", "bearish" or
"neutral" label to these expectations.
2. The date shown below the current outlook is when the most recent outlook change occurred.
3. "Neutral" means that we think risk and reward are roughly in balance with respect to the timeframe in question.
4. Long-term views are determined almost completely by fundamentals and intermediate-term views
are determined by a combination of fundamentals, sentiment and technicals.
Last week's posts at the TSI Blog
Are speculators too optimistic about the gold price?
The great inflation-unemployment trade-off stupidity
The Missing Link
Change to the TSI
service over the next two weeks
We are going to be traveling
over the next two weeks and won't be able to do the normal Weekly and Interim
Updates. However, we expect to have a reliable internet connection most of the
time and plan to keep TSI subscribers abreast of our thoughts on the markets via
regular less-formal commentaries/notes.
An update is likely to be posted every 3-4 days over the next two weeks, or more
frequently if demanded by the market action. The updates will be posted at a
page on the TSI web site and notified in the usual way via email. That is,
whenever an update is posted you will be sent an email with a link to the web
page.
What do we expect the
Fed to do?
According to a lot of the
commentary that spewed forth over the past week or so, "we", meaning the
collective known as the market, were forced to downgrade our 2016 rate-hike
expectations from four to two in response to the Fed's 16th March policy
statement and "dot plots". Hogwash! "We" never believed that there would be four
rate hikes in 2016.
At the peak of rate-hike expectations last December "we" thought that there
would definitely be two and possibly as many as three Fed rate hikes in 2016,
but by the 11th February stock-market bottom "we" had come to believe that there
would be no rate hikes this year. This expectation then shifted as stocks and
commodities rebounded, such that by the time of the Fed's announcement on 16th
March "we" thought that there would be at least one and possibly as many as two
rate hikes this year, which is not significantly different from the situation
today.
In other words, the events of 16th March were not about the market's
expectations being brought into line with the views of a more 'dovish' Fed, they
were about the Fed's expectations being brought into line with the market. You
don't have to be extremely knowledgeable to figure this out; you just have to
ignore most analyses and check the prices of Fed Funds Futures contracts.
Given what has happened during the past 1-2 weeks, what do we, meaning TSI,
expect the Fed to do over the remainder of this year?
Unlike last year, when we were confident from the word 'go' that there would be
one rate hike at most, we have never had a strong opinion on what the Fed will
do on the rate-hiking front this year. As we stated shortly after it happened,
we won't be surprised if last December's rate hike turns out to be the only rate
hike for a long time. However, there are also plausible scenarios under which
the Fed would hike its targeted interest rate at least twice before year-end.
We expect that at some point during the second half of this year the Fed will
simultaneously feel pressured by rising inflation expectations to raise interest
rates and pressured by a stagnant economy to keep monetary conditions as easy as
possible.
The Stock Market
The US
Extremes can facilitate market timing
For those who look objectively at the data there are times when it is clear that
the US stock market is within about three days of at least a short-term bottom.
That's why we were able to identify the 24th August-2015 low, the
late-September-2015 low, the 20th January-2016 low and the 11th February-2016
lows as important (likely to hold for a few weeks and possibly much longer) when
they were happening or within two days of them happening.
The times when a short-term bottom can be reliably identified in real time or at
least very close to the event are when certain indicators are at extremes. For
example, when the number of individual stocks making new lows reaches 500 or
more on both the NYSE and the NASDAQ it is extremely likely that if the senior
US stock indices haven't just bottomed on at least a short-term basis then they
will do so within three days.
There were obvious extremes in the number of individual-stock new lows in
August-2015, January-2016 and February-2016 that made it relatively easy to
identify the price bottoms in a timely manner. Anyone who maintained bearish
speculations following these extremes either wasn't paying attention or let
their emotions get in the way.
Unfortunately, the vast majority of short-term stock-market bottoms are not
accompanied by the sort of extreme that makes the bottom identifiable in real
time. Most of the time the market reverses course before an obvious extreme is
reached. For example, August-2015 provided the first clear-cut 'oversold'
extreme in the US stock market since 2011.
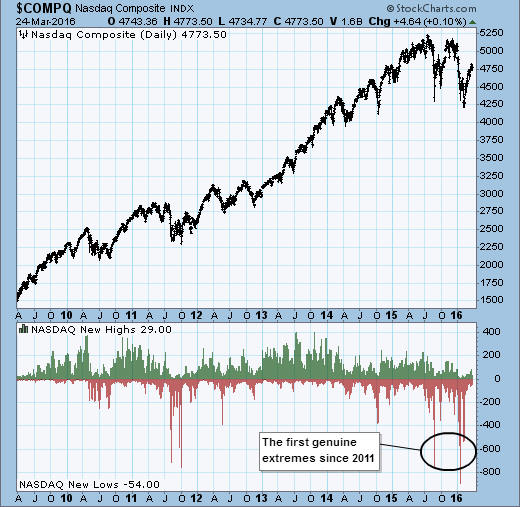
The fact that the US stock market reached a clear-cut 'oversold' extreme last
August-September and again during January-February is evidence that we are
dealing with a bear market. This, in turn, suggests that the next 1-2 month
downward trend will continue until we again get, among other things, a day
during which there are at least 500 new lows on both the NYSE and the NASDAQ.
Where are we now?
Stock market tops are almost always more difficult to identify in real time than
stock market bottoms. This is probably because the fear-induced urgency to get
out near bottoms is much greater than the greed-induced urgency to get in near
tops. Due to the different emotions involved, stock-market bottoms are often
sudden whereas stock-market tops tend to unfold gradually.
Currently, there are signs that the senior US stock indices have begun to roll
over into their next tradable declines. For instance, the following charts show
that the S&P500 and the Dow Industrials have just turned downward from
'overbought' levels near their 1-2 year channel tops. However, the probability
of an immediate collapse is almost zero.
If the rebounds from the January-February lows are complete then there will
probably be at least 2-3 weeks of choppy price action, including a several-day
decline followed by a test of the March high, prior to the start of a downward
trend. Furthermore, even if the rebounds are essentially complete it would not
be surprising if some indices made marginal new highs for the year within the
next 3 weeks.
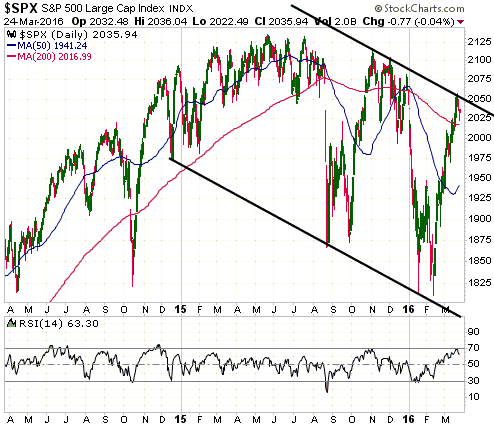
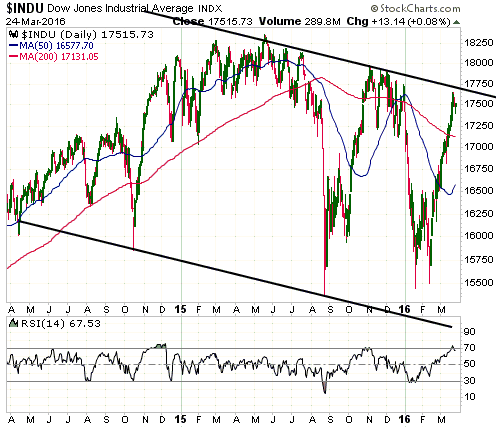
Assuming that the senior indices have begun to roll over to the downside, the
next extreme is likely to occur by June. That's why we still favour QID
(NASDAQ100 leveraged bear fund) call options with a July expiry date. Given our
current outlook, these options provide the right amount of time.
Bearish speculators who are not familiar and comfortable with options should
probably average into a leveraged inverse fund such as QID, but note that
'stops' should always be used when trading leveraged funds. At this time it
would be reasonable to average into a bear fund such as QID with the intention
of exiting with a loss if the NASDAQ100 Index makes a new multi-month high after
mid-April.
This week's
significant US economic events
[Notes:
1) The most important events
(to the markets) are shown
in bold. 2) A list of global economic events can be found
HERE]
| Date |
Description |
| Monday Mar
28 |
Personal Income and Spending
International Trade Balance
Pending Home Sales |
| Tuesday
Mar 29 |
Case-Shiller Home Price
Index
Consumer Confidence |
| Wednesday
Mar 30 |
No important events
scheduled |
| Thursday
Mar 31 |
Chicago PMI |
| Friday Apr 01 |
Monthly Employment Report
ISM Mfg Index
Construction Spending
Motor Vehicle Sales |
Gold and the Dollar
Gold
The US$ gold price broke below its 20-day MA last Monday, but held within its
short-term upward-sloping channel. On Tuesday it rebounded, but didn't quite
manage to recapture its 20-day MA. On Wednesday it clearly broke out to the
downside, in that it closed well below the bottom of its short-term channel and
the breakdown was confirmed by the gold-mining sector. On Thursday (the final
trading day of the week) there was a small additional decline.
The upshot is that whereas a week ago there was still a realistic chance of the
gold price rising to resistance in the low-$1300s prior to a short-term top (a
top that holds for 1-3 months), that's no longer the case. It is now almost
certain that a short-term top is in place. We must therefore concern ourselves
with the likely time and place for a short-term bottom and buying opportunity.
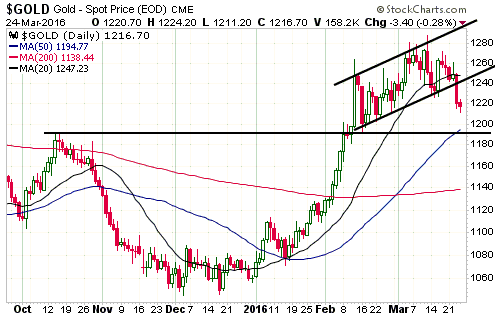
The first support of significance lies in the $1190s. We view this as the
highest level at which the gold price could reasonably be expected to bottom.
There is also support in the $1160s and then around $1140, which are also
realistic targets for a correction low.
At this stage we think that $1140 is the lowest that gold will trade before
resuming its new bull market, but we will take the evidence as it comes. And
with regard to evidence, one of the most important considerations will be the
Commitments of Traders (COT) data.
The latest COT report shows a total speculative net-long position in gold
futures of 200K contracts. This compares to a total speculative net-long
position of almost zero at the early-December price bottom.
Now, if a bull market has begun then the speculative net-long position, like the
price, should make higher lows and higher highs. We therefore do not expect that
a correction in the gold price will result in the speculative net-long position
falling anywhere near as far as its December-2015 levels. It is, however, likely
to be reduced by 50K-100K contracts prior to the start of the next short-term
upward trend.
We must also consider the possibility that something will happen in the world to
cause gold's correction to end prematurely. Just as we viewed a daily close
below the 20-day MA as an early warning that the gold market had entered
correction mode, we would view a daily close above the 20-day MA as a warning
that the correction had ended. The 20-day MA is presently at $1247, but is
beginning to decline.
Gold Stocks
Current Market Situation
The HUI closed below its 20-day MA last Wednesday. It then rebounded on
Thursday, but not by enough to suggest that the preceding day's downside
breakout was false. We therefore have preliminary evidence that a short-term top
is in place and that a multi-week correction has begun.
There is short-term lateral support at 165 that will have to be breached to
confirm the preliminary evidence noted above. Once this happens,
intermediate-term lateral support at 140 will become a reasonable 2-3 week
objective.
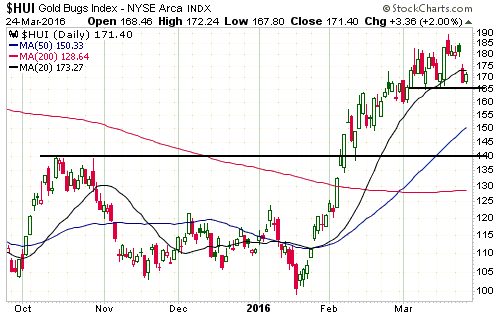
As we previously mentioned, the fact that the gold-mining sector and the broad
stock market recently became 'overbought' at the same time probably means that
gold-mining stocks, which often benefit from weakness in the broad stock market,
will be pulled down by the next significant general equity decline. In other
words, the gold-mining sector is currently positioned to be hurt rather than
helped by pronounced weakness in the broad market.
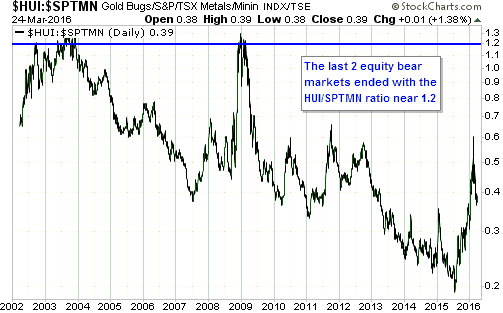
Gold mining stocks versus other mining stocks
The following chart shows the HUI/SPTMN ratio, a measure of how gold mining
stocks are performing relative to non-gold mining stocks.
It looks like HUI/SPTMN commenced a major upward trend in July-2015. Not
coincidentally, this -- according to our world view -- is when an equity
bear-market got underway. Furthermore and again not coincidentally, there has
been a sharp pullback in HUI/SPTMN since the 11th February short-term bottom in
the broad stock market.
Assuming that an equity bear market did, indeed, begin last July, the HUI/SPTMN
ratio is likely to move much higher within the coming 6 months. In other words,
it is reasonable to expect further dramatic strength over the months ahead in
gold mining stocks relative to general mining stocks IF we are in the midst of
an equity bear market. Over the coming month this could be due to gold mining
stocks falling by less than general mining stocks.
The Currency Market
The "global US$ short position"
At this time last year there was a lot of talk in the financial press about the
huge US$ short position that was associated with the dollar-denominated debts
racked up over many years in emerging-market countries. This debt-related short
position was supposedly going to result in the Dollar Index making additional
large gains over the ensuing 12 months. Now, with the Dollar Index having
drifted sideways for 12 months and having had a downward bias for the past 4
months it is difficult to find any mention of the problematic US$ short
position. Did the problem magically disappear? Did the problem never exist in
the first place?
Fans of the US$ short position argument needn't fret, because if the Dollar
Index eventually breaks above the top of its drawn-out horizontal trading range
the argument will certainly make a comeback. It will make a comeback regardless
of whether or not it is valid, because it will have a ring of plausibility as
long as the Dollar Index is rising.
We aren't saying in the above paragraphs that the argument for a stronger US$
driven by the foreign-debt-related US$ short position is invalid. We are saying
that if the argument was correct a year ago then it is just as correct today
(since debt levels haven't fallen) and should therefore be just as popular
today. It is nowhere near as popular, though, because most fundamentals-based
analysis is concocted to match the price action.
Our view is actually that the "global US$ short position" is more of an effect
than a cause of exchange-rate trends. Major currency-market trends are caused by
differences in stock-market performance, real interest rates and monetary
inflation rates. When these factors conspire to create a downward trend in the
US dollar's foreign exchange value it becomes increasingly attractive for people
outside the US to borrow dollars. And when these factors subsequently conspire
to create an upward trend in the US dollar's foreign exchange value, debt
repayment becomes more costly for anyone with US$-denominated debt outside the
US.
In general, fundamentals-based analysis will look correct and achieve popularity
if it matches the price action, even if it is complete nonsense. The corollary
is that if fundamentals-based analysis is contrary to the recent price action
then hardly anyone will believe it, irrespective of the supporting facts and
logic. However, fundamentals-based analysis only has value when it is
independent of the price action and has the most value when it is both correct
and contrary to the price action.
Current Market Situation
There has been plenty of intra-day volatility, but in the grand scheme of things
very little has happened in the current market over the past few weeks. Prior to
last week the Dollar Index had worked its way down to near the bottom of its
short-term channel and last week it rebounded to near the middle of the channel.
We don't have an opinion regarding the most likely direction of the next 2-point
move in the Dollar Index, but we suspect that the horizontal range of the past
14 months will eventually end via an upside breakout.

Updates
on Stock Selections
Notes: 1) To review the complete list of current TSI stock selections, logon at
http://www.speculative-investor.com/new/market_logon.asp
and then click on "Stock Selections" in the menu. When at the Stock
Selections page, click on a stock's symbol to bring-up an archive of
our comments on the stock in question. 2) The Small Stock Watch List is
located at http://www.speculative-investor.com/new/smallstockwatch.html
 Company
news/developments for the week ending Friday 25th March 2016:
Company
news/developments for the week ending Friday 25th March 2016:
[Note: AISC = All-In Sustaining Cost, FS = Feasibility Study, FY = Financial
Year, IRR = Internal Rate of Return, MD&A = Management Discussion and Analysis,
M&I = Measured and Indicated, NAV = Net Asset Value, NPV(X%) = Net Present Value
using a discount rate of X%, P&P = Proven and Probable, PEA = Preliminary
Economic Assessment, PFS = Pre-Feasibility Study]
*Dalradian Resources (DNA.TO) published its financial reports for
the quarter and year ending 31st December 2015.
DNA is presently engaged in producing the FS and obtaining the environmental
permits for its Curraghinalt gold project in Northern Ireland. This will require
substantial expenditure in 2016, which is fully funded by the C$39M of working
capital on the company's balance sheet at the end of last year.
The FS is likely to confirm the PEA and show very robust economics for
Curraghinalt. There is, however, a significant permitting risk, even though the
project's environmental footprint should be fairly small.
*Ivanhoe Mines (IVN.TO) published its financial reports for the
quarter and year ending 31st December 2015.
Counting the balance of the payment due from Zijin (for its share of the Kamoa
copper project) as working capital, IVN's working capital at the end of last
year was US$493M. It had US$26M of long-term debt, giving us a net working
capital figure of US$467M (C$614M). This equates to C$0.79/share. Therefore,
despite the significant rise in its stock price over the past two months (from
the C$0.50s to the C$0.80s), the market's present valuation of IVN's impressive
mineral deposits is barely more than zero.
Regardless of how risky an asset is, the risk being taken by an investor is
small if the purchase price implies a near-zero valuation for the asset. By the
same token, the best asset in the world can be a risky investment if the
purchase price is high enough.
The next news of importance for IVN is expected to be the PEA for its Kipushi
zinc project in the DRC. Although the Kamoa copper project is bigger and further
advanced, we currently view Kipushi as the most prospective asset in IVN's
portfolio.
We think IVN is a 'hold' near the current price and in the current market
environment. A pullback to around C$0.70 would probably create a new buying
opportunity while a near-term rise to around C$1.00 would create an opportunity
for partial profit-taking.
*Petrus Resources (PRQ.TO) published its financial reports for the
quarter and year ending 31st December 2015.
The reports show that PRQ had net debt of C$227M at 31st December 2015, but as
at 22nd March 2016 this had been reduced to C$153M via an equity financing and
the acquisition of Phoscan. No significant debt repayments are due until the
second half of 2017.
2015 revenue net of royalties was C$83M. We expect that this year's revenue will
be similar.
There are hedges in place covering about 65% of this year's expected production
and 35% of 2017 production. This is what we want, as we expect oil and gas
prices to base this year above their Q1-2016 lows and to have commenced
multi-year advances by year-end. That is, we want leveraged exposure to rising
oil and gas prices from 2017 onwards.
PRQ is the solitary O&G company in the TSI List. It should be gradually
accumulated on weakness over the months ahead.
*Sabina Gold and Silver (SBB.TO) published its financial reports
for the quarter and year ending 31st December 2015.
SBB is doing fine. It had about C$18M of working capital at the end of last
year, which is more than enough to fund its business for the next 12 months or
until a construction decision is made for the Back River gold project in
Nunavut, Canada. Also, it has gone a long way towards de-risking the Back River
project by coming up with a mine plan that results in economic viability above
$1100/oz.
The final step in the pre-construction de-risking process is the completion of
environmental permitting. This is scheduled to happen over the next few months.
We continue to hope that SBB will merge with TMAC Resources (TMR.TO), because
the combination of these companies would make a lot of sense.
*Timmins Gold (TGD) reported the results of an updated PEA for its
Ana Paula gold project in Guerrero, Mexico. The main reason for the update is a
substantial reduction in the initial capex due to TGD's purchase of Goldcorp's
El Sauzal process plant and infrastructure.
The old (September-2014) PEA indicated that for a capital cost of US$164M Ana
Paula could be developed into an open-pit gold mine with average annual
production over an 8.2-year mine life of 116K-oz/yr at an AISC of $567/oz. At a
gold price of $1200/oz, the after-tax NPV(5%) and the IRR were estimated to be
$185M and 28.1%, respectively. The M&I resource was 1.86M ounces.
The new PEA is based on the same M&I resource, annual production and mine life,
but costs have been reduced. Due to the use of the El Sauzal plant the capital
cost has fallen to US$122M, and due to other factors the AISC has fallen to
$507/oz.
These cost reductions have greatly improved the economics. At a gold price of
$1200/oz the after-tax NPV(5%) and the IRR are now estimated to be $248M and
43%, respectively. These are very good numbers. Furthermore, according to the
latest analysis the project still has a robust IRR of 31% at a gold price of
only $1000/oz.
If the PEA figures are in the right ballpark then Ana Paula is a valuable
project. The main risk is the location. Guerrero has been a hazardous place for
mining over the past few years due to the criminal gangs that are active there.
Even taking into account the risk posed by the Guerrero location, Ana Paula
appears to be worth a multiple of TGD's current market valuation. Also, bear in
mind that TGD owns the in-production San Francisco gold mine, which is worth
very little at a gold price of less than $1200/oz but will probably be worth a
lot when gold makes a sustained move above $1250/oz.
Based on the Ana Paula PEA results, TGD would be a very strong candidate for new
buying right now if not for the $14M hole in its balance sheet. This hole will
have to be filled by 30th June, when a $10M loan becomes due.
List
of candidates for new buying
With all stock market sectors (including the gold-mining sector) stretched to
the upside on a short-term basis and showing signs of commencing multi-week
declines, nothing currently stands out as a candidate for new buying.
We expect that new buying opportunities will emerge within the gold-mining
sector by mid-April.
FCG
short-term trade exited
FCG (the Natural Gas Equity ETF) hit our short-term stop of US$4.06 on Wednesday
23rd March, causing the short-term trading position in this ETF to be removed
from the TSI List. The result was a one-month profit of 15%.
Saying
farewell to an old friend (Pretium Resources)
We have removed PVG from the TSI Stocks List. Based on the January-2011 price of
C$6.40 at which PVG was originally added to the List and last Friday's closing
price of C$6.79, the end result was a small gain of 6%. However, as is usually
the case with stocks that spend a few years in the TSI List, we have suggested
buying and partial selling at numerous prices along the way. For example, our
first partial-sell suggestion was in January-2012 when the stock price was about
C$15.60.
There are a few reasons for removing PVG from the List, including the
resource-estimate risk (there remains considerable uncertainty in the minds of
experienced geologists as to whether or not the resource model, and therefore
the mine plan and the FS, is valid), significant insider selling, delays to the
capex re-estimate (for unspecified reasons, the recent capex re-estimate was
reported more than two months later than originally forecast by the company),
and our own uncertainty regarding the stock's valuation.
With respect to the valuation, we recently wrote that near the current gold
price the stock's fair value would be US$5.50-$6.00 (10%-15% below the current
price). This is based on applying a 50% discount to our actual valuation to
account for the resource risk. The problem is that the stock's real value isn't
anywhere near the aforementioned range. It's either much higher (if the resource
model is correct) or much lower (if the resource model is wrong), and we have no
way of determining which is the more likely.
Whereas adding or removing a stock from the TSI List is a digital process (a
stock is either 100% in or 100% out of the List), our readers have the luxury of
being able to scale into and out of positions. Therefore, unless there's a major
short-term problem with a stock (not the case with PVG) or the stock was entered
as a short-term trade, a stock's removal from the TSI List should generally not
be viewed as a recommendation to make an immediate, complete exit.
With PVG our suggestion is to look for opportunities to scale out, because the
short-term risk is associated more with the overall market than with the company
itself (the company-specific risk is longer-term). Also, if you own PVG and do
not own PG.TO we suggest that you look for opportunities to shift out of the
former into the latter, with the first phase of the shift happening right away.
We are much more comfortable with PG than with PVG.
The
Osisko warrants (TSX: OR.WT)
Last week we wrote that our plan was to add OR.WT to the TSI List if it became
available in the C$1.50s within the next two months. To be more specific, OR.WT
will be added to the TSI List if it trades at C$1.55.
We will also be looking for opportunities to add the Alamos Gold and Sandstorm
Gold warrants mentioned in the latest Interim Update, but these warrants are
presently much further from attractive buy levels.
Chart Sources
Charts appearing in today's commentary
are courtesy of:
http://stockcharts.com/index.html
http://www.bloomberg.com/
http://www.barchart.com/
http://bigcharts.marketwatch.com/
http://www.economagic.com/
http://research.stlouisfed.org/
