|
-- Weekly Market Update for the Week Commencing 28th April 2008
Big Picture
View
Here is a summary of our big picture
view of the markets. Note that our short-term views may differ from our
big picture view.
Bonds commenced a secular BEAR market in
June of 2003. (Last
update: 22 August 2005)
The stock market, as represented by the S&P500 Index, commenced
a secular BEAR market during the first quarter of 2000, where "secular
bear market" is defined as a long-term downward trend in valuations
(P/E ratios, etc.) and gold-denominated prices. This secular trend will bottom sometime between 2014 and 2020. (Last update: 22 October 2007)
The Dollar commenced a secular BEAR market during the final quarter of 2000. The
first major downward leg in this bear market ended during the first
quarter of 2005, but a long-term bottom won't occur until 2008-2010. (Last update: 28 March 2005)
Gold commenced a
secular bull market relative to all fiat currencies, the CRB Index,
bonds and most stock market indices during 1999-2001. This secular trend will peak sometime between 2014 and 2020. (Last update: 22 October 2007)
Commodities, as
represented
by the CRB Index, commenced a secular BULL market in 2001. The first
major upward leg in this bull market ended during the second quarter of
2006, but a long-term
peak won't occur until at least 2008-2010. (Last update: 08 January 2007)
Copyright
Reminder
The commentaries that appear at TSI
may not be distributed, in full or in part, without our written permission.
In particular, please note that the posting of extracts from TSI commentaries
at other web sites or providing links to TSI commentaries at other web
sites (for example, at discussion boards) without our written permission
is prohibited.
We reserve the right to immediately
terminate the subscription of any TSI subscriber who distributes the TSI
commentaries without our written permission.
Outlook Summary
Market
|
Short-Term
(0-3 month)
|
Intermediate-Term
(3-12 month)
|
Long-Term
(1-5 Year)
|
Gold
|
Bearish
(21-Apr-08)
|
Neutral
(21-Apr-08)
|
Bullish
|
US$ (Dollar Index)
|
Bullish
(10-Mar-08)
| Bullish
(31-May-04)
|
Neutral
(19-Sep-07)
|
Bonds (US T-Bond)
|
Neutral
(03-Mar-08)
|
Bearish
(23-Jan-08)
|
Bearish
|
Stock Market (S&P500)
|
Bullish
(18-Mar-08)
|
Neutral
(26-Mar-07)
|
Bearish
|
Gold Stocks (HUI)
|
Bearish
(21-Apr-08)
|
Neutral
(21-Apr-08)
|
Bullish
|
| Oil | Bearish
(14-Jan-08)
| Bearish
(22-Oct-07)
| Bullish
|
Industrial Metals (GYX)
| Neutral
(28-Nov-07)
| Bearish
(09-Jul-07)
| Bullish
|
Notes:
1. In those cases where we have been able to identify the commentary in
which the most recent outlook change occurred we've put the date of the
commentary below the current outlook.
2. "Neutral", in the above table, means that we either don't have a
firm opinion or that we think risk and reward are roughly in balance with respect to the timeframe in question.
3. Long-term views are determined almost completely by fundamentals,
intermediate-term views by giving an approximately equal weighting to
fundmental and technical factors, and short-term views almost
completely by technicals.
Credit Contraction and Deflation
...there
cannot be deflation as long as the money supply is expanding.
...inflation is still occurring in the US (and pretty much everywhere
else, for that matter), albeit at a reduced rate.
Members of the deflation camp assert that the large-scale contraction
of credit happening within the banking system means that deflation is
upon us, even if the money supply is expanding. At the same time,
another camp is pointing to the breathtakingly rapid growth in M3 money
supply as evidence that hyperinflation is a near-term threat. In our
opinion, both camps are wrong*.
The argument of the first camp can, we think, be summarised as follows:
Inflation is an expansion in the total supply of money AND credit,
whereas deflation is the opposite (a contraction in the total supply of
money AND credit). At the present time the money supply may well be
expanding, but this monetary expansion is being more than offset by
credit contraction.
The flaw in the above argument can best be explained via a hypothetical
example. Consider the case of Johnny, who wants to borrow $1M to buy a
house. If Johnny borrows the money from his friend Freddy then the
transaction results in a $1M increase in the amount of credit within
the economy, but no inflation has occurred. All that has happened is
that $1M of purchasing power has been temporarily transferred from
Freddy to Johnny. By the same token, when Johnny pays Freddy back there
is a contraction of credit, but no deflation. There is also no
deflation even if Johnny defaults on his loan obligation to Freddy. In
this case Freddy will have made a bad investment, but the money he lent
to Johnny will still be somewhere in the economy. The point is that
credit expansion is not inherently inflationary and credit contraction
is not inherently deflationary.
But what if Johnny, instead of borrowing the million dollars from
Freddy, takes out a loan at his local bank and the bank makes the loan
by creating new money 'out of thin air'? In this case inflation has
certainly occurred. Nobody has had to temporarily forego purchasing
power in order for Johnny to gain purchasing power, but the total
existing supply of money has been devalued to some extent.
The critical difference is that when Johnny borrows from a bank the
transaction leads to an increase in the supply of MONEY. Inflation is
the increase in the supply of money that SOMETIMES results from credit
expansion; it is not credit expansion per se.
When Johnny pays back his loan to the bank the money that was created
out of thin air disappears into thin air; that is, deflation occurs.
But what if Johnny defaults on his bank loan?
If Johnny defaults on his loan then the bank will take a loss, but the
money that was lent to Johnny will remain within the economy. From the
bank's perspective it will be an investment gone bad, but an investment
going bad is certainly not the same thing as deflation. It could be
argued that when banks take large investment losses, that is, when a
substantial amount of the banking establishment's capital gets written
off, the collective ability of banks to lend more money into existence
will be impaired and deflation may eventually occur as a knock-on
effect. This is a valid argument, but as long as the money supply is
expanding it is not reasonable to state that deflation IS occurring; it
is only reasonable to state that the severely impaired balance sheet of
the banking system could lead to deflation at some future time. Quite
simply: there cannot be deflation as long as the money supply is
expanding.
This leads to the question: is the money supply currently expanding?
The answer is yes, but not anywhere near as rapidly as many people think. The chart at http://www.nowandfutures.com/key_stats.html
reveals that M3 has grown by a mind-boggling 19.5% over the past 12
months, but as was the case during the early 1990s it appears that this
broad measure of money supply is currently giving a 'major league'
FALSE signal. As noted in an earlier TSI commentary, the growth rates
of both M2 and M3 plunged during 1991-1993, making it seem as if
deflation were a clear and present danger, but the downturns in these
monetary aggregates during that period were almost solely due to sharp
declines in time deposits. And for the reasons previously explained,
time deposits should not be counted as money.
M3 is currently making it seem as if there is a lot more inflation than
is actually the case, mainly due to the inclusion of institutional
money market funds (MMFs) in this monetary aggregate. Institutional
MMFs have experienced incredibly rapid growth over the past year, but
institutional MMFs are not money and should therefore not be counted
when estimating the money supply.
Our preferred measures of money supply are TMS (the True Money Supply reported at http://www.mises.org/content/nofed/chart.aspx?series=TMS)
and what we call TMS+ (TMS plus Retail MMFs). TMS and TMS+ currently
have year-over-year (YOY) growth rates of around 3% and 6%,
respectively. In other words, our assessment is that the current US
inflation (money-supply growth) rate is 3-6%. Inflation is still
occurring, but at a much slower rate than it was during the early years
of this decade.
On a side note, the wrongness of M3's current signal is validated by
the happenings in the financial world. Inflation-fueled booms generally
continue until there is a deliberated or forced slowdown in the
inflation rate, that is, the booms continue until the central bank
takes steps to rein-in the inflation or until inflation slows under the
weight of market forces. The downturn in the US housing market and the
veritable collapse of the mortgage-lending industry -- the major
inflation-fueled booms of the past decade -- suggest that a substantial
SLOWING of the inflation rate HAS taken place. Or, to put it another
way, if M3's current signal were correct then we wouldn't have seen
what we have seen over the past year. Warren Buffett's quip that you
find out who has been swimming naked after the tide goes out applies
very well to inflation-fueled booms, in that investments that are
totally reliant on high inflation will be revealed for what they really
are once the monetary tide begins to ebb.
It is also worth noting that although inflation is a major driving
force behind the commodity bull market, commodity prices are generally
still very low in REAL terms. Therefore, while we are anticipating a
commodity shakeout over the next few months we think the long-term
upward trend in the commodity world has a considerable way to go.
In conclusion, it is clear that inflation is still occurring in the US
(and pretty much everywhere else, for that matter), albeit at a reduced
rate. Furthermore, if it hasn't already done so it is likely that the
inflation rate will bottom-out over the coming few months and then
embark on its next major upward trend. It is possible that consumers
are 'tapped out' and that the commercial banks are about to reduce the
rate at which they lend, but the government will never be 'tapped out'
and the central bank will always be able to monetise debt.
*There is a much
bigger camp that defines inflation and deflation in terms of changes in
the general price level, but we will ignore this camp because to define
inflation/deflation in this way it to confuse cause and effect and to
overlook the most pernicious consequences of inflation. If inflation
were simply an increase in the general price level (a reduction in the
purchasing power of the currency) then it wouldn't be a big problem.
The reason it is a big problem is that it re-distributes wealth and
results in the misallocation of resources.
Economic Bust and Deflation
Although deflation (a contraction in the supply of money) would, in the
current environment, almost certainly lead to or be accompanied by an
economic bust, "deflation" and "economic bust" are not synonymous. In
fact, under the current monetary system an economic bust is more likely
to be accompanied by rising INFLATION due to the counter-cyclical
monetary and fiscal policies that have become so popular. And this is
regardless of the reality that such policies can only do long-term
damage by leading to more mal-investment. For example, the US economy
would be in far better shape than it is today if the Fed and the US
Government had not, during 2001-2003, attempted to 'inflate away' the
effects of the burst stock market bubble.
That the US economy managed to recover at all following the downturn of
the early-2000s is testament to the remnants of capitalism, not the
massive government "economic stimulus" operations that occurred at the
time. The recovery actually happened in spite of, not because of, the
official stimulus, but the recovery was never particularly strong
because you can't fully recover from the inevitable adverse effects of
rampant inflation in the face of even more inflation.
More inflation can't possibly help, but it will almost certainly be the prescription.
Favourite Greenspan Quotes
"I've been able to string more words into fewer ideas than anybody I know, and I'm continuing to do that."
"If I have made myself clear then you must have misunderstood me."
FOMC
The market expects the Fed to cut by 25 basis points on Wednesday. That's also what we expect.
The Stock
Market
Current Market Situation
Our view continues to be that the US stock market is experiencing a
bear-market rally that won't end until sentiment indicators reveal the
return of optimism/complacency. Significant additional price gains will
probably have to occur to get the market to such a point. At the same
time, the lack of belief in the recent rally limits the downside risk.
We therefore remain short-term bullish.
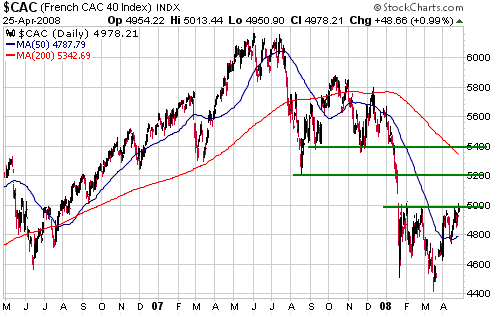
Just for a change we thought we'd take a look at the French stock
market, as represented on the following chart by the CAC40 Index.
The CAC appears to be close to completing a basing pattern. The top of
the base is at 5000, and a break above this resistance would project a
move up to the mid 5000s. That is, the CAC has short-term upside
potential of around 10%.
Energy Stocks
Although their fundamentals are quite different, the stocks of oil,
natural gas and coal producers have been trading in unison over the
past few months. For example, when the oil price jumped on Friday in
response to news of short-term oil supply disruptions (a strike at a
Scottish oil refinery and more problems in Nigeria) and potential
disruptions (it was reported that a ship under the control of the US
Navy fired shots at another vessel in the Strait of Hormuz), traders
drove up the prices of natural gas and coal stocks along with the
prices of oil stocks.
The oil market will always gyrate in response to the sort of news that
hit the wires on Friday, but over the past year the currency market has
been the dominant driver of oil's price trend. Specifically, oil has
had a strong inverse correlation with the US$ (a strong positive
correlation with the euro). Therefore, with more evidence of a US$
bottom (a euro peak) having emerged during the second half of last week
the short-term downside risk in the oil market has just increased.
Given the tendency for natural gas, oil and coal stocks to trade
together, a sharp downward correction in the oil sector is likely to
put irresistible downward pressure on natural gas and coal stocks.
If, like us, you have substantial exposure to natural gas and coal, and
especially if you have substantial exposure to oil, you should consider
scaling back a bit over the coming week or so. However, make sure that
you retain a sizeable core position in energy.
The uranium sector is marching to the beat of its own drummer. It did
not participate to any meaningful extent in the recent energy rally and
may not participate in the coming pullback.
China's Stock Market
China's Government made many attempts during the second half of 2006
and the first half of 2007 to dampen stock-market speculation,
including, in May of last year, tripling the stamp duty charged on
stock trading from 0.1% to 0.3%. The Shanghai Stock Exchange Composite
Index (SSEC) continued its relentless ascent, however, until last
October when it finally buckled under the weight of the Government's
cooling-off tactics and its own massive over-valuation.
By the middle of last week the SSEC was down by 50% from its
October-2007 peak and at the low end of the 3000-3500 range we'd
previously identified as a likely area for a bottom. It was at this
point that the Government became worried enough to cut the stamp duty
on stock trading back to 0.1%. The 0.2% change in stamp duty might seem
trivial, but it was rightly taken as evidence of a 180-degree shift in
official policy towards the stock market and was the catalyst for the
market's biggest single-day gain in more than six years.
Last week's price action suggests that the market has made a low that
will hold for at least a few months, but we aren't jumping to the
conclusion that the ultimate correction low is in place. In our
opinion, there's a significant risk that China's stock market will
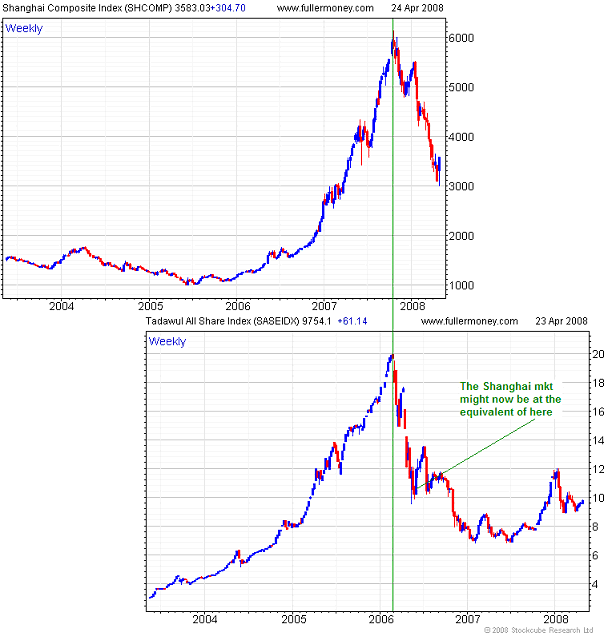
follow the example set by the Saudi stock market during 2006. The
following chart comparison of the Shanghai Composite Index and the
Tadawul All Share Index (a proxy for the Saudi stock market) -- using
weekly charts from www.fullermoney.com
-- illustrates what we mean. Notice that the Saudi market was cut in
half by the initial decline from its bubble peak, but didn't reach a
sustainable bottom until it had lost about two-thirds of its value. If
the SSEC follows a similar path then it will rebound/consolidate for
1-3 months before declining to around 2000.
Two things lend
credibility to the "Saudi model", the first being that although China's
stock market is nowhere near as over-valued today as it was 6 months
ago it is still very expensive by traditional valuation metrics. This
was why we suggested, a few weeks ago, that a potential bottoming and
upward reversal in the Shanghai market should be played by taking a
long position in the more attractively valued Hong Kong stock market.
The second reason to take the "Saudi model" seriously is the awkward
position in which China's Government finds itself due to the rampant
effects of inflation and other ill-conceived policies. Soaring
commodity prices and electricity shortages are much bigger issues than
the weakness in the stock market, meaning that the Government probably
isn't in a position to use monetary easing to support the stock market.
Its first priority, we think, will be to do whatever it can to suppress
the prices of the basic necessities of life. These efforts at price
control will inevitably lead to more shortages, but economic logic
rarely gets in the way of any government's action plans.
This week's
important US economic events
| Date |
Description |
Monday Apr 28
| No important events scheduled
|
Tuesday Apr 29
| Consumer Confidence
| | Wednesday Apr 30
| FOMC Policy Statement
Chicago PMI
Employment Cost Index
| | Thursday May 01
| ISM Index
Personal Income and Spending
Construction Spending
| | Friday May 02
| Monthly Employment Report
Factory Orders
|
Gold and
the Dollar
Currency Market Update
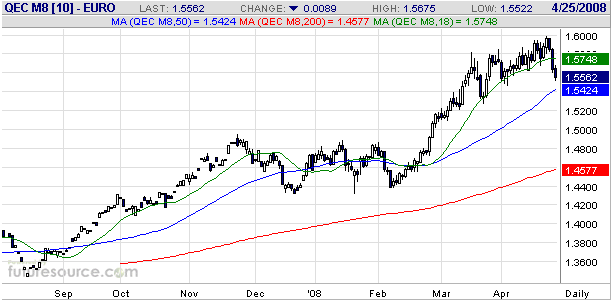
Last week provided us with more evidence that the US$ has made an
intermediate-term bottom. Of particular note: the Swiss Franc broke
decisively below the support level mentioned in the 21st April Weekly
Update (0.9750) and, as illustrated by the following daily chart, the
June euro futures contract achieved consecutive daily closes below its
18-day moving average.
In our opinion, the
Dollar Index is 5-6 weeks into a rebound that will last 3-6 months. One
way for speculators to 'play' this potential outcome would be to
average into FXE Sep-2008 $150 put options (FXE is an ETF that tracks
the euro), preferably on days when the euro is bouncing. A protective
'stop' could be placed just above the recent high, the idea being to
exit if the euro closes at a new high.
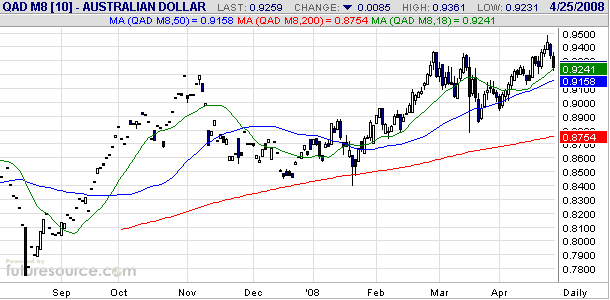
The major currency with the most downside potential over the coming
months is the Australian Dollar (see chart below), so speculators could
also consider averaging into FXA Sep-2008 $90 put options (FXA tracks
the A$). Note, though, that FXA puts are quite illiquid. Note also that
the A$ has not yet signaled a peak, which means that a final surge
could still be in store and that there is no obvious chart-based level
at which to place a 'stop'. In other words, a bet against the A$ is
more risky than a bet against the euro, but if offers greater profit
potential.
Gold and Silver
Gold and the Euro
No financial-market relationship always works. The markets are just not
that simple! However, a relationship that USUALLY works is gold's
tendency to lead the euro at important turning points.
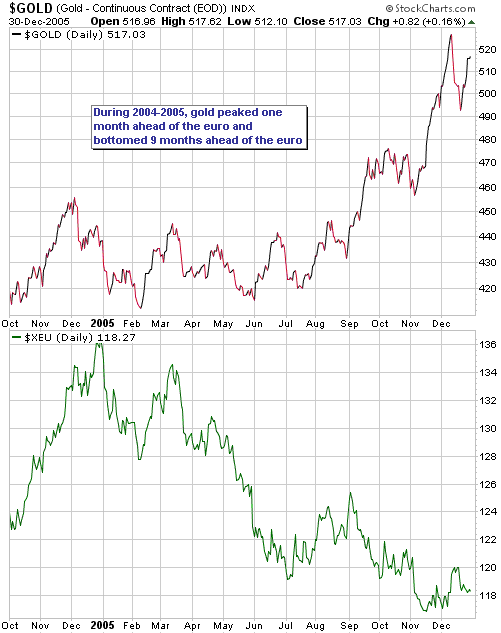
A great example of the lead-lag relationship between gold and the euro
occurred during 2004-2005. With reference to the following chart, note
that gold peaked near the beginning of December-2004 whereas the euro
didn't peak until the final day of that month. Note, as well, that gold
then bottomed in February of 2005 whereas the euro didn't bottom until
November. In other words, gold peaked 3-4 weeks ahead of the euro and
then bottomed about 9 months ahead of the euro.
The current situation
is that gold's peak appears to have led the euro's peak by about 5
weeks. As was the case during 2005, we suspect that gold will reach its
correction low many months before the euro reaches a correction low of
its own.
Our best guess at this time is that gold will bottom at $800-$850 (probably closer to $800) during either May or June.
Silver
In the 19th March Interim Update we said that a pullback to $800-$850
by gold would probably be accompanied by a pullback to around $15 by
silver. As evidenced by the following monthly chart from www.mrci.com,
$15 represents the long-term resistance (now support) that was
surmounted in January. When a market breaks above long-term resistance
it will often move sharply higher and then pull back to 'test' the
breakout before resuming its advance.
Once silver's breakout has been properly tested -- an event that could
entail a short-lived move below $15 -- the stage will be set for the
next phase of silver's bull market.

Gold Stocks
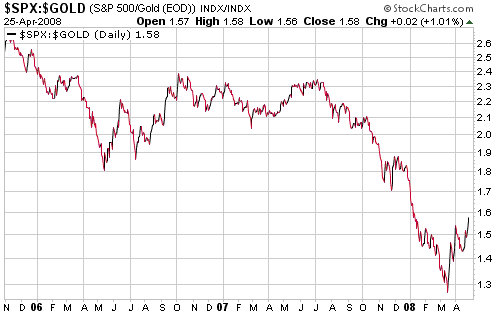
The following chart shows that the S&P500 Index in gold terms (the
SPX/gold ratio) ended last week at a 3-month high. Strength in the
broad stock market relative to gold creates a substantial headwind for
gold stocks.
Correction lows for
gold-stock indices such as the HUI probably won't occur until the
SPX/gold ratio peaks, and the SPX/gold ratio probably won't peak until
stock market sentiment once again becomes optimistic. This could happen
within the coming month, but in the mean time there is likely to be
significant additional weakness in the gold sector.
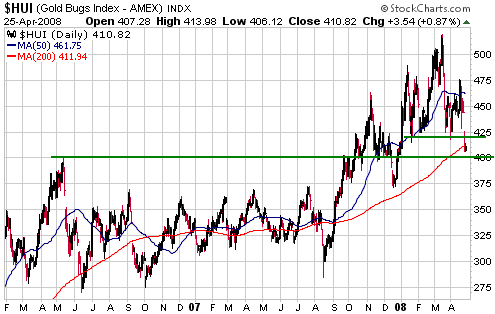
In last week's Interim Update we mentioned that the HUI had dropped to
near support at 420 after falling for 5 days in a row, and might
therefore rebound for a few days before resuming its decline. It ended
up falling for a 6th day in a row, decisively breaching support at 420
in the process, before bouncing on Friday.
There is very little chance that a correction low is already in place
because: a) the price action is bearish (a "head and shoulders" top
appears to have just been completed), b) momentum indicators have not
yet reached the sorts of 'oversold' extremes that normally occur PRIOR
to important correction lows, and c) the main drivers of the correction
(rebounding broad stock market, narrowing credit spreads, rebounding
US$) remain intact. One positive is that most gold stocks are at very
depressed levels relative to gold bullion. This mitigates the downside
risk to some extent and means that there should be a very powerful
rally in the gold sector once gold bullion bottoms out, but we suspect
that gold bullion is still about 10% above its ultimate correction low.
So, even if the HUI doesn't get any cheaper relative to gold we could
still see it drop to the mid-300s within the coming few weeks.
We won't be surprised if there's some consolidation in the gold sector
this week. Note, though, that the support in the 420s that was breached
last Thursday -- refer to the following chart for details -- now
constitutes considerable overhead resistance. We therefore will be
surprised if the HUI closes above 430 in the near future.
Update
on Stock Selections
(Note: To review the complete list of current TSI stock selections, logon at http://www.speculative-investor.com/new/market_logon.asp
and then click on "Stock Selections" in the menu. When at the Stock
Selections page, click on a stock's symbol to bring-up an archive of our comments on the stock in question)
 Japan Japan
We are 'long' Japan via JEQ (the Japan Equity Fund) and some January-2009 EWJ (iShares Japan) call options.
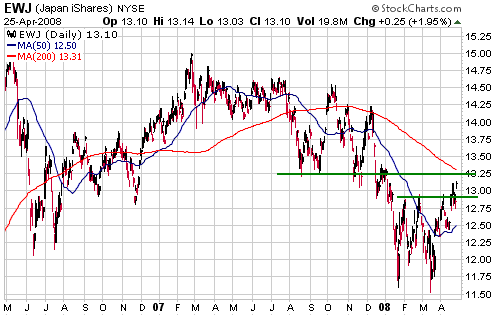
The following chart shows that EWJ has broken above resistance at
US$12.90 and is approaching more significant resistance at 13.25. A
decisive move above 13.25 would be a clear sign that an
intermediate-term bottom was put in place during the first quarter of
this year.
JEQ is a low-risk way
to play the Japanese stock market's considerable upside potential. At
Friday's closing price of US$7.23 it is low in absolute terms and
relative to EWJ. Furthermore, it is trading at a 7% discount to its net
asset value. It has resistance at US$7.25-US$7.50, so rather than
establishing a new position or adding to an existing position
immediately it would be reasonable to wait for a daily close above
7.50.
Another way to participate in Japan's recovery would be to buy the
shares of Mitsubishi Financial (NYSE: MTU), Japan's largest bank. As
indicated by the following chart, MTU bottomed at $8 between November
and March. It has since rebounded to the near the top of its 2-year
channel and its 9-month trading range. Any significant additional
strength from here would be a clear signal that an intermediate-term
rally had begun.
MTU has greater upside potential than JEQ, but more downside risk.

By the way, the
Japanese bond market has just experienced its biggest 2-week decline in
many years. This is a POSITIVE omen for the Japanese stock market.
Chart Sources
Charts appearing in today's commentary
are courtesy of:
http://stockcharts.com/index.html
http://www.futuresource.com/
http://www.fullermoney.com/

|

