![]()
![]()
![]()
![]()
-- Weekly Market Update for the Week Commencing 28th May 2018
Big Picture
View
Here is a summary of our big picture
view of the markets. Note that our short-term views may differ from our
big picture view.
The BULL market in US Treasury Bonds that began in the early 1980s ended in mid-2016, but there will be many years of topping action in bond prices and bottoming action in bond yields before major new trends get underway. A major decline in government bond prices will unfold during the 2020s. (Last update: 11 September 2017)
The stock market, as represented by the S&P500 Index, commenced a secular BEAR market during the first quarter of 2000, where "secular bear market" is defined as a long-term downward trend in valuations (P/E ratios, etc.), gold-denominated prices and inflation-adjusted prices. This secular trend will bottom in 2020 or later. (Last update: 11 September 2017)
A cyclical BEAR market in the US Dollar began in 2016-2017. (Last update: 11 September 2017)
Gold commenced a secular bull market relative to all fiat currencies, the CRB Index, bonds and most stock market indices during 1999-2001. This secular trend will peak in 2020 or later. (Last update: 11 September 2017)
Commodities,
as represented by the CRB Index, commenced a
secular BULL market in 2001 in nominal dollar terms. The first major
upward leg in this bull market ended during the first half of 2008, but
a long-term peak won't occur until 2020 or later.
(Last
update: 11 September 2017)
Copyright
Reminder
The commentaries that appear at TSI
may not be distributed, in full or in part, without our written permission.
In particular, please note that the posting of extracts from TSI commentaries
at other web sites or providing links to TSI commentaries at other web
sites (for example, at discussion boards) without our written permission
is prohibited.
We reserve the right to immediately
terminate the subscription of any TSI subscriber who distributes the TSI
commentaries without our written permission.
True
Fundamentals Summary
[Notes:
1) The date shown next to the current True Fundamentals Model (TFM) signal is
when the most recent change occurred. 2) Charts of the Gold and Equity
TFMs are included in the "Charts and Indicators" section of the TSI web
site]
| Market | True Fundamentals Model (TFM) |
| Gold (US$ Price) | Bearish (12 Jan 2018) |
| US Equity (SPX) | Bearish (25 May 2018) |
| Currency (Dollar Index) | Bullish (27 Apr 2018) |
| Commodities (GNX) | Neutral (20 Apr 2018) |
Last week's posts at the TSI Blog
Incomplete silver COT analysis, revisited
Summary of current
thinking/positioning
1) The Dollar Index and the euro
are very close to critical levels that shouldn't be breached if the recent
moves are counter-trend.
2) Gold has broken out to the upside in
euro terms, but in US$ terms it has not yet negated the 15th May downside
breakout. This creates uncertainty regarding the bullion market's
short-term prospects.
3) The SPX likely will make a new all-time
high by the end of next month. The risk/reward is not bullish, though,
because a move to well above the January high is unlikely.
4) The
multi-year upward trend in commodity prices that got underway in
early-2016 appears to have resumed. If so, the Australian and Canadian
dollars should be relatively strong over the next few months.
5)
The oil market has made a price top that should hold for 1-2 months or
longer.
6) There is no evidence that the Swiss Franc has bottomed
against the US$, but taking a 3-6 month view this currency's risk/reward
looks very attractive.
7) A multi-month bottom is in place for the
T-Bond. New lows in bond prices (new highs in bond yields) are likely
before year-end, but the T-Bond price should have an upward bias over the
coming 2-3 months.
8) Holding a cash reserve of around 35%.
The T-Bond has
bottomed
In the "Summary of current
thinking/positioning" section of the preceding two Weekly Updates we wrote
that the T-Bond was close to a multi-month bottom. It's too soon to know
for sure, but there is now a high probability that the bottom was put in
place on Friday 18th May. On that day, the nearest T-Bond futures (the
June-2018 contract) made a new bear-market low and then recovered to end
the day with a gain.
Also, due to the 18th May upward reversal and
last week's price gain, the June T-Bond's 15th May drop below lateral
support to a new multi-year low looks like a false downside breakout.
Refer to the following chart for details.
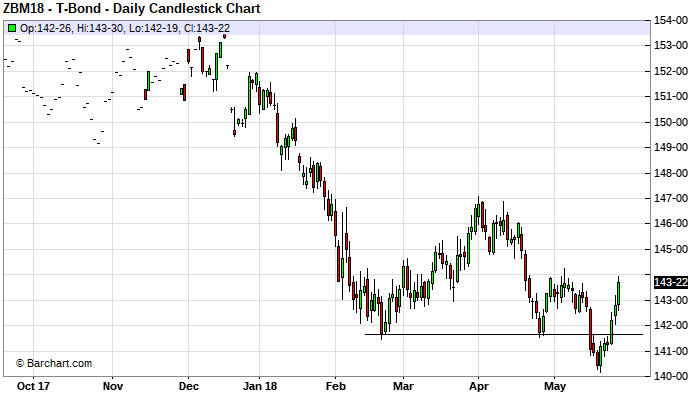
Considering the extent to which speculators piled onto the short side
of the Treasury market in the lead-up to the recent upward reversal, it's
likely that the T-Bond will make significant additional price gains before
resuming its longer-term bearish trend. We guess that it will rise to
around 147 (resistance defined by the April high) within the next three
months, but be aware that the mid-May low in the 140-141 range could be
tested as part of a bottoming process.
If the T-Bond rebound
continues it will have a positive effect on gold's true fundamentals. In
fact, it has already had a positive effect, in that our gold model became
a little less bearish last week.
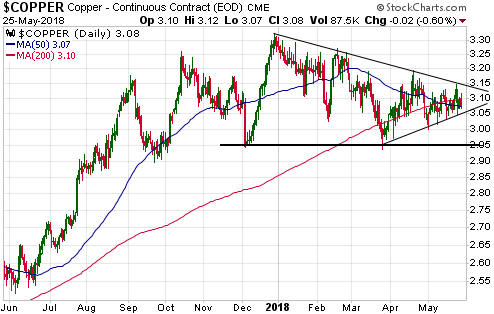
Commodities
The copper market is
coiling
The copper price is working its way into the apex
of the triangle drawn on the following daily chart. For this coming week,
a daily close above $3.15 or below $3.05 would be a breakout from this
'coiling' pattern.
A daily close above $3.15 would suggest that
copper was on its way to new multi-year price highs. A daily close below
$3.05 would point to a re-test of intermediate-term lateral support at
$2.95, but triple bottoms are rare so it's likely that the next test of
this support will fail. In other words, a daily close below $3.05 would
suggest that a decline to well below $2.95 was on the cards.
We
have been expecting an upside breakout in the copper price following a
correction low in March or May, but at this point there's more to be lost
than gained by trying to anticipate the direction of the coming breakout.
Oil Reversal
Last week the oil market signaled
the start of a meaningful correction. Our reaction: It's about time!
Speculative enthusiasm for oil had become very elevated by late last
year. This and some stock market turmoil led to a sharp pullback in the
oil price from late-January to mid-February, but speculators remained
committed to the upward trend (speculators retained most of their
collective net-long exposure in the oil futures market). Also, the
fundamental backdrop (as indicated by the futures curve) turned supportive
last November and stayed so. With tight supply relative to demand and
speculators resilient in their bullishness, the rally resumed in
mid-February and continued until last Tuesday with only two minor
corrections along the way. It was a 25% price rise in the space of only
three months.
The oil futures curve is still downward-sloping,
meaning that the market is still in 'backwardation' and that the supply
situation remains tight relative to demand. However, the backwardation is
not as pronounced as it was a few weeks ago and on Friday 25th May there
was news that an OPEC supply increase was on the way. This news was the
catalyst for a bout of speculative long liquidation.
Given that
last week's plunge ended at the 50-day MA (the blue line on the following
daily chart) and that no lateral support of significance has been breached
to date, it's possible that we are dealing with a sharp 1-2 week
correction within an on-going short-term upward trend. However, the fact
that last week was both an outside-down and a key-reversal week suggests
to us that a top that will hold for 1-2 months or longer is in place.
There could be a rebound this week, but we think that the largest
oil-market correction since mid-2017 has begun. At this time the most
plausible target for a correction low is lateral support near $58.
Gas stocks follow oil stocks
There were
tentative signs of life in US natural gas (NG) futures market last week,
although in the grand scheme nothing has changed. NG's price action since
early-2017 has been almost as uninspiring as the gold-mining sector's
price action over the same period.

It is notable that even though the NG price gained about 4% last week
and ended the week near a 3-month high, the First Trust Natural Gas ETF
(FCG), a proxy for the NG sector of the stock market, fell by almost 5%.
It is clear that NG stocks sold off in sympathy with oil stocks last week.
It's actually not unusual for NG stocks to be influenced more by oil
stocks than the NG price. NG's strength relative to oil will tend to
determine whether NG stocks are strong or weak relative to oil stocks, but
usually these two equity sectors trend in the same direction.
The
tendency of NG stocks to trend with oil stocks can be seen by comparing
the two charts displayed below. The charts show that XOP, a proxy for oil
stocks, has been much stronger than FCG since early-February of this year,
but that the ETFs consistently moved in the same direction over the past
2.5 years.
Due to last week's price action, traders who purchased FCG for a
short-term trade should look for an opportunity to exit. However, it would
be reasonable to retain intermediate-term positions.
The Stock Market
There was a 2-3 week period of
excitement spanning late-January and early-February when the 'short
volatility' trade blew up in spectacular fashion. Apart from that, the US
stock market has been uneventful so far this year, with most stock indices
spending almost all of their time between the late-January high and the
early-February low. This is surprising considering what has happened on
the interest rate and political fronts. However, at the start of this year
we thought that the largest decline would occur during the second half and
that is still the case.
Over the next two months we expect that the
stock market will be helped by a pullback in interest rates (the Fed will
hike its targeted rates again in June, but the Fed is well behind the
market). However, we also expect that the upside will be limited to
marginal new highs in the senior indices. The upside appears to be limited
because the monetary backdrop is tight, especially compared to the
monetary conditions that prevailed over the past several years, and likely
to get tighter as the Fed ramps up the pace of its balance-sheet reduction
(its QT program).
The Fed's QT program is happening via the
non-replacement of maturing debt securities. Consequently, it doesn't
involve a steady decline in the balance sheet. Instead, step changes
(sudden reductions) will occur on the dates when a large dollar amount of
the Fed's bond holdings is due to mature. For more information refer to
the article posted
HERE
and the Fed's portfolio
HERE.
The idea is that an immediate impact of the Fed's QT
program, in the form of lower prices for stocks and bonds, should be felt
on the days when a large quantity of the Fed's holdings are scheduled to
mature. The last such date was 15th May, when there was a sharp decline in
the T-Bond and a 20-point decline in the SPX. The next such date is 31st
May (this coming Thursday). It will be interesting to see if there is a
similar effect.
Turning to the charts we see that the NDX, the
strongest of the three senior US stock indices (the SPX, the NDX and the
Dow Industrials), is not far from its high for the year. We won't be
surprised if the NDX tests its 2018 high during the first two trading days
of this week, but we will be surprised if it makes a solid break into
new-high territory within the next two weeks. Our guess is that more
choppiness lies in store over the coming fortnight.
The most significant price action that we noticed over the past week
was the upside breakout by the Dow Transportation Average (TRAN).
Lastly, it's worth mentioning that some of the world's most iconic
packaged-food companies have been pummeled on the stock market over the
past 12 months or so. Below are charts showing two of the best examples.
The first chart shows that Kraft-Heinz (KHC) is down from $90 to the
mid-$50s and the second chart shows that Campbell Soup (CPB) is down from
$60 to $34.
The packaged-food companies have "inflation" risk (the
risk that their costs will rise faster than they are able to increase
their selling prices) and tend to have high debt levels, implying that
they are vulnerable to rising interest rates. At the same time, they are
essentially recession proof and now have decent dividend yields.
These stocks may be worth buying for a 2-4 month trade, but we don't know
enough about their balance sheets or earnings prospects to have an opinion
on their investment merits.
This week's
significant US economic events
[Notes:
1) The most important events
(to the markets) are shown
in bold. 2) A list of global economic events can be found
HERE]
| Date | Description |
| Monday May-21 | US markets closed for public holiday |
| Tuesday May-22 |
Case-Shiller Home Price Index Consumer Confidence |
| Wednesday May-23 | Q1 GDP (revised) |
| Thursday May-24 |
Personal Income and Spending Chicago PMI Pending Home Sales Index |
| Friday May-25 |
Motor Vehicle Sales Construction Spending ISM Mfg Index Monthly Employment Report |
Gold and the Dollar
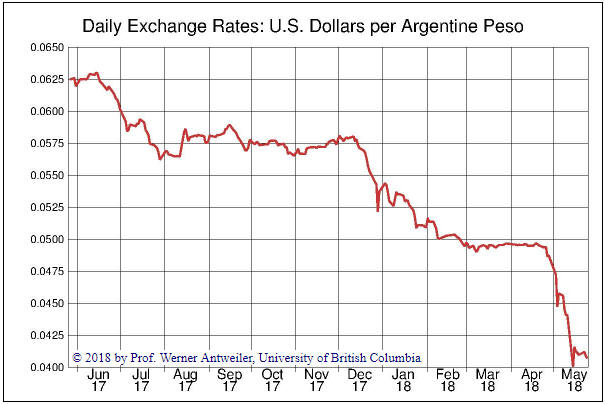
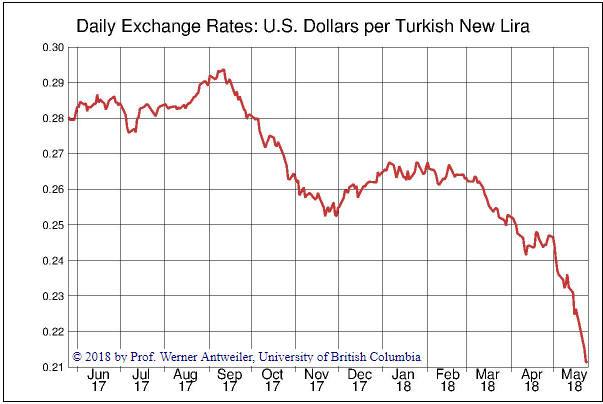
The Peso is down by about 35% and the Lira is down by about 25% over
the past 12 months, so Argentina has been the leader in the race to zero.
However, the chart of the Peso/Lira exchange rate displayed below shows
that there was a significant change over the past two weeks. The Peso/Lira
rate has reversed upward in dramatic fashion, not due to strength in the
Argentine Peso but due to the rapid weakening of the Turkish Lira.
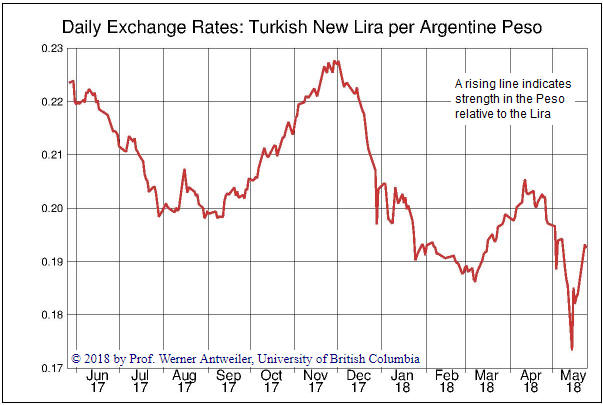
(The above charts are from the
Pacific Exchange Rate Service)
If we had to place a bet today
on which globally-significant currency would be the world's weakest over
the coming 12 months we would pick the Turkish Lira. The main reason
relates to governance.
Recep Erdogan, Turkey's president, is
aggressively consolidating power and clearly is striving to be the
country's dictator. He is very much against the actions that would have to
be taken to rein-in inflation and stabilise the currency, and if he is
successful in the elections scheduled for 24th June he will have greater
influence over the actions of the central bank.
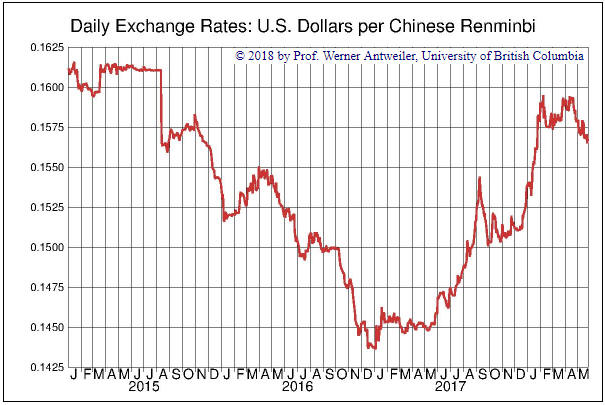
The Yuan
The following chart
shows that China's currency, the Yuan, was in a strong downward
(weakening) trend relative to the US$ throughout 2015-2016, but that since
the beginning of 2017 it has recouped a substantial portion of its
2015-2016 loss. What were the main causes of this performance?
China's government was blamed by some, most notably Donald Trump, for
the Yuan's weakening trend in 2015-2016. According to this line of
thinking, China's government was manipulating the currency downward
relative to the US$ to gain an international trade advantage. However, we
know by looking at the change in China's foreign currency reserves that
this was not the case. In fact, China's government intervened aggressively
during 2015-2016 in an effort to prop-up the Yuan.
The Yuan's
weakness during 2015-2016 was a reaction to a) US$ strength (the US$
trended upward against most currencies during that period), b) capital
flight from China and c) the Yuan being over-valued due to a decade of
relatively fast monetary inflation. It would have weakened a lot more if
not for China's government spending about a trillion dollars of its
reserves as part of a Yuan support effort that also involved imposing
stricter limits on sending money out of China.
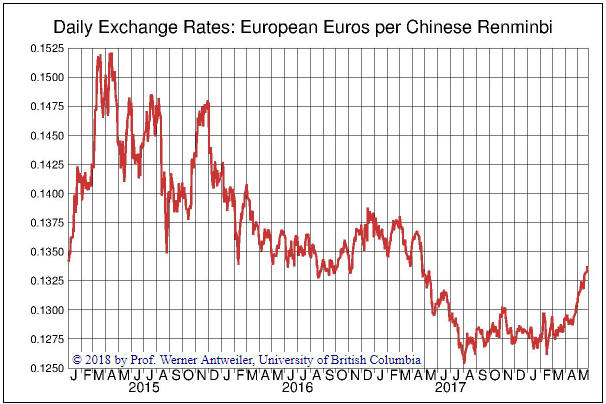
The upward trend in
Yuan/US$ over the past 17 months is largely a mirage created by weakness
in the US$. This is evidenced by the following chart, which shows that
there was no meaningful strengthening of the Yuan relative to the euro
prior to the past two months.
Updates
on Stock Selections
Notes: 1) To review the complete list of current TSI stock selections, logon at
http://www.speculative-investor.com/new/market_logon.asp
and then click on "Stock Selections" in the menu. When at the Stock
Selections page, click on a stock's symbol to bring-up an archive of
our comments on the stock in question. 2) The Small Stock Watch List is
located at http://www.speculative-investor.com/new/smallstockwatch.html
![]() Company
news/developments for the week ending Friday 25th May 2018:
Company
news/developments for the week ending Friday 25th May 2018:
[Note: AISC = All-In Sustaining Cost, FS = Feasibility Study, FY =
Financial Year, IRR = Internal Rate of Return, ISR = In-Situ Recovery,
MD&A = Management Discussion and Analysis, M&I = Measured and Indicated,
NAV = Net Asset Value, NPV(X%) = Net Present Value using a discount rate
of X%, NSR = Net Smelter Return, P&P = Proven and Probable, PEA =
Preliminary Economic Assessment, PFS = Pre-Feasibility Study]
*Cobalt 27 Capital Corp. (KBLT.V) has completed its first
streaming deal, and a good deal it appears to be.
The streaming
deal is associated with the 11.3% stake owned by Highlands Pacific
(HIG.AX) in the fully-operational, long-life Ramu nickel/cobalt project in
Papua New Guinea (PNG). The project is majority-owned and operated by
Metallurgical Corporation of China (MCC), a large Chinese company listed
in Hong Kong.
KBLT has purchased 55% and 27.5%, respectively, of
HIG's share of Ramu's cobalt and nickel production. This is expected to
result in annual production to KBLT's account of 450K pounds of cobalt and
2.25M pounds of nickel. The cost to KBLT is an upfront payment of US$113M
plus $4 for each pound of cobalt and $1 for each pound of nickel.
In addition, KBLT has purchased 13% of HIG via a private placement priced
at A$0.105/share, giving HIG's treasury an A$15M boost. HIG will use this
money to fund the repurchase, at a cost of US$15M, of part of the
cobalt/nickel stream sold to KBLT.
The net result of the
aforementioned transactions is that KBLT will be paying about US$110M to
get:
1) 390K pounds/year of cobalt production at a cost of
$4/pound.
2) 2M pounds/year of nickel production at a cost of
$1/pound.
3) 13% of HIG.
At current metal prices of around
$40/pound for cobalt and $6.50/pound for nickel, the stream would generate
about US$25M/year of gross profit for KBLT. Applying a fairly conservative
multiple of 10 to this gross profit figure gives us a rough valuation of
US$250M for the stream. Adding US$15M for the current market value of the
142M HIG shares to be owned by KBLT, we get a total value of US$265M.
In summary, for a cost of US$110M we estimate that KBLT has obtained
something worth about US$265M.
If our calculations are in the right
ballpark then KBLT has just done a deal that adds about US$155M, or about
US$3.00 (C$3.80) per share, to the company's value.
In other
positive KBLT news:
1) The company is in advanced discussions with
two local PNG stakeholders in Ramu to purchase another cobalt/nickel metal
stream on the project on the same terms as the deal with HIG. The deal
with the local stakeholders is expected to be about 77% the size of HIG
deal and cost US$87M. If so, it would add another US$100M (C$2.40/share)
of value to the company.
2) The company "anticipates paying a
quarterly dividend equal to a meaningful portion of free cash flow from
future streaming and royalty investments."
At current metal
prices and taking into account the HIG deal, our estimate of KBLT's net
asset value (NAV) is C$14.50-$15.00. Our estimated NAV will rise to
C$17.00-C$17.50 if the deal with the two local Ramu stakeholders is
completed as mentioned above.
The lack of a positive stock market
reaction to the news of KBLT's streaming deal could be related to the PNG
location of the Ramu project. The market undoubtedly would have preferred
a deal linked to a project in a lower-risk location, but if Ramu was in
Australia or North America then KBLT would get a lot less metal for the
same payment.
![]() List
of candidates for new buying
List
of candidates for new buying
From within the ranks of TSI
stock selections the best candidates for new buying at this time, listed
in alphabetical order, are:
1) ALK.AX (last Friday's closing price:
A$0.29)
2) EGD.V (last Friday's closing price: C$0.39)
3)
GRG.V (last Friday's closing price: C$0.45)
4) KBLT.V (last
Friday's closing price: C$11.78)
5) PG.TO (last Friday's closing
price: C$2.78)
The above list is limited to five stocks. It will
sometimes contain less than five, but it will never contain more than five
regardless of how many stocks are attractively priced for new buying.
Chart Sources
Charts appearing in today's commentary
are courtesy of:
http://stockcharts.com/index.html
http://www.barchart.com/