|
-- Weekly Market Update for the Week Commencing 28th June 2010
Big Picture
View
Here is a summary of our big picture
view of the markets. Note that our short-term views may differ from our
big picture view.
In nominal dollar terms, the BULL market in US Treasury Bonds
that began in the early 1980s will end by mid-2010. In real (gold)
terms, bonds commenced a secular BEAR market in 2001 that will continue
until 2014-2020. (Last
update: 09 February 2009)
The stock market, as represented by the S&P500 Index, commenced
a secular BEAR market during the first quarter of 2000, where "secular
bear market" is defined as a long-term downward trend in valuations
(P/E ratios, etc.) and gold-denominated prices. This secular trend will bottom sometime between 2014 and 2020. (Last update: 22 October 2007)
A secular BEAR market in the Dollar
began during the final quarter of 2000 and ended in July of 2008. This
secular bear market will be followed by a multi-year period of range
trading. (Last
update: 09 February 2009)
Gold commenced a
secular bull market relative to all fiat currencies, the CRB Index,
bonds and most stock market indices during 1999-2001. This secular trend will peak sometime between 2014 and 2020. (Last update: 22 October 2007)
Commodities,
as represented by the Continuous Commodity Index (CCI), commenced a
secular BULL market in 2001 in nominal dollar terms. The first major
upward leg in this bull market ended during the first half of 2008, but
a long-term peak won't occur until 2014-2020. In real (gold) terms,
commodities commenced a secular BEAR market in 2001 that will continue
until 2014-2020. (Last
update: 09 February 2009)
Copyright
Reminder
The commentaries that appear at TSI
may not be distributed, in full or in part, without our written permission.
In particular, please note that the posting of extracts from TSI commentaries
at other web sites or providing links to TSI commentaries at other web
sites (for example, at discussion boards) without our written permission
is prohibited.
We reserve the right to immediately
terminate the subscription of any TSI subscriber who distributes the TSI
commentaries without our written permission.
Outlook Summary
Market
|
Short-Term
(0-3 month)
|
Intermediate-Term
(3-12 month)
|
Long-Term
(1-5 Year)
|
Gold
|
Bullish
(21-Jun-10)
|
Bullish
(12-May-08)
|
Bullish
|
US$ (Dollar Index)
|
Neutral
(07-Jun-10)
| Bullish
(02-Nov-09)
|
Neutral
(19-Sep-07)
|
Bonds (US T-Bond)
|
Neutral
(17-May-10)
|
Bearish
(14-Dec-09)
|
Bearish
|
Stock Market (S&P500)
|
Bearish
(16-Jun-10)
|
Bearish
(11-May-09)
|
Bearish
|
Gold Stocks (HUI)
|
Neutral
(07-Jun-10)
|
Bullish
(23-Jun-10)
|
Bullish
|
| Oil | Neutral
(28-Oct-09)
| Bearish
(01-Mar-10)
| Bullish
|
Industrial Metals (GYX)
| Bearish
(21-Sep-09)
| Bearish
(25-May-09)
| Neutral
(11-Jan-10)
|
Notes:
1. In those cases where we have been able to identify the commentary in
which the most recent outlook change occurred we've put the date of the
commentary below the current outlook.
2. "Neutral", in the above table, means that we either don't have a
firm opinion or that we think risk and reward are roughly in balance with respect to the timeframe in question.
3. Long-term views are determined almost completely by fundamentals,
intermediate-term views by giving an approximately equal weighting to
fundamental and technical factors, and short-term views almost
completely by technicals.
The bad-policy spiral
According to a recent article by Ambrose Evans-Pritchard, "Federal
Reserve chairman Ben Bernanke is waging an epochal battle behind the
scenes for control of US monetary policy, struggling to overcome
resistance from regional Fed hawks for further possible stimulus to
prevent a deflationary spiral." The article goes on to explain
that with the economy rolling over the Fed should be prepared to
quickly inject a massive amount of new money, and that pig-headed
resistance to more monetary inflation by a few Fed governors poses a
serious threat. However, nowhere in the article is there a logical
explanation of how counterfeiting more money would benefit the economy.
This could be because such an explanation doesn't exist.
Despite being a well-respected commentator on economics and the
financial markets, Evans-Pritchard's understanding of economics leaves
a lot to be desired (to put it mildly). He perceives falling prices as
the major threat facing the US economy and is therefore an advocate of
doing whatever it takes to arrest widespread price declines, but fails
to realise that falling prices are just a symptom and that the
'solutions' recommended by him and his beloved Bernanke will increase
the severity of the disease.
If you increase the money supply by enough then you can surely get most
prices to rise, but only at the cost of general impoverishment. This is
because monetary inflation distorts the price signals upon which the
economy relies, thus leading to the wastage of resources and the
destruction of wealth.
When it comes to understanding the world of economics, one of the
problems is that the link between cause (the policy) and effect is
sometimes so long and indirect that it will only be evident to the
people who had a good understanding of economic theory to begin with.
This is certainly the case with monetary inflation, which sometimes
gives a short-term boost to markets and economies while it weakens the
economy's foundations. The difficulty of 'seeing' the link between
cause and effect is why so many people are able to claim, with straight
faces, that more monetary and/or fiscal stimulus is needed to address
an economic downturn that was caused by earlier rounds of monetary
and/or fiscal stimulus.
It can take years for the problems caused by monetary inflation to
ripple through the economy, but the adverse effects of some other
"stimulus" measures have shorter lead times. For example, when the
government directly pays people to buy things they otherwise wouldn't
have bought, there will tend to be a short-lived boost followed by a
plunge. Something along these lines has occurred in the US residential
property market over the past year. With house prices having been
propped up by government incentives and with considerable demand having
been sucked from the future, the US housing market is now in a weaker
position than it was 12 months ago. So, it must be time for more
stimulus, right?
It should always be kept in mind that "stimulus" of any kind is a
zero-sum game AT BEST. This is because the government doesn't generate
any wealth of its own; it just redistributes existing wealth. In
reality, "stimulus" is always a negative-sum game because the process
of redistribution always results in the less efficient use of resources.
In conclusion, the world of economic policy-making tends to operate as
follows: bad policies beget problems, which beget more bad policy
responses, which beget even bigger problems, and so on. The major
threat facing us is therefore not a deflationary spiral, as asserted by
Evans-Pritchard et al; it's a bad-policy spiral.
Interesting quote or fact of the week
In the following quote from Chapter 24 of "The Ethics of Liberty", Murray Rothbard argues that it is immoral to invest in government bonds.
"Many libertarians assert
that the government is morally bound to pay its debts, and that
therefore default or repudiation must be avoided. The problem here is
that these libertarians are analogizing from the perfectly proper
thesis that private persons or institutions should keep their contracts
and pay their debts. But government has no money of its own, and
payment of its debt means that the taxpayers are further coerced into
paying bondholders. Such coercion can never be licit from the
libertarian point of view. For not only does increased taxation mean
increased coercion and aggression against private property, but the
seemingly innocent bondholder appears in a very different light when we
consider that the purchase of a government bond is simply making an
investment in the future loot from the robbery of taxation. As an eager
investor in future robbery, then, the bondholder appears in a very
different moral light from what is usually assumed."
The Stock
Market
At this stage it looks like
last Monday's 'pop' in response to the largely irrelevant news about
more Yuan flexibility created the top for the stock market's
counter-trend rebound. However, there's a good chance that last week's
peak (1120s for the S&P500) will be tested before the next downward
leg begins in earnest.
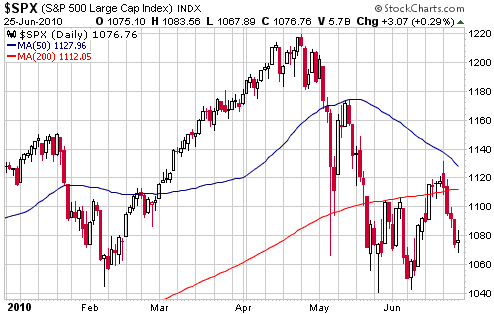
There are three
reasons to expect a return to the vicinity of last week's high, or at
least a significant 1-2 week recovery, prior to the start of a decline
to new lows for the year. They are:
1. Last week's sharp pullback in the US stock market was not confirmed
by the Hong Kong stock market, in that the Hang Seng Index experienced
only a minor consolidation.
2. Last week's sharp pullback in the US stock market was not confirmed
by the currency market, in that the Dollar Index still appears to be in
'correction mode' with more downside likely before it resumes its
intermediate-term bullish trend.
3. Last week's sharp pullback in the US stock market was not confirmed
by the commodity market. Of particular note, the gold/CRB ratio (see
chart below) continued to consolidate. It's likely that gold/CRB will
move to a new high at around the time that the stock market's next
downward leg commences.
This week's
important US economic events
| Date |
Description |
Monday Jun 28
| Personal Income and Spending
| Tuesday Jun 29
| Case-Shiller Home Price Index
Consumer Confidence
| | Wednesday Jun 30
| Chicago PMI
| | Thursday Jul 01
| ISM Manufacturing Index
Construction Spending
Pending Home Sales Index
| | Friday Jul 02
| Monthly Employment Report
Factory Orders
|
Gold and
the Dollar
Gold
August gold made a round trip from $1260 to $1230 last week. This
should be construed as bullish because support at $1220-$1230 survived
a test. As previously advised, a failure of gold's recent upside
breakout would be indicated by a daily close below $1220.
US$ gold has near-term upside potential to $1300-$1350.
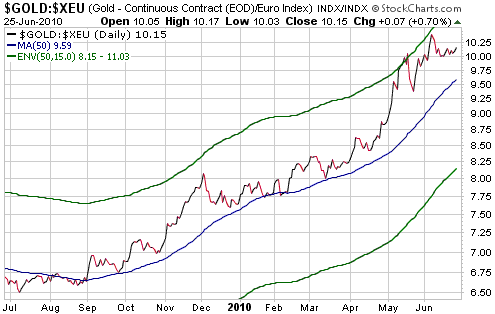
In euro terms, gold
has consolidated since reaching the top of its moving-average envelope
at the beginning of June (refer to the following chart for details).
The fact that it hasn't broken sharply lower means that although it
became sufficiently 'overbought' in early June to create an important
top, such a top has not yet been signaled.
Note that gold/euro's 50-day moving average is rising rapidly and will
soon be high enough to be used as a timely indicator of a trend
change.
Gold Stocks
Breakout now or later?
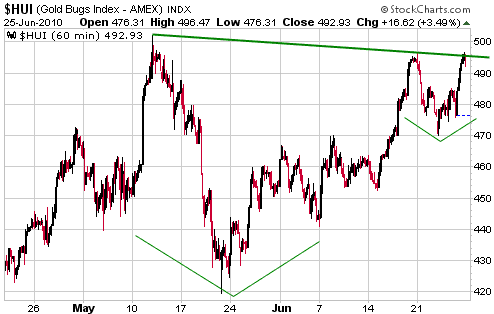
In last week's Interim Update we said that the HUI had traced out what
technical analysts often refer to as a "cup and handle" on both the
daily chart covering the past 9 months and the weekly chart covering
the past 3.5 years. We also said that if the HUI held above 460 during
the coming days and then rose to the 490s there would be a "cup and
handle" pattern evident on an hourly chart covering the past 2 months.
Due to Friday's rebound to the 490s, we now have a "cup and handle"
pattern on the hourly chart displayed below.
Under normal circumstances we wouldn't bother looking at an hourly chart of anything, but current circumstances aren't normal.
The HUI's 10-year
performance record suggests that there won't be a sustained move to a
new high for the year until at least September. Furthermore, a downward
trend to an October low continues to fit most neatly with our
longer-term outlook for the gold sector and our views on other markets.
However, the market doesn't always follow our script and the recent
price action suggests that there is a good chance of an upside breakout
in the near future.
As stated in the Interim Update, an upside breakout in the HUI would be
signaled by consecutive daily closes above 505. Going the other way, a
daily close below 470 would now be a clear sign that the trend had
reversed downward.
Gold Stock Value Comparison
Below are updated versions of the gold-stock value comparison tables
previously included in the 1st March 2010 Weekly Update. The tables
show the per-ounce values currently being assigned by the stock market
to the in-ground resources and production of the TSI gold/silver stock
selections and a few other gold/silver stocks (the stocks that are NOT
current members of the TSI List have asterisks next to their names).
The first table contains companies that are now in production or should
be in production within the next 12 months, while the second table
contains companies that are more than one year away from having any
production. Naturally, the companies in the second table do not have
per-ounce production values.
The "Recent Price" shown in the third column of each table is the closing price on Thursday 24th June 2010.
Producers and Soon-To-Be Producers
| Company
Name |
Symbol |
Recent
Price (local $) |
Ent. Value
(US$M) |
2010 Prod.
(Koz) |
Total
Resource (Moz) |
EV $ per oz
prod. |
EV $ per oz
res. |
| Catalpa Resource |
CAH.AX |
1.66 |
272 |
130 |
1.7 |
2094 |
160 |
| Crew Gold* |
CRU.TO |
0.25 |
579 |
220 |
4.9 |
2631 |
118 |
| Dominion Mining |
DOM.AX |
2.98 |
242 |
120 |
1.4 |
2016 |
173 |
| Etruscan Resources* |
EET.TO |
0.40 |
227 |
72 |
2.3 |
3153 |
99 |
| First Majestic Silver |
FR.TO |
4.26 |
405 |
100 |
3.6 |
4047 |
111 |
| Fortuna Silver |
FVI.TO |
2.09 |
162 |
28 |
1.1 |
5799 |
145 |
| Great Basin Gold |
GBG |
1.79 |
716 |
200 |
16.0 |
3580 |
45 |
| Gold-Ore Resources |
GOZ.TO |
0.52 |
40 |
40 |
1.0 |
999 |
42 |
| Gammon Gold* |
GRS |
5.62 |
687 |
220 |
5.3 |
3122 |
130 |
| Golden Star Resources* |
GSS |
4.41 |
1117 |
400 |
6.7 |
2792 |
167 |
| Minefinders Corp. |
MFN |
8.91 |
664 |
180 |
6.2 |
3687 |
108 |
| New Gold* |
NGD |
6.25 |
2500 |
350 |
16.9 |
7143 |
148 |
| Northgate Minerals |
NXG |
3.02 |
876 |
310 |
5.6 |
2825 |
158 |
| Orvana Minerals |
ORV.TO |
1.33 |
169 |
120 |
2.2 |
1409 |
79 |
| Resolute Mining |
RSG.AX |
1.10 |
676 |
400 |
8.8 |
1690 |
77 |
| Silver Standard* |
SSRI |
18.10 |
1331 |
100 |
57.9 |
13310 |
23 |
| US Silver* |
USA.V |
0.21 |
54 |
43 |
0.6 |
1253 |
98 |
Explorers and Developers (no near-term production)
| Company
Name |
Symbol |
Recent
Price (local $) |
Ent. Value
(US$M) |
2010 Prod.
(Koz) |
Total
Resource (Moz) |
EV $ per oz
prod. |
EV $ per oz
res. |
| Andina Minerals |
ADM.V |
1.17 |
80 |
0 |
7.2 |
|
11 |
| Clifton Star |
CFO.V |
4.06 |
202 |
0 |
1.0 |
|
202 |
| Chesapeake Gold |
CKG.V |
7.70 |
286 |
0 |
18.5 |
|
15 |
| Gryphon Gold |
GGN.TO |
0.14 |
12 |
0 |
1.0 |
|
12 |
| Golden Queen Mining |
GQM.TO |
1.47 |
130 |
0 |
2.8 |
|
46 |
| Keegan Resources |
KGN.TO |
5.64 |
199 |
0 |
2.8 |
|
73 |
| Rio Novo Gold* |
RN.TO |
1.35 |
80 |
0 |
0.8 |
|
102 |
| Orsu Metals* |
OSU.TO |
0.18 |
-1 |
0 |
1.9 |
|
0 |
| Pediment Gold |
PEZ.TO |
1.31 |
50 |
0 |
2.5 |
|
20 |
| Sabina Silver |
SBB.TO |
2.54 |
255 |
0 |
5.2 |
|
49 |
Table Notes:
1. Enterprise Value (EV) = market capitalisation plus total debt (including
hedge-related liabilities) minus cash
2. Silver production and resources have been converted to gold-equivalent values
at a ratio of 70:1
3. Total Resource = M&I Resource plus half of Inferred Resource
4. CAH figures assume full 100K prodn. from Edna May project
5. CKG figures assume that silver would be treated as a byproduct
6. CFO figures account for Osisko's 50% stake in the company's projects
7. GGN figures assume completion of the JV with Sage Gold, meaning that GGN
ends up with 50% of the Borealis project
8. GRS figures assume no production from El Cubo
9. NGD figures assume all cash used to finance New Afton mine
10. NXG figures assume all cash used to finance Y-D mine
11. ORV figures assume a) US$20M of debt needed to complete El Valle, and b) prod.
of 100K from El Valle and 20K from Bolivia
12. RSG figures include US$100M liability associated with hedge book
13. CRU and EET are included in the table because Endeavour Financial (EDV.TO),
a TSI stock, owns 43% of CRU and 55% of EET
When deciding which gold/silver stocks to buy, the information
tabulated above is just a starting point in that no gold stock should
ever be bought or sold simply because the value being assigned to its
ounces is relatively low or relatively high. This is because there are
always other important considerations, such as:
a) Growth potential
b) Production cost or expected production cost
c) Deposit size and expected mine life
d) Deposit location
e) For exploration-stage companies, the estimated cost of building a mine and the estimated time to get into production
f) Management
For example, CFO and KGN are relatively expensive based on their
current resources, but these companies have a lot of growth potential.
On the other hand, ADM and GGN look extremely cheap, but there are good
reasons for their current 'cheapness'.
Of the stocks that we follow, SBB has experienced the largest increase
in valuation over the past few months. However, in value terms it is
still one of the best opportunities we know of because the exceptional
drilling results recently achieved by the company are not yet reflected
in our per-ounce value calculations (and won't be reflected until an
updated resource estimate is done).
Our Australia-listed gold-stock selections (CAH, DOM and RSG) offer
very good value near their current prices, as does Orvana (TSX: ORV).
ORV will deserve to sell at a discount until its El Valle project
achieves commercial production (expected by year-end), but the current
price offers speculators the potential for a 100% gain within 12 months
assuming no change in the gold price.
Of the gold/silver producers that are presently not members of the TSI
List, GRS, GSS and SSRI offer reasonable value. GRS was close to being
fully priced a few months ago, but it has recently been hammered to a
52-week low in response to the closure of its El Cubo mine and is now
beginning to look interesting. SSRI looks very expensive based on its
current production level, but the relatively low per-ounce value being
assigned by the stock market to its massive in-ground resource makes it
attractive.
The two exploration-stage stocks in the above table that are not
presently members of the TSI List have some speculative merit near
their current prices. OSU is interesting because it is now selling at
cash value, meaning that the market is assigning no value to the
company's 1.9M-ounce gold resource. RN is discussed in the "Updates on
Stock Selections" section of today's report.
Currency Market Update
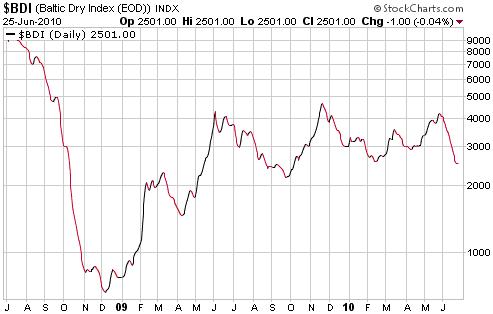
In the 31st May Weekly Update we wrote:
"Intermediate-term
turning points in the Baltic Dry Index (BDI), an index of international
shipping rates, often roughly coincide with intermediate-term turning
points in the Dollar Index, with BDI highs coinciding with US$ lows and
BDI lows coinciding with US$ highs. The BDI's most recent high of
significance was in Q4-2009, which makes sense because the Dollar Index
was bottoming at that time. However, the BDI is yet to really confirm
the currency market's trend change because it has just moved back to
near last year's peak.
It's a good bet that the
BDI will move a lot lower over the next 6 months and thus bring itself
into line with the currency market."
The BDI has since plunged from 4100 to 2500 and is therefore now more
in line with the currency market, although if our intermediate-term
currency market outlook is close to the mark then the BDI will probably
move much lower before this year is out.
By the way, it makes
no sense to use any form of "technical analysis" with quantities such
as the BDI that are not directly traded in the financial markets. This
is because to the limited extent that technical analysis works at all
it does so due to the psychology of market participants; in particular,
due to the ways that market participants react to price changes and the
attainment of certain price levels.
Below is an updated version of a chart we've shown in the past. The
chart's message is simply that being 'long' the Canadian Dollar is
effectively the same as being 'long' the US stock market.
We've thought that
the 50-day moving average was a likely target for the euro's rebound.
It's a falling target, and over the past 4 weeks has fallen from just
above 1.30 to just below 1.26 (basis the September futures contract).
As illustrated on the following daily chart, the euro's 50-day moving
average now roughly coincides with lateral resistance at 1.26.
In our opinion, the
euro has probable upside to 1.26 and possible upside to 1.30 over the
next few weeks. Beyond the next few weeks, our outlook for the euro
remains bearish. The catalyst for the next substantial euro decline
will probably be the resumption of the euro-zone's government debt
crisis or breaks to new lows for the year by the world's major stock
markets.
Update
on Stock Selections
(Notes: 1) To review the complete list of current TSI stock selections, logon at http://www.speculative-investor.com/new/market_logon.asp
and then click on "Stock Selections" in the menu. When at the Stock
Selections page, click on a stock's symbol to bring-up an archive of
our comments on the stock in question. 2) The Small Stock Watch List is
located at http://www.speculative-investor.com/new/smallstockwatch.html)
 Rio Novo Gold (TSX: RN). Shares: 91M issued, 113M fully diluted. Recent price: C$1.47 Rio Novo Gold (TSX: RN). Shares: 91M issued, 113M fully diluted. Recent price: C$1.47
RN is a new entry into the world of junior gold stocks, having listed
on the TSX less than four months ago. It is not a current member of the
TSI Stocks List and we aren't going to add it at this time, but it is
worth keeping an eye on for the reasons outlined below. Also, we think
the RN warrants (TSX: RN.WT) are interesting speculations with high
risk and high potential reward, but they are very illiquid and
therefore difficult to trade in size. The warrants have an exercise
price of C$2.25 and an expiry date of March-2015.
Here is a summary of the RN story:
1. IPO'd in March-2010 at C$1.60/share, raising more than US$40M in the
process. Current cash and working capital are $39M and $37M, resp.
2. Two projects in Brazil (Almas and Guaranta) with NI-43-101 gold
resources, one of which (Almas) was formerly in production and could
potentially be put back into production inside two years.
3. RN's chairman is Sean Roosen, the CEO of Osisko. The CEO (David
Beatty) and the president (Julio Carvalho) of RN are very experienced
and highly regarded.
4. RN's majority shareholder is billionaire Brazilian businessman Paulo de Brito (de Brito controls 57% of the shares).
5. The company plans to drill 40,000m in 2010 across its two projects,
paving the way for increased resource estimates late this year or early
next year. The drilling program should generate good news flow over the
coming months.
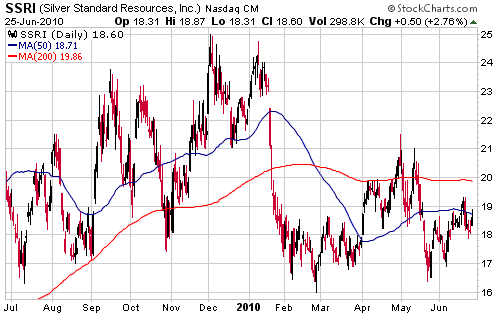
 New TSI stock selection: Silver Standard Resources (NASDAQ: SSRI). Shares: 79M issued, 84M fully diluted. Recent price: US$18.60 New TSI stock selection: Silver Standard Resources (NASDAQ: SSRI). Shares: 79M issued, 84M fully diluted. Recent price: US$18.60
SSRI is a liquid stock that offers considerable leverage to both gold
and silver. We are going to add it to the TSI Stocks List as a trading
position, with the initial stop being a daily close below US$17.50.
At only 5.9% below Friday's closing price, our selected stop is
'tight'. We have opted for such a tight initial stop because the gold
sector is either close to a short-term peak, in which case we will want
to be out of this trading position following the first sign of
weakness, or about to make a big move upward, in which case the
gold-stock indices and SSRI should hold above last week's intra-day
lows.
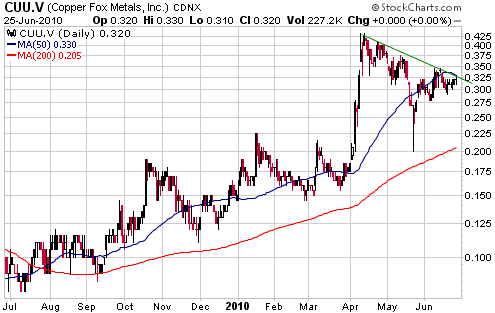
 Copper Fox (TSXV: CUU). Shares: 285M issued, 373M fully diluted. Recent price: C$0.32 Copper Fox (TSXV: CUU). Shares: 285M issued, 373M fully diluted. Recent price: C$0.32
Exploration-stage copper miner CUU peaked during the first half of
April and has since been consolidating. It ended last week in an
interesting position, in that any additional strength from here would
constitute a breakout on the chart (see below) and project a rise to a
new high for the year.
The Feasibility Study
(FS) for CUU's Schaft Creek copper/gold project is due to be complete
by year-end, and a positive result could propel CUU to C$1.00 in early
2011. This is our assessment of the intermediate-term upside potential.
However, there probably won't be much in the way of company-specific
news over the next few months and there is a lot of remaining downside
risk in the copper price.
In our opinion, CUU would be a good candidate for new buying at C$0.22
or lower. For those with substantial exposure to the stock it would
make sense to scale back to a comfortable 'core' position within the
C$0.35-C$0.50 range.
 Crowflight Minerals (TSX: CML). Shares: 583M issued, 717M fully diluted. Recent price: C$0.14 Crowflight Minerals (TSX: CML). Shares: 583M issued, 717M fully diluted. Recent price: C$0.14
CML continues to have difficulty ramping its Bucko nickel mine up to
the targeted production rate. In May it produced 372K pounds of nickel,
which is less than half of what it should be producing.
On the corporate front the CML story is both interesting and confusing.
Pala Investments had at one time expressed interest in buying the Bucko
mine, but Pala recently sold its CML stake to a Chinese company called
King Place Enterprises. King Place was already a large investor in CML,
and with the Pala stake now owns about 42% of the company. Also, there
is still a C$0.22/share takeover bid for CML on the table from
Jinchuan, another Chinese company. This takeover bid, however, is
subject to the strange condition that Jinchuan obtain 100 per cent of
the off-take from the Bucko Lake mine. It's a strange condition because
CML has a contract to provide its off-take to Xstrata.
At this stage, CML is a pure speculation on either a much higher nickel
price or a reasonable takeover bid from Jinchuan or King Place. The
former is unlikely this year, but the latter has a decent chance of
happening.
Chart Sources
Charts appearing in today's commentary
are courtesy of:
http://stockcharts.com/index.html
http://www.futuresource.com/

|

