|
-- Weekly Market Update for the Week Commencing 29th January 2007
Big Picture
View
Here is a summary of our big picture
view of the markets. Note that our short-term views may differ from our
big picture view.
Bonds commenced a secular BEAR market in
June of 2003. (Last
update: 22 August 2005)
The stock market, as represented by the S&P500 Index, commenced a secular BEAR market during the first quarter of 2000. The rally
that
began in October of 2002 will end during the first half of 2007. The ultimate bottom of
the secular bear market won't occur until the next decade. (Last update: 02 October 2006)
The Dollar commenced a secular BEAR market during the final quarter of 2000. The
first major downward leg in this bear market ended during the first
quarter of 2005, but a long-term bottom won't occur until 2008-2010. (Last update: 28 March 2005)
Gold commenced a
secular bull market relative to all fiat currencies, the CRB Index,
bonds and most stock market indices during 1999-2001. The first major
upward leg in this secular bull market ended in December of 2003, but a
long-term peak won't occur until at least 2008-2010. (Last update: 13
February 2006)
Commodities, as
represented
by the CRB Index, commenced a secular BULL market in 2001. The first
major upward leg in this bull market ended during the second quarter of
2006, but a long-term
peak won't occur until at least 2008-2010. (Last update: 08 January 2007)
Copyright
Reminder
The commentaries that appear at TSI
may not be distributed, in full or in part, without our written permission.
In particular, please note that the posting of extracts from TSI commentaries
at other web sites or providing links to TSI commentaries at other web
sites (for example, at discussion boards) without our written permission
is prohibited.
We reserve the right to immediately
terminate the subscription of any TSI subscriber who distributes the TSI
commentaries without our written permission.
Outlook Summary
Market
|
Short-Term
(0-3 month)
|
Intermediate-Term
(3-12 month)
|
Long-Term
(1-5 Year)
|
Gold
|
Bullish
(04-Oct-06)
|
Bullish
(29-Jan-07)
|
Bullish
|
US$ (Dollar Index)
|
Neutral
(08-Jan-07)
| Bullish
(31-May-04)
|
Bearish
|
Bonds (US T-Bond)
|
Neutral
(29-Jan-07)
|
Neutral
(23-Aug-06)
|
Bearish
|
Stock Market (S&P500)
|
Neutral
(13-Dec-06)
|
Bearish
(02-Jan-07)
|
Bearish
|
Gold Stocks (HUI)
|
Bullish
(04-Oct-06)
|
Bullish
(29-Jan-07)
|
Bullish
|
| Oil | Bullish
(04-Oct-06)
| Neutral
(25-Sep-06)
| Bullish
|
Industrial Metals (GYX)
| Neutral
(15-Jan-07)
| Bearish
(25-Sep-06)
| Bullish
|
Notes:
1. In those cases where we have been able to identify the commentary in
which the most recent outlook change occurred we've put the date of the
commentary below the current outlook.
2. "Neutral", in the above table, means that we either don't have a
firm opinion on which way the market will move or that we expect the
market to be trendless during the timeframe in question.
3. Long-term views are determined almost completely by fundamentals,
intermediate-term views by giving an approximately equal weighting to
fundmental and technical factors, and short-term views almost
completely by technicals.
2007 Forecast (cont'd)
In last week's Interim Update
we provided our 12-month forecasts for the US dollar, bonds and
commodities. In today's report we will do the same for gold and the US
stock market.
Gold
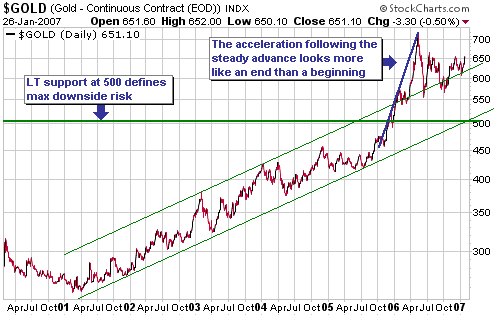
The chart of the US$ gold price included below shows that gold trended
higher at a steady pace from the first quarter of 2001 through to the
third quarter of 2005, and then accelerated upward to a peak in May of
2006. Upward acceleration of this nature is something that usually only
happens during the final phase of a multi-year rally and in this case
it might have ushered-in a correction that will last 1-2 years. The
first of our two most probable scenarios, therefore, is that the
correction that began in May of 2006 will continue until at least the
final quarter of this year. The next multi-year advance in the gold
price would then get underway.
Given that the short-term (1-3 month) outlook for gold is bullish, this
first scenario would likely involve a test of the May-2006 peak at some
point during the first few months of the year followed by a drop to
re-test the June-2006 bottom (around $550) during the second half of
the year. A breach of the June-2006 low would pave the way for a test
of long-term support in the low-$500s, a support area we wouldn't
expect to see violated under this or any other realistic scenario.
The second scenario
worthy of consideration is that the post-May-2006 correction ended in
October and the next multi-year advance is already underway. In this
case we'd expect a test of the May-2006 peak within the next few
months; followed by a pullback to around the current level (630-650);
followed by a rally that ultimately takes the gold price well beyond
its May-2006 peak.
The second scenario has the advantage of being consistent with
long-term charts of the gold stock indices. Unlike the US$ gold price,
which is yet to experience its first major correction, the gold stock
indices consolidated for about 20 months beginning in December of 2003.
This consolidation contained two peak-to-trough declines of around 40%
and can reasonably be given the "cyclical bear market" label (in this
case the term "cyclical bear market" means a 1-2 year bearish trend
within a secular bullish trend). It would be unusual for a new cyclical
bear market to begin less than a year after the previous one ended,
meaning that the post-May-2006 downturn in the gold sector is more
likely to be a correction within an on-going cyclical bull market than
the start of a new cyclical bear market; and if this is the right
interpretation then it is not reasonable to expect gold bullion to
trade anywhere near its June-2006 low over the coming 12 months.
The key, we think, is what happens to yield and credit spreads. If
yield and credit spreads become significantly wider during the first
half of the year -- something that probably won't happen unless there's
a large enough decline in confidence to prompt a substantial (10-20%)
downturn in global stock markets -- it will mean that the
financial/economic backdrop is becoming more conducive to a major
advance in the gold price (our second scenario). On the other hand, if
yield and credit spreads remain near their current low levels over the
coming 6 months then any up-move in gold will probably be capped at the
May-2006 peak and there will be a significant risk of a break below the
June-2006 bottom during the second half of this year (our first
scenario).
Just to be clear, we think the more bullish (for gold) intermediate-term scenario would go something like this:
1) Stock markets begin to weaken and interest rate spreads (the
differences between long-term and short-term interest rates and the
differences between the yields on low and high quality debt securities)
begin to widen.
2) The gold price initially declines along with the prices of cyclical
assets such as stock markets and industrial commodities, but holds up
better than these other assets.
3) The markets begin to anticipate the traditional central bank
response to declines in cyclical asset prices and evidence of slowing
growth: looser monetary policy. This results in greater investment
demand for gold and a rise in the gold price in terms of almost
everything.
At this stage we favour the second (more bullish) scenario because it
is consistent with our stock market and economic outlooks. We've
therefore upgraded our intermediate-term outlooks for gold and gold
stocks to "bullish", thus putting ourselves in the uncomfortable
position of being intermediate-term bullish on gold and the US$ at the
same time. The position is uncomfortable from an inter-market
relationship perspective because gold and the Dollar Index usually
trend in opposite directions and the inverse correlation has been
particularly strong over the past 12 months. Note, though, that it's
not an uncomfortable position from a fundamental perspective because
gold's fundamentals are clearly superior to those of the dollar whereas
the dollar's fundamentals are arguably superior to those of the euro.
The decision to upgrade our intermediate-term view on the US$ gold
price was also influenced by gold's recent price action in terms of
currencies other than the US$. Specifically, the long-term charts
included below of gold in A$ terms, gold in terms of the British Pound
and gold in terms of the South African Rand reveal a pattern that can
be described as: a multi-year consolidation ending in 2005; followed by
an almost straight-up surge culminating around the middle of last year;
followed by what currently appears to be a smaller-degree
consolidation. Charts of gold in euro, Yen and Swiss Franc terms have a
similar look and in every case the consolidation that began in mid-2006
appears to be either breaking-out to the upside or about to breakout to
the upside.
As with the gold stock indices, in non-US$ terms gold completed a
lengthy mid-cycle correction within the past 18 months and is therefore
unlikely to embark on another correction of this magnitude in the near
future.
The last thing we'll
mention before leaving our 2007 gold forecast is the potential for the
IMF to adopt an accounting change that requires central banks to
exclude, when reporting their gold reserves, the gold that has been
swapped or loaned out. If implemented this accounting change will
reveal the quantity of the metal that has been swapped/loaned into the
market by the central banking community. Refer to http://www.resourceinvestor.com/pebble.asp?relid=28416 for additional info.
The aforementioned accounting change is a wildcard in that: a) only
senior central-bank insiders currently know the real numbers with
regard to gold loans/swaps, b) it is not certain that the change will
ever actually be implemented, and c) if the change is made official
there's no telling when it will come into effect.
With so many unknowns surrounding this issue it should not form the
basis of any forecast or investment decision. Our guess, though, is
that it won't prove to be a major event in the gold market because it
will only get implemented if the amount of gold involved is either
lower than or roughly in line with mainstream views (no more than a few
thousand tonnes). Putting it another way, it's very unlikely that the
IMF will require central banks to implement an accounting change that
causes great embarrassment to the central banking community. In any
case, even if this mooted accounting change is destined to eventually
become important it won't become important this year because such
things generally get implemented with glacier-like speed.
The US Stock Market
As far as the US stock market and most other stock markets are
concerned, the current monetary situation is probably close to being as
good as it gets. To be specific: credit spreads are near all-time lows,
indicating that even poor-quality borrowers can obtain credit at low
rates of interest; yield curves are flat or inverted, which is
indicative of a strong desire to borrow short-term in order to
speculate in longer-term assets/debt; the global supply of currency is
expanding at a rapid rate; and bond yields remain near 20-year lows
despite the obvious evidence of inflation. It's impossible to predict
exactly when this utopian situation will end, but in our opinion
there's little chance of it persisting throughout 2007.
We expect to see a reversal in the liquidity trend -- from expanding to
contracting -- during the first half of 2007; a reversal signaled,
first and foremost, by the widening of credit and yield spreads.
In addition to a very supportive monetary backdrop, the US stock market
has received great assistance over the past few years from rising
profit margins. As discussed by John Hussman in his 22nd January
and earlier commentaries, the primary driver of the rise in US
corporate profit margins to extreme highs has been stagnating labour
costs. Profit margins are mean reverting, however, and the way they
will most likely revert to the mean is via labour taking a larger slice
of the pie.
There's no guarantee that the mean reversion of profit margins will
occur during 2007, but it represents a substantial risk given that a)
the rate of increase in labour costs has already begun to accelerate,
and b) house price gains aren't likely to provide as much of a
psychological offset this year as they have in years gone by to the
absence of real gains on the wage front.
Further to the above, we expect that contracting liquidity and falling
profit margins will weigh the US stock market down over the coming 12
months.
But what about the potential for Fed-sponsored inflation (money-supply
growth) to keep the liquidity expansion going and propel the stock
market upward in the face of deteriorating fundamentals?
We don't think this as a major threat to our overall outlook for 2007,
but before we explain why it's worth quickly reviewing the way
money-supply growth operates.
Incredibly, some people
believe that the central bank can create prosperity by simply expanding
the supply of money. This is despite the US stock market's worst
performance over the past 5 decades having occurred during the decade
with the highest money-supply growth (the 1970s); and despite the
highest rate of year-over-year money-supply growth of the past 20 years
(December-2001) being followed by a 12-month period during which the US
economy was in recession* and the S&P500 Index fell by more than
20%.
If a central bank could create prosperity by expanding the money supply
then no country would ever be poor and Zimbabwe would have the world's
strongest economy, but the reality is that money-supply growth can only
have the effect of reducing the purchasing power of the money. The main
issue from a longer-term perspective, though, stems from the fact that
this loss of purchasing power occurs in a non-uniform -- and often
deceptive -- way. As a result: price signals become inaccurate;
investment is misdirected; productivity growth slows; there is an
eventual net reduction in real wealth; and the asset rich benefit at
the expense of savers, salaried workers, anyone on a fixed income, and
the asset poor. Needless to say (but we'll say it anyway because it's
such a widely misunderstood concept), the capital gains that stem from
inflation have absolutely nothing to do with capitalism.
It is certainly possible for rapid expansion of the money supply to
lead to gains in the stock market because company shares usually
represent claims on real assets and because profits will tend to be
boosted until the point is reached where the effects of inflation have
rippled through the economy (that is, until the point is reached where
labour is grabbing an ever-increasing slice of the pie and the debt
markets are factoring-in rapid future currency depreciation). This
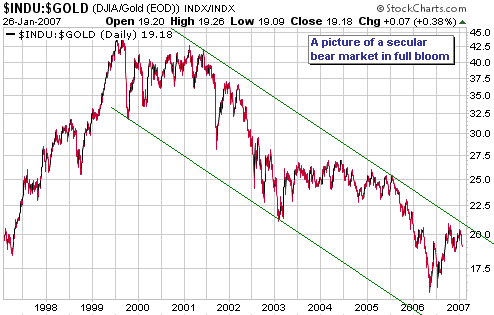
describes what happened over the past 6 years in that over this period
there was sufficient inflation to push the Dow Industrials Index to new
all-time highs in terms of greatly depreciated dollars. In real terms,
however, the Dow's performance was poor. This real performance is
reflected in the following chart of the Dow/gold ratio.
If the total supply
of US dollars grows at a quick pace during 2007 then the US stock
market will probably have an 'up' year in nominal dollar terms IF
there's only a modest increase in labour compensation and IF the bond
market fails to react in a meaningful way to the on-going currency
depreciation. These are, however, big 'ifs' because with bond yields so
low the bond market is acutely vulnerable to a significant rise in
inflation expectations and, as mentioned above, it looks like labour
compensation is about to begin increasing at a faster rate.
In any case, if inflation (money supply growth) proves to be the main
driver of stock market gains during 2007 then our gold stocks should
still do OK and the best-performing sector -- one in which we also have
significant exposure -- would probably be base metals. Therefore,
although it would make our intermediate-term stock market outlook wrong
we don't view the possibility of inflation-related stock market gains
as a risk to our overall position.
In conclusion, then, we are expecting 2007 to be a 'down year' for the
US stock market due to a combination of contracting liquidity and
falling profit margins, but are effectively hedged against the
possibility of liquidity remaining abundant by virtue of our core
long-term position in the industrial metals sector.
*According to the
NBER (the institution that determines the official start and end dates
for US recessions), the recession ended in November of 2001. However,
it didn't actually end until at least the middle of 2003. Discrepancies
between official and actual often occur due to the gross misreporting
of the effects of inflation.
Bonds
We
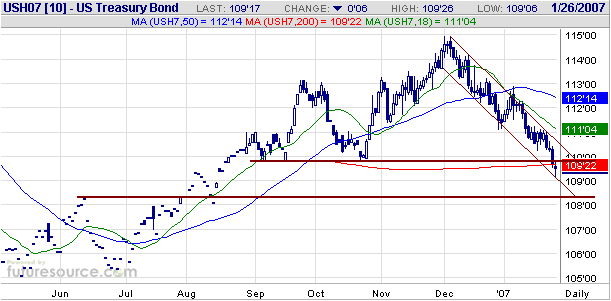
have upgraded our short-term bond market outlook from "bearish" to
"neutral" to reflect our opinion that, as far as the next 1-3 months
are concerned, the downside risk is no longer greater than the upside
risk. Our reasoning is two-fold: First, T-Bond futures have fallen in
almost a straight line over the past two months and although they have
just breached important support at 110 (see chart below) they have
additional support not far below the current level. Second, market
sentiment towards bonds has gone from being over-the-moon bullish
during October-November of last year to being evenly balanced at this
time.
Expanding on this second reason, the total speculative net-long
position across T-Bond and T-Note futures was greater than 400,000
contracts at one point last October, meaning that speculators, as a
group, were very bullish on long-dated treasuries at that time and were
betting accordingly. However, speculators are now approximately 'flat'
(the current speculative net-long position in 10-year T-Note futures is
largely offset by the speculative net-short position in 30-year T-Bond
futures). Also, just two months ago the markets were certain that there
would be at least one official rate cut during the first half of 2007
and at least two more rate cuts during the second half, but there is no
longer any expectation of a rate cut during the first half and an
expectation of just one rate cut during the second half.
Due to the dramatic change in sentiment that has occurred over the past
two months the bond market is now much less vulnerable to a downside
surprise and far more susceptible to an upside surprise.
The Stock
Market
Current Market Situation
The market action over the next three days will be interesting because
the senior stock indices made new multi-year highs earlier this month
but are currently not far above their December closing levels, meaning
that it won't take much weakness from here to create key monthly
reversals to the downside. Specifically, to create key downside
reversals the stock indices will need to close below the following
levels on Wednesday 31st January: 2415 for the NASDAQ Composite, 1756
for the NASDAQ100, 1418 for the S&P500 and 12463 for the Dow
Industrials.
What makes things even more interesting is that 31st January is also
the date on which the Fed is scheduled to issue its next monetary
policy statement.
This week's
important US economic events
| Date |
Description |
Monday Jan 29
| No significant events scheduled
|
| Tuesday Jan 30 | Consumer Confidence
| | Wednesday Jan 31
| FOMC Policy Statement
Employment Cost Index
Q4 GDP (prelim)
Construction Spending
Chicago PMI
| | Thursday Feb 01
| ISM Index
Personal Income and Spending
| | Friday Feb 02
| Monthly Employment Report
Factory Orders
|
Gold and
the Dollar
Currency Market Update
The following chart shows that the March Swiss Franc futures contract
has just dropped to new lows for the year. The euro hasn't yet dropped
below its mid-January low, but it will probably soon do so.
The Swiss Franc chart also shows that this currency is very oversold
and just a short distance from intermediate-term support at 0.795. We
expect that this support will eventually be breached and that the SF
will trade at significantly lower levels prior to year-end, but the
stage appears to be set for some counter-trend moves in the currency
market (down in the US$, up in the others). We expect that these
counter-trend moves will begin from near current levels within the next
2 weeks.

Gold
Below is a daily chart of February gold futures.
Gold reversed lower on Thursday after testing resistance defined by its
early-December peak. This sets the scene for some consolidation (the
proverbial pause that refreshes).
This consolidation could take February gold all the way back to support
at $620. However, we'll be surprised if it drops below the 630s before
a rally to new multi-month highs gets underway.
Gold Stocks
When gold reversed lower on Thursday the gold stock indices naturally
followed. Again, though, this is probably a routine consolidation prior
to further gains.
Our best guess is that the XAU (see chart below) will hold in the
mid-130s and then move up to test intermediate-term resistance at 150.
Update
on Stock Selections
(Note: To review the complete list of current TSI stock selections, logon at http://www.speculative-investor.com/new/market_logon.asp
and then click on "Stock Selections" in the menu. When at the Stock
Selections page, click on a stock's symbol to bring-up an archive of our comments on the stock in question)
 Gold
Fields Ltd (NYSE: GFI). Shares: 629M (incl. recent issues for South
Deep purchase and debt repayment). Recent price: US$16.77 Gold
Fields Ltd (NYSE: GFI). Shares: 629M (incl. recent issues for South
Deep purchase and debt repayment). Recent price: US$16.77
GFI continues to be weighed down by the large volume of new shares
issued by the company as a result of its purchase of the South Deep
mine in South Africa. About US$2B of new shares have been, or are going
to be, issued to fund the purchase of Barrick Gold's 50% stake in South
Deep, the purchase of Western Areas (the owner of the remaining 50%),
and the payment of US$528M to eliminate the toxic hedge book inherited
from Western Areas. By the way, we were pleased to see that GFI's
management acted quickly to close-out the Western Areas hedge book
because it makes no sense for any gold mining company to be in a
position where it can be hurt by a rise in the gold price.
Although it has put significant short-term downward pressure on the
stock price, the South Deep purchase should end up adding considerable
value to GFI; particularly if the Rand-denominated gold price continues
to trend higher as we currently expect.
The $2B of new shares might continue to suppress the stock price for a
while, although it will only take a small increase in institutional
investment demand to quickly absorb this additional supply. In the
context of the amount of money that is currently sloshing around the
globe, US$2B of new stock in one of the world's largest gold mining
companies really is a trivial amount. There are, in fact, only 5 gold
mining companies in the world that could reasonably be classed as "blue
chip", these being Barrick Gold, Newmont Mining, Anglogold, Gold Fields
and Goldcorp. And in our opinion, GFI clearly offers the best value
within this bunch and should begin to attract a lot of favourable
attention once the investment crowd again turns toward gold.
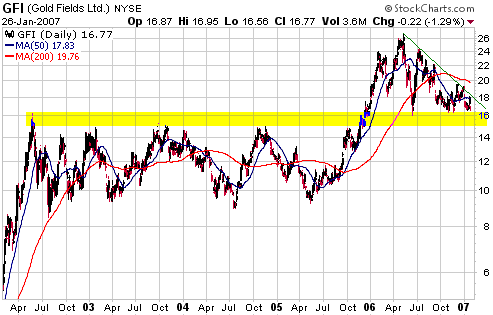
From a technical perspective (see chart below) the stock is near a
range of long-term support. This support range extends down to US$15,
but we suspect that it will bottom in the 16s (near the current level,
that is).
 Resolute Mining (ASX: RSG). Shares: 232M issued. Recent price: A$1.66 Resolute Mining (ASX: RSG). Shares: 232M issued. Recent price: A$1.66
Despite being listed in Australia, most of RSG's projects are located
in Africa. It has similar current production and a similar growth
profile to Golden Star Resources (AMEX: GSS), but has a much lower
valuation.
RSG's current production of 250K ounces/year comes from its Golden
Pride mine in Tanzania and its Ravenswood mine in Queensland, but a lot
of the company's upside potential is associated with the 6.4M-ounce
(4.3M measured-and-indicated + 2.1M inferred) Syama gold project in
Mali. Syama is in the process of being developed into a mine that will
add around 250K ounces to RSG's annual production.
The revised cost estimate for the Syama development is due to be
released in March. It will no doubt show a sizeable increase over the
previous estimate of US$82M, but RSG has US$120M of cash so financing
shouldn't be an issue.
RSG also has interests in several early-stage projects in Africa and
regularly achieves the sort of drilling results that would generate a
lot of excitement if they were reported by an exploration-stage gold
miner.
One of the risks/problems with RSG has always been its gold hedge book.
The company has, however, reduced the size of its hedge commitments
from 650K ounces to 550K ounces over the past 9 months, so this risk is
gradually being eliminated.
We think RSG is a buy at its current level and would be an especially
strong buy if it dropped to support at A$1.50. The stock currently
sells at only $1200/ounce of current production, compared to an
industry-wide average of around $3000/ounce. The real kicker, though,
is that the development of Syama could potentially double RSG's
production without adding significantly to its share count.
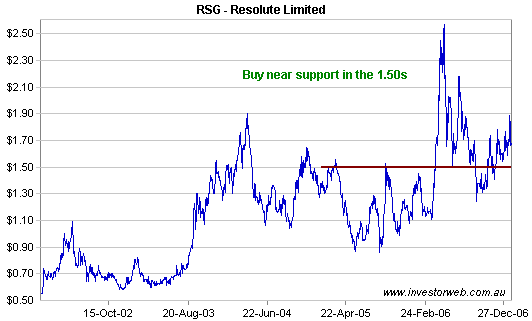
Chart Sources
Charts appearing in today's commentary
are courtesy of:
http://stockcharts.com/index.html
http://www.futuresource.com/

|

