![]()
![]()
![]()
![]()
-- Weekly Market Update for the Week Commencing 29th January 2018
Big Picture
View
Here is a summary of our big picture
view of the markets. Note that our short-term views may differ from our
big picture view.
The BULL market in US Treasury Bonds that began in the early 1980s ended in mid-2016, but there will be many years of topping action in bond prices and bottoming action in bond yields before major new trends get underway. A major decline in government bond prices will unfold during the 2020s. (Last update: 11 September 2017)
The stock market, as represented by the S&P500 Index, commenced a secular BEAR market during the first quarter of 2000, where "secular bear market" is defined as a long-term downward trend in valuations (P/E ratios, etc.), gold-denominated prices and inflation-adjusted prices. This secular trend will bottom in 2020 or later. (Last update: 11 September 2017)
A cyclical BEAR market in the US Dollar began in 2016-2017. (Last update: 11 September 2017)
Gold commenced a secular bull market relative to all fiat currencies, the CRB Index, bonds and most stock market indices during 1999-2001. This secular trend will peak in 2020 or later. (Last update: 11 September 2017)
Commodities,
as represented by the CRB Index, commenced a
secular BULL market in 2001 in nominal dollar terms. The first major
upward leg in this bull market ended during the first half of 2008, but
a long-term peak won't occur until 2020 or later.
(Last
update: 11 September 2017)
Copyright
Reminder
The commentaries that appear at TSI
may not be distributed, in full or in part, without our written permission.
In particular, please note that the posting of extracts from TSI commentaries
at other web sites or providing links to TSI commentaries at other web
sites (for example, at discussion boards) without our written permission
is prohibited.
We reserve the right to immediately
terminate the subscription of any TSI subscriber who distributes the TSI
commentaries without our written permission.
True
Fundamentals Summary
[Notes:
1) The date shown next to the current True Fundamentals Model (TFM) signal is
when the most recent change occurred. 2) Charts of the Gold and Equity
TFMs are included in the "Charts and Indicators" section of the TSI web
site]
| Market | True Fundamentals Model (TFM) |
| Gold (US$ Price) | Bearish (12 Jan 2018) |
| US Equity (SPX) | Neutral (12 Jan 2018) |
| Currency (Dollar Index) | Bullish (15 Dec 2017) |
| Commodities (GNX) | Bullish (29 Dec 2017) |
Last week's posts at the TSI Blog
Apple Confusion
Summary of current
thinking/positioning
1) Expecting that gold will soon
make a short-term price top but will go on to make new highs for the year
during the second quarter.
2) On the lookout for signs of trouble
in a very 'overbought' and over-valued US stock market, but at this time
not seeing any reason to expect something more bearish than a normal
short-term correction.
3) Thinking that industrial commodities such
as oil and copper will make short-term price highs during the first two
months of 2018.
4) Expecting the Dollar Index (DX) to commence a
counter-trend rebound within the next two weeks.
5) Thinking that
the T-Bond has almost completed an intermediate-term topping pattern
within the context of a long-term topping pattern.
6) Holding a
cash reserve of about 25% and looking for opportunities to boost this
reserve to 30%-35%.
No Interim Update
this week
Please note that we are taking a
short break and as a result there will be no Interim Update this week.
Therefore, the next TSI commentary will be the Weekly Update on Sunday 4th
February.
It seems that the
fundamentals don't matter anymore
Over the past few weeks it has
seemed as if the most important fundamental drivers of the financial
markets were irrelevant, in that strong short-term price trends in some
markets were at odds with the true fundamentals. Here are the three most
noteworthy examples:
1) There was a plunge in the Dollar Index,
even though interest-rate differentials and relative equity-market
strength, the two most important drivers of the US dollar's value against
the euro, did not support such an outcome.
2) The US stock market's
short-term trend accelerated upward despite the fundamental backdrop
becoming less friendly due to rising interest rates and tightening US
monetary conditions.
3) The US$ gold price quickly rose to
intermediate-term resistance defined by its highs of the past two years
($1360-$1377) even though the fundamental influences represented by our
GTFM were oscillating around neutral. This contrasts with the fast-paced
gold rallies of Q2-Q3 2016 and Q3 2017, both of which took the price into
the $1360-$1377 range (like the recent rally) and both of which were
supported by bullish fundamentals (unlike the recent rally).
Contrary to the assumption in some quarters that gold's fundamentals are
always bullish and therefore that significant declines in the gold price
can only be explained by manipulation, the vast majority of significant
advances and declines in the gold price are in synch with the true
fundamentals. Consequently, the recent gold rally was unusual, although
certainly not unpredictable given the sentiment backdrop.
In the
currency and equity markets, however, it is not unusual for short-term
price trends to be counter to the fundamentals. Strangely, considering
that it is the most liquid of all the major financial markets, this is
especially so in the currency market.
The currency market spends a
lot of time being essentially trendless, but once a trend gets underway it
tends to become relentless. In particular, if a breakout in the currency
market is not quickly reversed then there typically will be substantial
follow-through in the direction of the breakout as wave upon wave of
speculative buying or selling reinforces the trend. It works this way
almost regardless of what's happening on the fundamental front.
Of
course, there will always be plausible-sounding 'fundamental' stories to
support whatever the relentless price trend happens to be. For example,
when the US$ is in a strong upward trend the "massive global US$ short
position" story is invariably trotted out to explain the trend. The line
of thinking here is that the non-US borrowers of trillions of dollars are
scrambling to get hold of dollars to make their debt repayments, thus
propelling the US currency skyward on the FX market. However, this massive
debt (short position) exists during US$ bull markets and US$ bear markets.
It therefore can never be the primary cause of a US$ upward trend.
For another example, when the US$ is in a strong downward trend one the
most popular explanations invariably has something to do with countries
deciding to trade oil in a currency other than the US$. The line of
thinking here is that the demand for the US$ will take a hit if a
significant portion of global oil trading starts happening in a currency
other than the US$, but this is nonsense because the trading of oil
accounts for less than 0.1% of international money flows.
Rather
than always trying to concoct a fundamental story that justifies a price
trend it is sometimes best to acknowledge that speculators are driving the
price in a particular direction for reasons that have little to do with
the true fundamentals.
The Stock Market
The US stock market is immersed
in a speculative blow-off for the ages. By almost every measure it is now
at its most extreme level ever. For example:
1) Measured in terms
of either price/earnings or price/sales, the valuation of the median US
stock is much higher than it has ever been.
2) The Investors
Intelligence Bull/Bear ratio recently made an all-time high.
3)
More money than ever before is now flooding into US equity funds.
4) The bottom section of the following weekly chart shows that the SPX's
weekly RSI is 90.5. This is an all-time high. In other words,
intermediate-term momentum has never been greater.
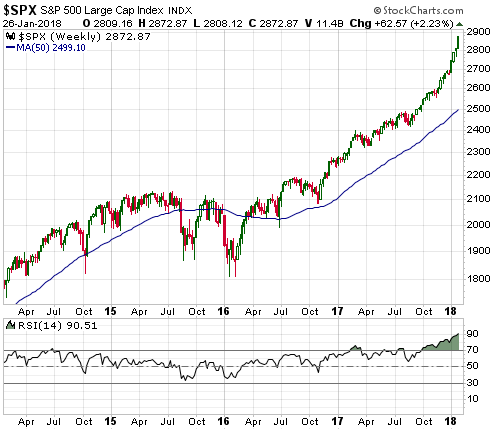
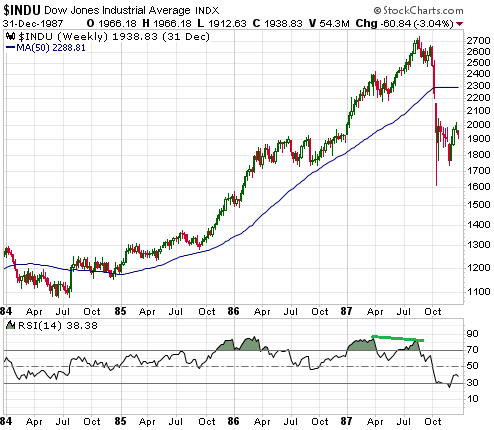
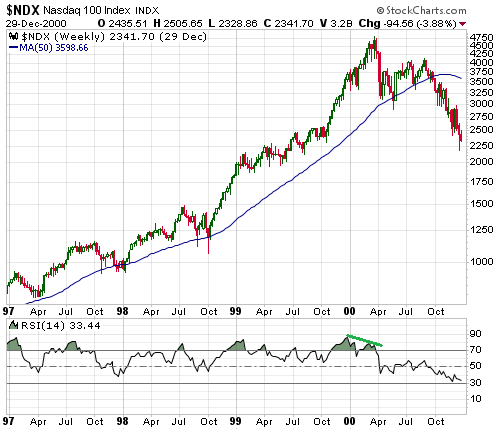
However, for two main reasons there probably won't be anything more
negative than a 5%-10% short-term correction within the coming few months.
The first reason is that major momentum extremes have historically
occurred well in advance of major price extremes. Weekly charts
illustrating two examples are displayed below. The first chart shows that
in 1987 the Dow's weekly RSI peaked in March but the Dow itself didn't
peak until 5 months later and didn't crash until 7 months later. The
second chart shows that in 1999-2000 the NDX's weekly RSI peaked in
December-1999 but the NDX itself didn't peak until the following March.
The second reason is that our Equity True Fundamentals Model (ETFM),
which combines credit spreads, the yield curve, the relative strength of
the banking sector, the TIPS yield and the G2 (US + euro-zone) monetary
inflation rate, is neutral. The ETFM is not supposed to warn of short-term
corrections, but it should move into bearish territory a few months prior
to the start of a bear market. For example, during the preceding cycle the
ETFM made a sustained drop into bearish territory in March-2007 and turned
very bearish in May-2007, but the SPX didn't reach its final high until
October-2007.
Up until a couple of weeks ago our intention was to
add a short-term bearish speculation to the TSI List and add to an
existing small QQQ put-option position in our own account following
evidence of a downward reversal, but due to the US stock market's extreme
upward momentum that is no longer the case. Instead, the only bearish
speculation of interest to us right now is Tesla (TSLA).
The
speculative blow-off in the NASDAQ over the past few weeks gave TSLA's
price a boost, but not enough of a boost to alter the chart's bearish
appearance (see below). TSLA still appears to be tracing out a rounded
top, with twin peaks in June and September of last year and major support
at $300.
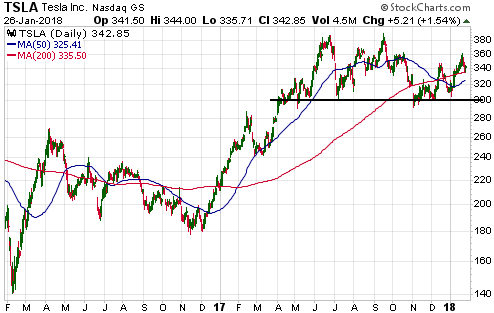
Ultimately the stock will lose most of its value, but the difficulty,
as usual, is with the timing. The risk for the bears on this stock is that
in the current manic market environment, if TSLA were to break above last
year's top then it could move a lot higher before coming back to earth.
We have added the TSLA April-2018 $250 put option to the TSI List at
the mid-point of last Friday's bid-offer spread (US$2.70). This position
has a high risk of suffering a 50%-100% loss and a realistic chance of
achieving a gain of several hundred percent. It all depends on WHEN the
TSLA stock price breaks below $300. For example, our interpretation of the
chart pattern could be correct, but if the breakdown occurs after
mid-April it will be too late for these options.
This week's
significant US economic events
[Notes:
1) The most important events
(to the markets) are shown
in bold. 2) A list of global economic events can be found
HERE]
| Date | Description |
| Monday Jan-29 | Personal Income and Spending |
| Tuesday Jan-30 |
Case-Shiller Home Price Index Consumer Confidence |
| Wednesday Jan-31 |
Employment Cost Index Pending Home Sales Chicago PMI FOMC Announcement |
| Thursday Feb-01 |
Motor Vehicle Sales Q4 Productivity and Costs Construction Spending ISM Index |
| Friday Feb-02 |
Monthly Employment
Report Consumer Sentiment Factory Orders |
Gold and the Dollar
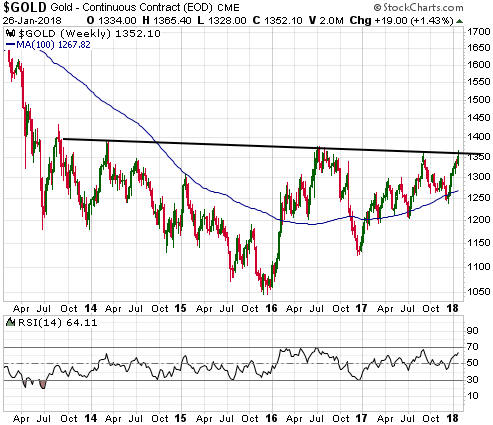
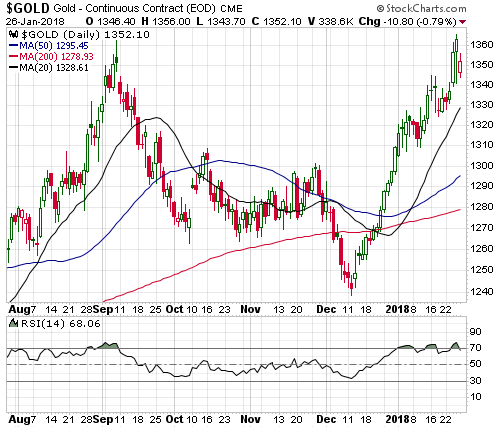
Although the rally in the US$ gold price looks stretched on a
short-term basis, as pointed out in a few recent commentaries it will be
reasonable for traders to give the rally the benefit of the doubt until
there is a daily close below the 20-day MA. This MA will rise into the
low-$1330s within the next two days.
By the way, the FOMC
Announcement scheduled for this Wednesday (31st January) should not have a
significant effect on the gold market or any other market. This is because
the Fed won't make any change and no-one who has been paying attention
expects any change. Unless something dramatic happens in the meantime, the
next Fed rate hike will happen in March.
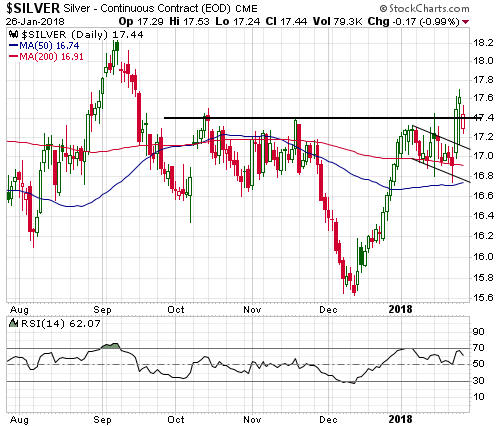
Silver
Silver has been in a downward trend relative to gold since July of
2016. This trend may have just ended.
We expect silver to
outperform gold over the next 4-6 months, for the following reasons:
1) Silver's relative weakness over the past 18 months combined with
today's historically-low silver/gold ratio creates the potential for a
period of relative strength by silver.
2) Silver's COT situation is
more supportive than gold's.
3) If the US$ gold price breaks out to
the upside then the speculating community will turn its attention to
gold-associated investments that are perceived to be leveraged plays on
gold. These investments include gold-mining stocks and silver.
4)
Being as much an industrial metal as a 'monetary' metal, silver should
benefit from continuing strength in industrial metals relative to gold.
The following daily chart shows that last week the silver price broke
above short-term resistance at $17.40. Furthermore, it did so after first
spiking to a new low for the year, which makes the upside breakout more
bullish than would otherwise be the case.
More important resistance
is defined by the September-2017 high of $18.29. Ideally (from a bullish
perspective), this resistance will be tested before the start of a
multi-week correction.
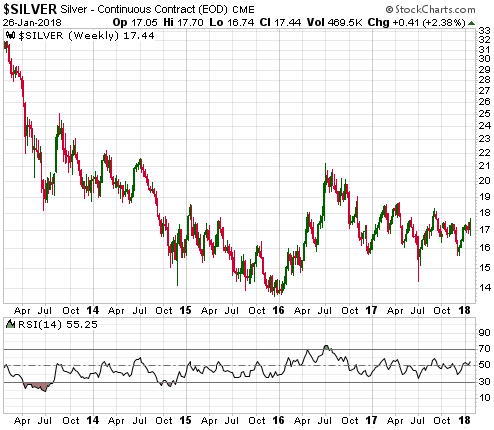
Turning to silver's weekly chart, what we see is a picture of a market
that has been basing, or coiling, for almost a year. This chart suggests
the potential for a move up to the low-$20s within the next few months.
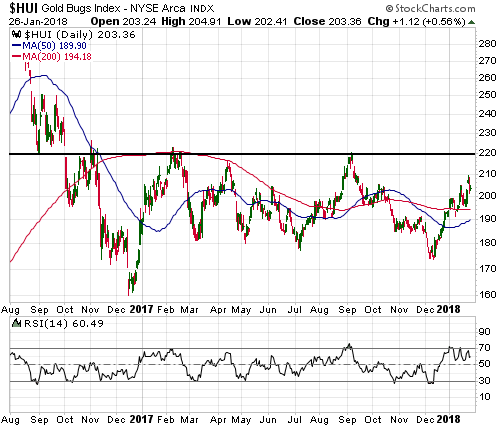
Gold Stocks
Current
Market Situation
We do not expect the HUI to breach its
December-2017 low, at least not this year. Furthermore, we expect the
gold-mining indices and ETFs to have a strong upward bias during the first
half of this year. That being said, nothing has happened to date to
differentiate the current rally from the 1-2 month counter-trend rebounds
that occurred during 2017.
During the first half of last week the
HUI tacked-on 8 points and traded as high as 210 before giving up most of
its gain and ending the week with a net rise of only 1 point. It therefore
remains well below important resistance at 220.
A weekly close
above 220 would leave little doubt that we are dealing with an
intermediate-term upward trend, but even a successful test of 220 within
the next week or two would have bullish implications. That's because
triple tops (a triple top is what we'd be dealing with if the HUI were to
reverse downward after reaching 220 in the near future) usually don't
hold. The most likely outcome following a successful near-term test of 220
would be a few weeks of consolidation and then a sustained upside
breakout.
We think that the gold-mining sector's prospects are
neutral with regard to the coming 1-2 months and bullish with regard to
the coming 3-5 months.
PVG stays in the 'too hard basket'
Due to the inherent difficulty of accurately predicting the output of
a mine where the nugget effect is extreme and due to the disagreements
between very knowledgeable geologists regarding the Brucejack project's
resource model, we put Pretium Resources (PVG) into the 'too hard basket'
long ago. Last week's news from the company was a reminder of the
challenges posed by this incredibly high grade, but very inconsistent,
deposit.
The company declared "commercial production" at Brucejack
in July of last year and achieved gold production of 82K ounces during the
first quarter of the mine's ramp-up (Q3-2017). This was an excellent
result and temporarily allayed fears that the resource model was
over-estimating the amount of recoverable gold. However, PVG reported last
week that production was only 70K ounces during the second quarter of the
mine's ramp-up due to the average grade being lower than predicted. This
immediately rekindled all the old fears about the potential inaccuracy of
the resource model, leading to a 35% plunge in the stock price.
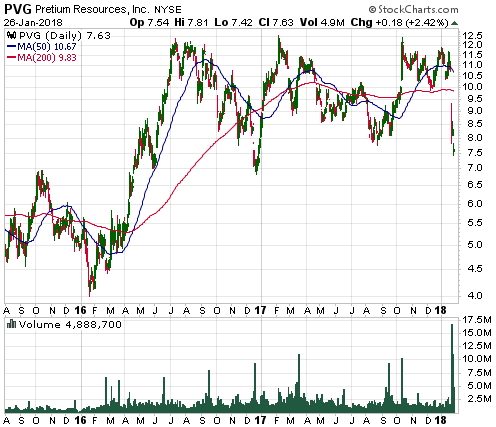
According to the company's Feasibility Study, production was expected
to average about 500K ounces/year in years 1-8, but the guidance is now
for 300K-350K ounces during the first year. In other words, it seems that
the first year's production will be at least 150K ounces less than
originally expected.
Perhaps with additional information gleaned
from grade-control drilling the mine will be able to start producing at
the originally-forecast rate by its second year of operation, but the risk
is substantial because even after last week's price plunge the stock is
not cheap. The current enterprise value (market cap plus net debt) is
about US$2.1B, which would be reasonable if the production ramp-up were on
track but is a high price to pay considering the uncertainty.
We
therefore won't be buying the dip.
The Currency Market
The Swiss Franc (SF) catches fire
In the 20th November Weekly Update and again in the 4th December
Weekly Update we wrote that a substantial SF rally may be brewing and
therefore that it would make sense to accumulate a position in this
currency over the ensuing weeks. With regard to the SF's performance
relative to US$, the first of the following charts indicates: so far, so
good. The SF broke above intermediate-term lateral resistance at 106 last
week and ended the week at its highest level since Q3-2015.
Based
on the price action and the SF's still-constructive COT situation (the
second of the following charts shows that speculators in the futures
market have maintained a sizable net-short position in the SF despite the
currency's recent strength), it's likely that the SF will trade at 110-112
before the middle of this year.
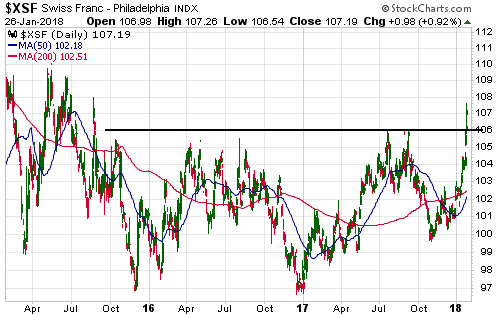
With regard to the SF's performance relative to the euro, an end to
the relentless downward trend was signaled last week by SF/euro's first
solid break above its 50-day MA in almost a year.
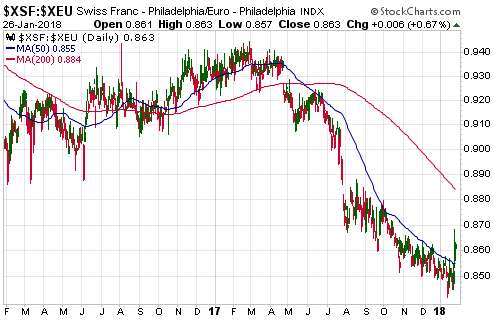
Relative to the euro the SF's short-term risk/reward is bullish, but
relative to the US$ the SF's short-term risk/reward is now neutral at best
due to the speed of its recent ascent. We expect that SF/US$ will spend
the bulk of the next month in correction mode.
The Dollar Index (DX) extends its climactic
sell-off
Here is a weekly chart of the DX including 20, 50
and 200 week MAs.
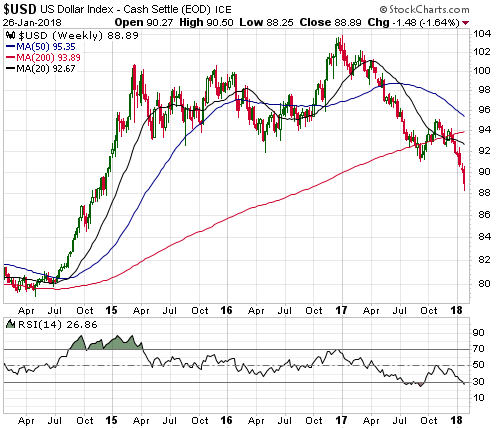
With regard to the US dollar's cyclical trend, the point of
recognition for us came between the second half of last July, when the
euro broke above important resistance at 1.15-1.16, and early-September,
when the Dollar Index (DX) broke below its 200-week MA. We described the
break below the 200-week MA as a virtual nail in the bull market's coffin.
It indicated that there would be additional downside in the DX over the
ensuing 12 months, although at the time of the breakdown the DX was so
'oversold' as to set the stage for a 2-3 month rebound.
The DX's
rebound from its early-September low lasted two months and was followed by
a new short-term downward trend. This short-term downward trend
accelerated over the past three weeks and if it hasn't already done so
should climax within the next two weeks, leading to another significant DX
rebound. Our guess is that the next rebound will be shorter and sharper
than the one that began in early-September of last year, but in any case
it is reasonable to expect the DX to make new multi-year lows following
whatever correction occurs during February-March.
Updates
on Stock Selections
Notes: 1) To review the complete list of current TSI stock selections, logon at
http://www.speculative-investor.com/new/market_logon.asp
and then click on "Stock Selections" in the menu. When at the Stock
Selections page, click on a stock's symbol to bring-up an archive of
our comments on the stock in question. 2) The Small Stock Watch List is
located at http://www.speculative-investor.com/new/smallstockwatch.html
![]() Company
news/developments for the week ending Friday 26th January 2018:
Company
news/developments for the week ending Friday 26th January 2018:
[Note: AISC = All-In Sustaining Cost, FS = Feasibility Study, FY =
Financial Year, IRR = Internal Rate of Return, ISR = In-Situ Recovery,
MD&A = Management Discussion and Analysis, M&I = Measured and Indicated,
NAV = Net Asset Value, NPV(X%) = Net Present Value using a discount rate
of X%, P&P = Proven and Probable, PEA = Preliminary Economic Assessment,
PFS = Pre-Feasibility Study]
*Alkane Resources
(ALK.AX) published its quarterly activities and cash-flow reports
for the December quarter.
The combined amount of cash, cash
equivalents and bullion increased by A$4.4M during the quarter and the
balance sheet remains solid. At the end of December ALK had no debt and
about A$58M of liquid financial assets.
Gold production during the
quarter from the company's Tomingley Gold Operation (TGO) was slightly
above plan and the production guidance for the current Financial Year (1st
July 2017 to 30th June 2018) has been increased from 65K-70K ounces to
70K-80K ounces at a reduced AISC of A$1000-A$1100/oz (US$800-$880/oz).
This implies expected production of 30K-40K ounces over the next two
quarters and means that the TGO should continue to add cash to the balance
sheet.
An underground mining study for the TGO is scheduled to be
completed this quarter. This study has the potential to be a positive,
market-moving piece of news.
For the fully-permitted Dubbo Project
(DP), which is slated to produce zirconium, hafnium, niobium and REEs, the
company advised that a project execution and financial model incorporating
the results of the modularised build study will be released in February.
This is the information that we've been eagerly awaiting. We expect that
it will highlight the extreme under-valuation of ALK shares.
The
economics of the DP have been given a boost over the past year by the
stricter environmental controls being implemented in China. The reason is
that the environmental crackdown in China is reducing the global supply,
and therefore elevating the prices, of the DP's main commodity outputs.
At some point it will make sense for ALK to split into two listed
companies, perhaps by floating-off the TGO. This is mainly because a much
higher overall market valuation would result from forcing the market to
separately value each of the company's projects.
*Blackham
Resources (BLK.AX) resumed trading and provided the full details
of the entitlement issue (EI) under which eligible shareholders will have
the right to subscribe for 5 new shares at A$0.04/share for every 2
existing shares. The scheduled closing date for acceptances under the EI
is 12th February, so any eligible shareholder who wants to exercise
his/her rights should do so well before that date.
Eligible
shareholders who do not want to exercise their rights could choose to sell
them on the market. Rights trading has begun and will end on 5th February.
The rights trade on the ASX under the symbol BLKRA and were priced at
A$0.02 at the end of last week.
As expected and as is normal in
these situations, "eligible" shareholders are those with registered
addresses in Australia or NZ. Other shareholders will have their EI rights
sold on the market by the lead underwriter (Hartleys) and will have the
proceeds of the sale sent to their brokerage accounts. No action is
required.
A free 12-month option with an exercise price of A$0.08
will accompany every two new shares purchased under the EI. These options
will be listed on the ASX at a date to be advised (it will be 20th
February or later). At the current BLK share price the options will have
minimal value, but they could attain significant value before year-end if
the company achieves its production plan.
Note that if you are a
non-eligible shareholder who wants to take advantage of the low price
created by the EI, buying shares on the market at 0.06-0.07 (the current
price) and receiving the proceeds of the rights sale should work out to be
roughly the same net cost as exercising the rights. The only significant
difference is that you wouldn't get the free options, but it may be
possible to buy the options on the market at 0.01-0.02 within the next two
months.
More information can be found in the letter and associated
documents that were sent to shareholders early last week. A copy of the
letter is posted
HERE.
For TSI record purposes it will be assumed that the
rights are exercised in full, that is, we'll assume the addition of 2.5
new shares at a cost of 0.04 for each existing share and the receipt of
1.25 free options for each existing share.
*Energold
Drilling (EGD.V) issued a corporate update to advise that:
a) In 2017 the company achieved a year-over-year increase of 27% in
the number of metres drilled by its minerals division.
b) The
minerals division is expected to put in another strong performance in
2018.
c) Higher oil prices are leading to increased business for
the company's energy division, meaning that this division's financial
performance should be much improved in 2018.
d) The manufacturing
division is expected to return to profitability in 2018.
In
summary, the intermediate-term prospects for EGD's business are much
better now than they have been in years. This is not at all surprising. In
conjunction with the depressed share price it is why we consistently
included EGD in the list of candidates for new buying over the past three
months.
![]() List
of candidates for new buying
List
of candidates for new buying
From within the ranks of TSI
stock selections the best candidates for new buying at this time, listed
in alphabetical order, are:
1) AAU (last Friday's closing price:
US$0.91)
2) ALK.AX (last Friday's closing price: A$0.32)
3)
ESM.TO (last Friday's closing price: C$1.29)
4) NSU (last Friday's
closing price: US$2.37)
5) PRQ.TO (last Friday's closing price:
C$1.50)
The above list is limited to five stocks. It will sometimes
contain less than five, but it will never contain more than five
regardless of how many stocks are attractively priced for new buying.
![]() Removing
the Asanko Gold (AKG) trading position
Removing
the Asanko Gold (AKG) trading position
We have removed the
AKG trading position from the TSI List. The stock has benefited from short
covering over the past several weeks and is up by about 100% from its
December-2017 low. However, we got the timing wrong and it is down by 34%
since its addition to the List last June.
AKG attracted a lot of
negative press over the past year, some of it justified and some of it
not. The company has failed to meet production targets, but the situation
on the ground does not appear to be as bad as portrayed by the short
sellers. Also, there's a good chance that the company will be able to
delay its debt repayments and maintain a sufficient cash reserve.
We hasten to point out, however, that despite its large price decline AKG
does not offer great value relative to some other gold producers that are
less risky.
Chart Sources
Charts appearing in today's commentary
are courtesy of:
http://stockcharts.com/index.html
http://www.goldchartsrus.com/