


-- Weekly Market Update for the Week Commencing 29th February 2016
Big Picture
View
Here is a summary of our big picture
view of the markets. Note that our short-term views may differ from our
big picture view.
The BULL market in US Treasury Bonds
that began in the early 1980s ended in early-2015, but there will be many years
of topping action in bond prices and bottoming action in bond yields before
major new trends get underway. (Last update: 29 June 2015)
The stock market, as represented by the S&P500 Index,
commenced
a secular BEAR market during the first quarter of 2000, where "secular
bear market" is defined as a long-term downward trend in valuations
(P/E ratios, etc.) and gold-denominated prices. This secular trend will bottom sometime between 2018 and 2020.
(Last update: 29 June 2015)
A secular BEAR market in the
US
Dollar
began during the final quarter of 2000 and ended in July of 2008. This
secular bear market will be followed by a multi-year period of range
trading.
(Last
update: 09 February 2009)
Gold commenced a
secular bull market relative to all fiat currencies, the CRB Index,
bonds and most stock market indices during 1999-2001.
This secular trend will peak sometime between 2018 and 2020.
(Last update: 29 June 2015)
Commodities,
as represented by the CRB Index, commenced a
secular BULL market in 2001 in nominal dollar terms. The first major
upward leg in this bull market ended during the first half of 2008, but
a long-term peak won't occur until 2018-2020.
(Last
update: 29 June 2015)
Copyright
Reminder
The commentaries that appear at TSI
may not be distributed, in full or in part, without our written permission.
In particular, please note that the posting of extracts from TSI commentaries
at other web sites or providing links to TSI commentaries at other web
sites (for example, at discussion boards) without our written permission
is prohibited.
We reserve the right to immediately
terminate the subscription of any TSI subscriber who distributes the TSI
commentaries without our written permission.
Outlook Summary
Market
|
Short-Term
(1-3 month)
|
Intermediate-Term
(6-18 month)
|
Long-Term
(2-5 Year)
|
|
Gold
|
N/A |
Bullish
(26-Mar-12) |
Bullish
|
|
US$ (Dollar Index)
|
N/A |
Bullish
(29-Feb-16) |
Neutral
(19-Sep-07) |
|
US Treasury Bonds (TLT)
|
N/A |
Bearish
(19-Oct-15)
|
Bearish |
|
Stock Market
(DJW)
|
N/A |
Bearish
(30-Dec-15) |
Bearish
|
|
Gold Stocks
(HUI)
|
N/A |
Bullish
(23-Jun-10) |
Bullish
|
|
Oil |
N/A |
Neutral
(26-Oct-15) |
Bullish
|
|
Industrial Metals
(GYX)
|
N/A |
Neutral
(09-Nov-15) |
Bullish
(28-Apr-14) |
Notes:
1. Our short-term expectations are discussed in the commentaries, but except in
special circumstances we won't attempt to assign a "bullish", "bearish" or
"neutral" label to these expectations.
2. The date shown below the current outlook is when the most recent outlook change occurred.
3. "Neutral" means that we think risk and reward are roughly in balance with respect to the timeframe in question.
4. Long-term views are determined almost completely by fundamentals and intermediate-term views
are determined by a combination of fundamentals, sentiment and technicals.
Last week's posts at the TSI Blog
An oil glut doesn't preclude an oil price bottom
The "Streetlight Effect" in the gold market
It's finally time to
bet against the T-Bond
When discussing the US
government bond market in mid-January and again in early-February, we wrote:
"Although we are intermediate-term bearish on long-dated US treasury
securities, we aren't yet interested in establishing a bearish speculation. Our
reasons are 1) there's a decent chance of some additional short-term upside (in
response to stock market weakness) as part of the long-term topping pattern, 2)
the decline in the Treasury market is more likely to be a steady grind than a
plunge, and 3) there are speculative opportunities with better reward/risk
ratios."
We are now interested in establishing a bearish T-Bond speculation. The first
reason is that while there is still the risk of additional short-term upside in
the T-Bond price in response to stock market weakness, it will probably take a
lot of stock market weakness just to stop T-Bond and T-Note prices falling from
their current elevated levels. The second reason is the price action illustrated
by the following chart of the iShares 20+ Year Treasury Bond Fund (TLT).
The chart shows that TLT reversed downward after testing long-term resistance
during the first half of February and made a slightly lower high last week. We
obviously can't be sure, but this looks like a top.
If TLT has just topped, then TBT (the ProShares UltraShort 20+ Year Treasury
Fund) has just bottomed.
There are numerous ways to establish a bearish T-Bond speculation. Examples
include shorting TLT, buying TLT put options, buying TBT, and buying TBT call
options. For TSI record purposes we are choosing the most leveraged of the
aforementioned examples, meaning that we are adding a TBT call option position
to the TSI List. The selected option is the June-2016 $40 call, which ended last
week at US$1.24.
A 10% decline in TLT within the next three months would likely lift the price of
this TBT call option to around $5. As always with out-of-the-money options, the
downside risk is 100%.
Copper Update
The copper price has moved above
the top of its 10-month channel, but still needs to achieve a daily close above
lateral resistance at $2.15 to indicate that something more than a short-term
counter-trend rebound is underway. This resistance was tested last Friday.
As noted two weeks ago, the evidence that the US$ gold price made a multi-year
bottom last December is a reason to believe that a sustained upturn in the
copper price might not be far away.
The Stock Market
The US
The S&P500 Index (SPX) closed above its 50-day MA on Thursday and Friday of last
week, but hasn't quite managed to break above lateral resistance at 1950.
If/when it does, the target will be the more important lateral resistance at
1990-2000.
Our guess is that the SPX's rebound will extend, in fits and starts, to the
200-day MA (currently in the 2020s), although we'll take the evidence as it
comes and we are certainly open to other possibilities.
In assessing the market's upside potential we'll be paying close attention to
measures of market breadth such as the number of individual stocks making new
52-week highs/lows, and to sentiment indicators such as put/call ratios. For
example, near the end of a counter-trend rebound we would expect to see a
divergence between the number of individual stocks making new highs and the
senior indices, with the former not confirming the strength in the latter. We
would also expect to see a relatively high level of concern on the part of the
smart money and complacency on the part of the dumb money, which is the opposite
of what put/call ratios were revealing 2 weeks ago.
Also worth mentioning is that even though a rebound to as high as or even higher
than the 200-day MA could be on the cards, we will probably BEGIN to build a new
US stock-market bearish position if the SPX rises to the high-1900s within the
coming 2 weeks. Furthermore, although the SPX is our main index proxy for the US
stock market, our next bearish speculation -- like the ones that preceded it
over the past 8 months -- will focus on the NASDAQ100 Index (NDX). The reason is
that the NDX is where the greatest over-valuation, and hence the greatest
vulnerability, lies.
Here's a daily chart of the NDX showing lateral resistance at 4300. The 4300
level for the NDX is equivalent to the 1950 level for the SPX.
Note that if the NDX breaks above 4300, the measured objective will be the
December high of 4700. This means that a lot of technical analysts will have
4700 as a short-term target following a daily close above 4300, but it
absolutely does not mean that a break above 4300 will necessarily be followed by
a rise to as high as 4700. Markets aren't that simple.
If, like us, you plan on scaling into a bet against the NDX as the market
extends its rebound, then you could choose to short-sell QQQ (the NASDAQ100 ETF),
or buy QID (the ProShares UltraShort QQQ Fund), or buy QQQ put options, or buy
QID call options, or establish another position that rises in price when the NDX
falls in price. As usual, we will use options to place the bet in our own
account. This is because we are comfortable trading options and because options
allow us to obtain the exposure we want to a potentially large market move
without putting much money at risk (for trades such as this we prefer to risk a
100% loss on a small sum than risk a much smaller percentage loss on a much
larger sum). However, buying an inverse fund such as QID could be a more
appropriate choice for many of our readers.
We haven't yet decided on the specific option or options that we'll use for this
bearish speculation, but we are sure that the ones we end up choosing will not
expire earlier than June-2016 or later than December-2016.
This week's
significant US economic events
[Notes:
1) The most important events
(to the markets) are shown
in bold. 2) A list of global economic events can be found
HERE]
| Date |
Description |
| Monday
Feb 29 |
Chicago PMI
Pending Home Sales Index |
| Tuesday
Mar 01 |
Motor Vehicle Sales
ISM Mfg Index
Construction Spending |
| Wednesday
Mar 02 |
Fed's Beige Book |
| Thursday
Mar 03 |
Q4 Productivity and Costs
(revised)
ISM Non-Mfg Index
Factory Orders |
| Friday
Mar 04 |
Monthly Employment Report
International Trade Balance |
Gold and the Dollar
Gold
The COMEX Gold Stockpile - Fact versus Fiction
Every now and then ZeroHedge.com posts a chart showing the total Open Interest (OI)
in COMEX gold futures divided by the amount of "Registered" gold in COMEX
warehouses. Refer to the article posted
HERE for a recent example. The result of this division is supposedly the
amount of gold that could potentially be demanded for delivery versus the amount
of gold available for delivery, with extremely high numbers for the ratio
supposedly indicating that there is a high risk of a COMEX default due to
insufficient physical gold in storage. We say "supposedly", because it actually
indicates no such thing. The ratio routinely displayed by ZeroHedge -- and other
gold market 'pundits' who shall remain nameless -- is actually meaningless.
One reason it is meaningless is that the amount of gold available for delivery
is the amount of "Registered" gold PLUS the amount of "Eligible" gold, meaning
the TOTAL amount of gold at the COMEX. It is true that only Registered gold can
be delivered against a contract, but it is a quick and simple process to convert
between Eligible and Registered. In fact, much of the gold that ends up getting
delivered into contracts comes from the Eligible stockpile, with the conversion
from Eligible to Registered happening just prior to delivery.
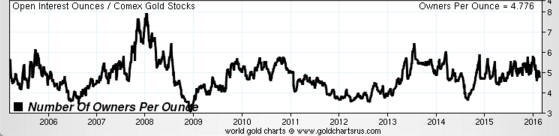
If we look at the ratio of COMEX Open Interest to total COMEX gold inventory,
which we'll do with the aid of the following chart prepared by Nick Laird (www.sharelynx.com),
we see that it has oscillated within a 3.5-6.5 range over the past 7 years and
that nothing out of the ordinary has happened over the past three years.
Another reason that the OI/Registered ratio regularly displayed by ZeroHedge et
al is meaningless is that the total Open Interest in gold futures is NOT the
amount of gold that could potentially be demanded for delivery. The amount of
gold that could potentially be demanded for delivery is the amount of open
interest in the nearest contract. For example, when ZeroHedge posted its
dramatic "Something
Snapped At The Comex" article in late-January to supposedly make the point
that there were more than 500 ounces of gold that could potentially be called
for delivery for every available ounce of physical gold, in reality there were
about 15 ounces of physical gold in COMEX warehouses for every ounce that could
potentially have been called for delivery into the expiring (February-2016)
contract.
Although it provides no information about the ability of short sellers to
deliver against expiring futures contracts when called to do so, it is
reasonable to ask why the ratio of total OI to Registered gold has risen to such
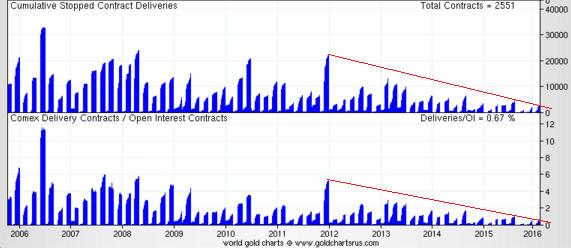
a high level. We can only guess, but we suspect that the following chart (also
from www.sharelynx.com) contains the explanation.
The chart shows the cumulative stopped contract deliveries, or the amount of
gold that was delivered into each expiring contract, in absolute terms and
relative to open interest. Notice the downward trend beginning in late-2011.
Notice also that the amount of gold delivered to futures 'longs' over the past
two years is much less in both absolute and relative terms than at any other
time over the past decade.
It is clear that as the gold price fell, the desire of futures traders to 'stop'
a contract and take delivery of physical gold also fell. In other words, the
unusually-small amount of gold maintained in the Registered category over the
past two years is probably related to the unusually-low desire on the part of
futures 'longs' to take delivery.
It's a good bet that the desire to take delivery will increase during the next
multi-year rally, prompting a larger amount of gold to be held in the Registered
category.
In conclusion, the fact is that at no time over the past several years has there
been even a small risk of a COMEX delivery default. However, this fact is
obviously not as exciting as the fiction that is regularly published by scare
mongers.
Gold and the Employment Report
At the end of this week (Friday 4th March) we get the latest edition of the US
monthly employment report. The data in this report, especially the headline jobs
growth number, can aptly be described as seasonally-adjusted noise. It's noise
because it indicates almost nothing about the current or future performance of
the economy, but it's made even less relevant as an economic indicator by
seasonal adjustment. How significant is the seasonal adjustment? Well, in
January a non-seasonally-adjusted LOSS of about 2.9 MILLION jobs became a
seasonally-adjusted GAIN of 151 thousand jobs*.
Despite its uselessness as an economic indicator, the monthly employment report
has an outsized effect on the financial markets in general and on the gold
market in particular because of this report's influence on the Fed.
The employment report's effect on the gold market tended to be negative during
2013, 2014 and the first few months of 2015, but the bias appears to have
changed. The gold price has risen on 6 of the past 11 employment-report days and
achieved a net gain of $59 over these 11 days.
That being said, we would not bet on the gold price rising in reaction to the
data to be revealed on Friday. We would also not bet on it falling, because both
the data and the market reaction to the data are too unpredictable to justify a
bet either way.
*Refer to the article at posted
HERE for details
Current situation for the US$ gold price
From last week's Interim Update:
"...a daily close below [lateral support at] $1190 would be a clear signal
that a short-term top was in place. Also, the 20-day MA has moved up to the
$1180s and will be above $1190 by the end of this week. Once it moves above
$1190 a daily close below the 20-day MA could reasonably be interpreted as
confirmation of a short-term top.
Until a short-term top is signaled via a daily close below $1190 and/or the
20-day MA there will be a realistic chance of a rise to the resistance that lies
at $1300-$1308. This resistance, in our opinion, defines the maximum
daily-closing upside potential with regard to the coming two months, although it
is likely to be breached within the coming 6 months."
By the end of last week the 20-day MA had reached $1195 and during the first
half of this week it will move above $1200, so this moving average can now be
considered the demarcation between a continuing short-term upward trend and a
significant downward correction. In other words, a daily close below the 20-day
MA would now provide the most timely confirmation that a short-term top is in
place.

As things currently stand, the price action since the 11th February peak could
reasonably be interpreted as either a consolidation within a continuing
short-term upward trend or a topping pattern (although if we had to make a guess
we'd choose the latter). This means that a move up to $1300-$1308 could still
occur prior to a short-term top.
In the absence of a dramatic catalyst, a move significantly beyond the
$1300-$1308 resistance is unlikely in the near future. The reason is that in
addition to the gold market recently becoming extremely stretched to the upside
based on measures of short-term momentum, the Commitments of Traders (COT)
situation is now bearish for gold.
Gold in terms of other currencies
Before gold can break out in terms of the strongest currency (the US$), it must
first break out in terms of the weaker currencies. Here are charts showing that
long-term breakouts have occurred in terms of some of the most important of the
weaker currencies.
The first chart shows that in Australian Dollar terms the gold price has
completed a multi-year consolidation. This chart suggests that gold/A$ will make
a new all-time high within the coming 12 months.
The second chart shows that gold/C$ (gold in Canadian Dollar terms) is in a
similar position to gold/A$.
The third chart suggests that in euro terms the gold price has either just
completed a multi-year consolidation or is close to doing so.
Silver
The following chart shows that silver reversed lower two weeks ago from the top
of a well-defined channel and fell below its 200-day MA last Friday.
Silver's problem at the moment is weak demand for the physical commodity. We
know that physical demand is weak, regardless of any anecdotal evidence to the
contrary, because it took a rise in the total speculative net-long position in
silver futures to a 7-year high just to get the price to the top of its
intermediate-term downward-sloping channel.
As explained in the past, it is normal for silver to perform worse than gold
during the first year of a cyclical gold bull market and to dramatically
outperform later in the bull market.
Gold Stocks
On Friday 26th February Goldcorp (GG) announced abysmal financial results for
2015 (including a $3.9B asset write-down) and reduced production guidance for
2016. This led to a 13% plunge in its stock price.
We suspect that the results and guidance reported by GG last Friday constitute
an attempt by the company's new CEO to 'clear the decks' and in doing so make it
easier to report better results in the future. In any case, we've thought that
GG was an over-hyped and over-valued stock for a long time. We had no interest
in owning it prior to last Friday and have no interest in owning it now.
Due to GG being one of the largest components of both the HUI and the XAU,
Friday's news from this company cast a pall over the entire gold-mining sector.
However, the gold-mining indices showed some resilience and the 'technical
damage' was minimal. At this stage, neither the HUI nor the XAU has signaled a
short-term top.
As mentioned last week, the XAU is closer than the HUI to important support and
would therefore have to fall by a lesser amount to confirm a short-term downward
reversal. For the XAU the demarcation level is lateral support at 58. A daily
close below 58 would be a clear signal that a short-term top is in pace.
An earlier, albeit less reliable, reversal signal would be a daily close below
the bottom of the 3-week channel drawn on the following chart.
Until a short-term top is signaled there will be a realistic chance that a very
'overbought' market will become even more so prior to such a top. Once a
short-term top is signaled it will be reasonable to expect a decline of
sufficient magnitude and/or time to bring about a test of the 50-day MA.
The Currency Market
Last week we wrote:
"There's a good chance that the Dollar Index will trade at least a few points
above its March-2015 peak before this year is over. The main question is: will
the start of a rally to new multi-year highs be preceded by a decline to near
the bottom of the 12-month range (the low-90s)?
Based on the recent price action the answer to the above question is: yes, it
probably will be. However, all it would take to negate the recent short-term
bearish evidence is a weekly close above 97.5.
Unless the facts change in the meantime, our intermediate-term outlook for the
Dollar Index will shift from "neutral" to "bullish" following either a decline
to the low-90s or a weekly close above 97.5."
The Dollar Index ended last week above 97.5, so our intermediate-term outlook
has shifted as noted above.
Our intermediate-term bullish outlook for the Dollar Index is based first and
foremost on relative strength in the US stock market. As illustrated by the
chart included in the 22nd February Weekly Update, the rally to new multi-year
highs in the SPX/MSWORLD ratio (US equities relative to global equities
excluding the US) projects a Dollar Index rally to new multi-year highs within
the next several months. And as illustrated by the chart displayed below, the
recent breakdown in the VGK/SPX ratio (European equities relative to US
equities) projects a euro decline to new multi-year lows. The Dollar Index is
dominated by the USD/EUR exchange rate, so a decline to new multi-year lows by
the euro would almost certainly go hand-in-hand with a rise to new multi-year
highs in the Dollar Index.
Last week's price action indicates that the Dollar Index probably made a
short-term bottom about two weeks ago and that the rally to new multi-year highs
projected by the US stock market's relative strength could be underway. However,
there is a realistic chance of at least a few more weeks of back-and-forth price
action prior to the start of a consistent upward trend in the Dollar Index.
The following chart of the Dollar Index shows a short-term price channel that is
NOT properly defined*. This channel represents a guess as to a plausible
short-term outcome. The guess is that the current multi-week rally will end at
98.5-99.0.
*A "properly defined" channel is defined by a minimum of
five points consisting of at least three points on one side and at least two
points on the other side.
Updates
on Stock Selections
Notes: 1) To review the complete list of current TSI stock selections, logon at
http://www.speculative-investor.com/new/market_logon.asp
and then click on "Stock Selections" in the menu. When at the Stock
Selections page, click on a stock's symbol to bring-up an archive of
our comments on the stock in question. 2) The Small Stock Watch List is
located at http://www.speculative-investor.com/new/smallstockwatch.html
 Company
news/developments for the week ending Friday 26th February 2016:
Company
news/developments for the week ending Friday 26th February 2016:
[Note: AISC = All-In Sustaining Cost, FS = Feasibility Study, FY = Financial
Year, IRR = Internal Rate of Return, MD&A = Management Discussion and Analysis,
M&I = Measured and Indicated, NAV = Net Asset Value, NPV(X%) = Net Present Value
using a discount rate of X%, P&P = Proven and Probable, PEA = Preliminary
Economic Assessment, PFS = Pre-Feasibility Study]
*Almaden Minerals (AAU) put out a press release to report the
assay results from a single infill/metallurgical drill hole and to provide a
general corporate update. This is the sort of press release that junior mining
companies sometimes issue for the primary purpose of reminding the investing
community of the company's existence. In this case the message was: "Hey, gold
stock investors and analysts, don't forget about us -- we are ploughing ahead
with the development of a potentially-economic gold deposit in a decent
location."
*Evolution Mining (EVN.AX) advised that it has increased the size
of its gold forward-sales (hedge) book by 150K ounces -- from 688K to 838K
ounces. The additional forward sales were done at an average of A$1764/oz,
taking the overall average up from A$1588 to A$1619/oz.
The 838K ounces of forward sales is spread over four years. Given that EVN is
expected to have annual production of more than 800K ounces/year over this
period, the hedging covers about 25% of production. This is OK, but we wouldn't
like it if the company significantly increased its hedging beyond the current
level. Neither, we suspect, would 'the market', in that the main reason to own a
gold-mining stock is to obtain leveraged exposure to upside in the gold price.
*Ivanhoe Mines (IVN.TO) announced the results of the PFS for its
Kamoa copper project in the DRC (Democratic Republic of the Congo). Kamoa is a
joint venture between IVN and Zijin Mining. From our perspective the PFS results
were unsurprising and slightly positive.
The PFS covers the first phase of a planned 2-phase development at Kamoa. The
first phase involves spending US$1.2B to build a mine with average annual copper
production of about 200M pounds. The plan is to use the cash generated by the
first phase to eventually expand production to about 600M pounds per year.
According to the PFS, the first phase would be economically viable at a copper
price of US$3.00/pound, economically marginal at a copper price of
US$2.50/pound, and definitely not viable at the current copper price.
Specifically, the NPV(8%) and IRR would be US$986M and 17.2% at $3.00/pound and
$336M and 11.5% at $2.50/pound. This suggests that Kamoa will likely proceed to
mine construction when it looks like the copper price has made a sustained move
above $3/pound. We expect to see the copper price above $3/pound next year, but
not this year.
By the way, the discount rate used to calculate net present value (NPV) can have
a big effect on the result. IVN used an 8% discount rate for its base-case
calculations, which is reasonable without being conservative, whereas
gold-mining juniors typically use a far more aggressive 5% discount rate. If IVN
had used a 5% discount rate then its calculated NPV at $3/pound would be $1732M
instead of $986M. In other words, in this case a decrease of only 3% in the
assumed discount rate results in an increase of almost 100% in the calculated
NPV.
Based on current metal prices and what's currently known about project
resources/economics, from most to least valuable we rank IVN's projects as
follows:
1. Kipushi zinc project (DRC)
2. Kamoa copper project (DRC)
3. Platreef PGM project (SA)
The main reason we like the stock is that 'the market' is presently assigning no
value to any of these projects, given that IVN is trading well below its working
capital.
*Pilot Gold (PLG.TO): In discussing PLG's latest quarterly
financial statements last November, we had this to say: "The most important
number for an exploration-stage mining company is the working capital, which in
PLG's case was US$10.2M (C$13.6M) at 30th September (down from US$12.7M at 30th
June). At the current rate of spending this would be enough to fund the company
for 9-12 months, although we suspect that PLG's management will look for an
opportunity to top-up the treasury within the next 4 months."
It therefore didn't come as a surprise to us when PLG announced a relatively
small (C$4.45M) equity financing last week.
The new shares are unfortunately being issued at a price of only C$0.25 and each
new share comes with half of a 2-year C$0.40 warrant. This means that the new
shares are being issued at an all-time low price, resulting in significant
per-share value dilution. Surprisingly, however, the stock price reacted to the
financing news by rising sharply on heavy volume. This could possibly be
explained by the removal of the short-term financing uncertainty (sell the
rumour, buy the news) and PLG 'playing catch-up', but, as we said, it was a
surprising reaction.
PLG also announced that Cal Everett has been appointed president and chief
executive officer of the company. Mr. Everett has the right type and amount of
experience for the job.
The main concern/risk with PLG is that it hasn't yet discovered an economic gold
deposit. PLG has generated encouraging and in some cases spectacular drilling
results across multiple projects over the past couple of years, but is yet to
define a resource that stands a good chance of being developed into a mine. It
is therefore more of a play on future exploration success than on the gold
price, although pure exploration plays often start to become popular after a
gold rally has been in progress for a few months.
*Pretium Resources (PVG): A week ago we wrote: "Taking into
account the revised capex estimate and the amount of working capital that will
be needed between now and when the mine is expected to become cash-flow
positive, PVG will need to raise about US$100M. This will most likely happen via
an equity financing. Furthermore, although PVG probably won't need to raise the
additional money until next year, it's possible that the recent relative
sluggishness of PVG's share price is at least partly due to anticipation of a
sizable equity financing happening in the near future."
It turned out that 'the market' was correctly anticipating a sizable equity
financing. About 48 hours after we published the above comment, PVG announced
that it was issuing 26M new shares at US$4.58/share to raise US$120M. The
financing price represents a discount of about 10% to the market price prior to
the announcement.
In our estimate of PVG's fair value included in the 22nd February Weekly Update
we assumed that the company would issue 20M new shares. It is actually issuing
26M new shares, but this doesn't alter our view that fair value is US$5.50-$6.00
at the current gold price.
PVG could again be a good candidate for new buying after this equity financing
is put to bed and the gold-mining indices pull back to near their 50-day MAs.
List
of candidates for new buying
From within the ranks of TSI stock selections the best candidates for new buying
at this time, listed in alphabetical order, are:
1) FCG (last Friday's closing price: US$3.41)
2) IVN.TO (last Friday's closing price: C$0.68)
3) PRQ.TO (last Friday's closing price: C$2.85)
Note that the above list is limited to five stocks. It will sometimes contain
less than five, but it will never contain more than five regardless of how many
stocks are attractively priced for new buying.
Chart Sources
Charts appearing in today's commentary
are courtesy of:
http://stockcharts.com/index.html
