|
-- Weekly Market Update for the Week Commencing 29th July 2013
Big Picture
View
Here is a summary of our big picture
view of the markets. Note that our short-term views may differ from our
big picture view.
In nominal dollar terms, the BULL market in US Treasury Bonds
that began in the early 1980s will end by 2013. In real (gold)
terms, bonds commenced a secular BEAR market in 2001 that will continue
until 2014-2020. (Last
update: 23 January 2012)
The stock market, as represented by the S&P500 Index,
commenced
a secular BEAR market during the first quarter of 2000, where "secular
bear market" is defined as a long-term downward trend in valuations
(P/E ratios, etc.) and gold-denominated prices. This secular trend will bottom sometime between 2014 and 2020.
(Last update: 22 October 2007)
A secular BEAR market in the Dollar
began during the final quarter of 2000 and ended in July of 2008. This
secular bear market will be followed by a multi-year period of range
trading.
(Last
update: 09 February 2009)
Gold commenced a
secular bull market relative to all fiat currencies, the CRB Index,
bonds and most stock market indices during 1999-2001.
This secular trend will peak sometime between 2014 and 2020.
(Last update: 22 October 2007)
Commodities,
as represented by the Continuous Commodity Index (CCI), commenced a
secular BULL market in 2001 in nominal dollar terms. The first major
upward leg in this bull market ended during the first half of 2008, but
a long-term peak won't occur until 2014-2020. In real (gold) terms,
commodities commenced a secular BEAR market in 2001 that will continue
until 2014-2020.
(Last
update: 09 February 2009)
Copyright
Reminder
The commentaries that appear at TSI
may not be distributed, in full or in part, without our written permission.
In particular, please note that the posting of extracts from TSI commentaries
at other web sites or providing links to TSI commentaries at other web
sites (for example, at discussion boards) without our written permission
is prohibited.
We reserve the right to immediately
terminate the subscription of any TSI subscriber who distributes the TSI
commentaries without our written permission.
Outlook Summary
Market
|
Short-Term
(1-3 month)
|
Intermediate-Term
(6-12 month)
|
Long-Term
(2-5 Year)
|
|
Gold
|
Bullish
(17-Oct-12)
|
Bullish
(26-Mar-12)
|
Bullish
|
|
US$ (Dollar Index)
|
Neutral
(24-Dec-12)
|
Bullish
(01-May-13)
|
Neutral
(19-Sep-07)
|
|
Bonds (US T-Bond)
|
Bullish
(24-Jun-13)
|
Neutral
(18-Jan-12)
|
Bearish |
|
Stock Market
(DJW)
|
Bearish
(15-Jul-13)
|
Bearish
(28-Nov-11)
|
Bearish
|
|
Gold Stocks
(HUI)
|
Bullish
(24-Dec-12)
|
Bullish
(23-Jun-10)
|
Bullish
|
|
Oil |
Neutral
(30-Jul-12)
|
Neutral
(31-Jan-11)
|
Bullish
|
|
Industrial Metals
(GYX)
|
Neutral
(30-Jul-12)
|
Neutral
(29-Aug-11)
|
Neutral
(11-Jan-10)
|
Notes:
1. In those cases where we have been able to identify the commentary in
which the most recent outlook change occurred we've put the date of the
commentary below the current outlook.
2. "Neutral", in the above table, means that we either don't have a
firm opinion or that we think risk and reward are roughly in balance with respect to the timeframe in question.
3. Long-term views are determined almost completely by fundamentals,
intermediate-term views by
fundamentals, sentiment and technicals, and short-term views by sentiment and
technicals.
Coming up: A big week for
market-moving news
Price trends in major markets almost never
change in reaction to news. However, news events can certainly add to volatility
and how markets react to news can provide clues regarding the underlying trend
(a market in a bullish trend will often take bad news in stride while a bearish
market will tend to ignore good news). This coming week contains more than the
usual amount of potentially market-moving news events.
Here are the events to which we are referring:
1. On Wednesday 31st July we get the preliminary estimate of US GDP for the
second quarter. As an indicator of economic progress the GDP number is useless,
but the GDP estimate reported this week could provoke significant price changes
in the financial markets. This is due to the uncertainty regarding the Fed's
plans and the possibility that a very low number will be reported.
2. Also on Wednesday 31st July, the Fed will issue its next policy statement
following a 2-day FOMC meeting. Traders will look more closely than ever at the
Statement's wording in their efforts to determine the likely timing of the Fed's
'monetary tapering'.
3. On Thursday 1st August we get the monthly ISM manufacturing report for July.
In our opinion, the ISM manufacturing report is the best coincident indicator of
US economic performance.
4. On Friday 2nd August we get the next monthly US employment report. Employment
is very much a lagging economic indicator, but the employment numbers have an
outsized influence on the markets due to their influence on the Fed's monetary
machinations.
The US stock market has been almost comatose of late. That will probably change
this week, with one or more of the news events mentioned above acting as the
catalyst for greater volatility.
Uranium Update
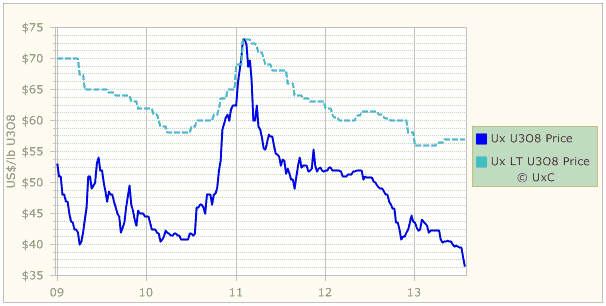
Considering that Japan's nuclear reactors will
probably soon start coming back on line and that the "Megatons to Megwatts"
program is scheduled to end a few months from now, it is strange that the spot
uranium price (the solid line on the following chart) has broken well below the
$40/pound level that acted as a floor for a long time. However, there two
encouraging signs for the bulls, the first being that the long-term contract
price (the dashed line on the following chart) has not confirmed the recent
breakdown in the spot price.
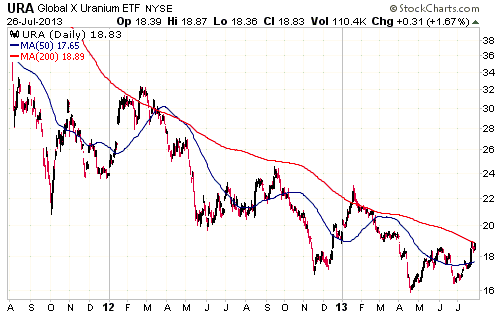
The second encouraging sign for the bulls is that uranium mining equities have
diverged positively from the uranium price over the past few months. As evidence
we point to the following daily chart of the Global X Uranium ETF (URA), a fund
that holds uranium mining stocks. Notice that URA bottomed in April, made a
higher low in June, and has just made a higher high on a short-term basis.
When commodity-related equities ignore a definitive upside or downside breakout
in the associated commodity, it tends to be significant.
The Stock
Market
The US
The Deutsche Bank G10
Currency Future Harvest Index reflects the return from investing long in
currency futures for G10 currencies with relatively high interest rates and
short in currency futures for G10 currencies with relatively low interest rates.
It is designed to exploit the fact that currencies trading with a forward
discount perform better, on average, than those trading at a forward premium.
DBV (Powershares DB G10 Currency Harvest Fund) is an exchange-traded fund that
tracks this index.
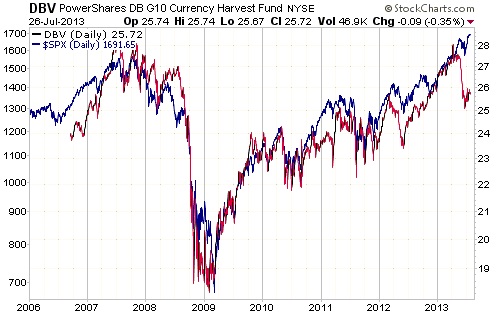
This brings us to the following chart comparison of DBV and the S&P500 Index
(SPX), the idea for which came from Eric Lamb, a Raymond James analyst.
The chart shows that since DBV's inauguration in late-2006 there has been a very
strong correlation between it and the SPX. We can't explain why, but the fact is
that these two very different entities have tracked each other closely for many
years and have never diverged for long. The recent unusually-large divergence
therefore suggests that one of two things will soon happen. Either there will be
a sharp pullback in the SPX or there will be a strong rally in DBV.
A strong rally in DBV will require high-yielding currencies such as the AUD and
the NZD making sizeable gains relative to low-yielding currencies such as the
EUR and the JPY. While we can't rule out such a currency-market development, we
think it's more likely that the DBV-SPX divergence will be closed by a decline
in the SPX.
Japan
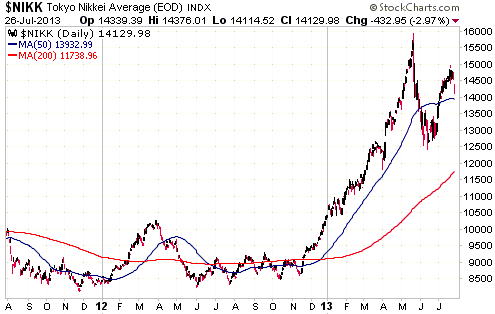
Japan's Nikkei225 Index touched 15,000 on Friday 19th July and then reversed
downward. Last week it built on the downward reversal and therefore added to the
evidence that a counter-trend rebound peaked on the 19th.
15,000 should now be viewed as an important demarcation level. Getting above
this level will invalidate our opinion that an intermediate-term correction
began in May and is on-going.
This week's
important US economic events
| Date |
Description |
| Monday Jul 29 |
Pending Home Sales Index
Dallas Fed Mfg Survey | | Tuesday
Jul 30 |
Case-Shiller Home Price Index
Consumer Confidence | | Wednesday
Jul 31 |
FOMC Announcement
Chicago PMI
Q2 GDP (prelim)
Employment Cost Index | | Thursday
Aug 01 |
ISM Manufacturing Index
Construction Spending
Motor Vehicle Sales
|
| Friday Aug 02 |
Monthly Employment Report
Personal Income and Spending
Factory Orders |
Gold and
the Dollar
Gold
Current Market Situation
In brief, here are the fundamental reasons why a sustained upturn in the gold
market could still be a few months away:
a) US economic data remain mixed (not good, but in general not bad). This is
keeping the hope alive that with some additional support from the Fed the
economy will 'pick up steam' in the near future.
b) Although the additional upside potential is small, the US stock market
probably hasn't yet reached its ultimate top.
c) US inflation expectations are low and are unlikely to rise by much over the
next few months.
d) The resumption of the euro-zone's debt/banking crisis is inevitable, but
doesn't appear to be imminent.
Note, though, that factors a), b) and d) could change with little warning, and
that it would probably take just one of these factors shifting decisively in
gold's favour to create the backdrop for a sustained upturn in the gold price.
Last week gold did what it was expected to do, which is rise to test resistance
at $1320-$1350. This price action is constructive for the long-term bullish
case, but doesn't indicate the most likely outcome over the coming 1-2 weeks.
Due largely to the short-term upside potential stemming from the sentiment
situation, our guess is that gold will rise to $1400-$1500 by early September.
However, "guess" is the operative word here. What we know with greater certainty
is that we will take some money off the table IF gold and gold-related
investments rally enough within the next 6 weeks to generate 'overbought'
readings on short-term momentum indicators.
Gold and the relative performance of the banking sector
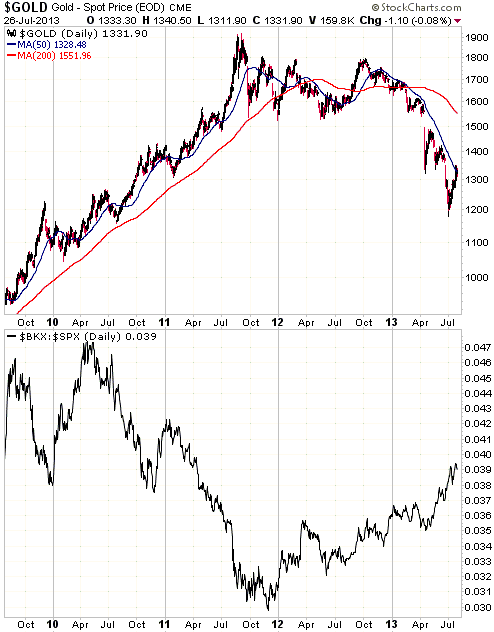
Anyone who understands the main fundamental drivers of gold's intermediate-term
price trend won't be surprised by the implication of the following chart. The
chart shows that on an intermediate-term basis, gold tends to trend in the
opposite direction to the BKX/SPX ratio (the Bank Index relative to the broad
stock market). In other words, the chart shows that gold tends to do well when
bank stocks are relatively weak and poorly when bank stocks are relatively
strong.
On a relative basis, bank stocks bottomed during the final few months of 2011
and have since been trending upward. This period of relative strength in the
banking sector has coincided with a major correction in the gold price.
Unfortunately, the BKX/SPX ratio doesn't work well as a real-time indicator of
intermediate-term trend changes in the gold market. This is partly because the
lead-lag relationship isn't consistent and partly because in real time there
won't be any way of differentiating the start of a short-term trend change from
the start of a longer-term trend change. Its usefulness is in showing what's
important to the gold market.
If the gold market is near the end of a major correction then the BKX/SPX ratio
should be close to a multi-year top.
Silver
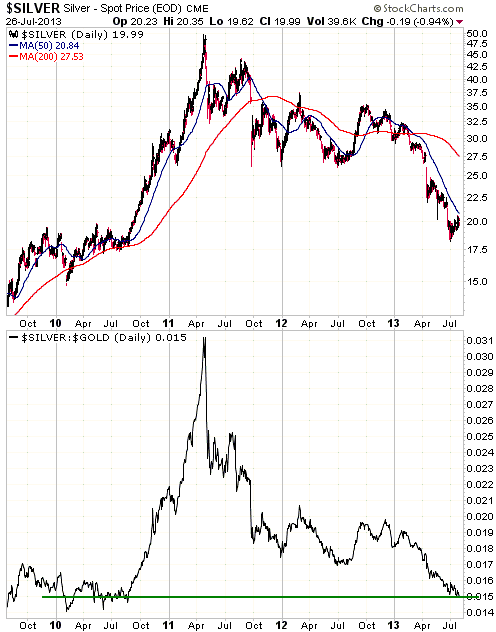
Gold and the gold-stock indices have signaled that a bottoming process has
begun, but silver hasn't yet done the same. The upper section of the following
daily chart shows that there isn't yet anything in silver's price action to
differentiate the current rebound from the counter-trend rebounds that occurred
over the past nine months.
Silver needs to close above $21.50 to signal the start of a major bottoming
process.
The lower section of the following chart shows that the silver/gold ratio has
retraced its entire 2010-2011 rally. This is not surprising, as spectacular
parabolic advances often get fully retraced. What is surprising is that the
relentless decline in the silver/gold ratio over the past 6 months has happened
in parallel with stock market strength. This is surprising because silver
normally performs better than gold during periods when the broad stock market is
strong.
One possible explanation for this year's unusual relationship between the
silver/gold ratio and the stock market is that while the US stock market has
been strong, many other stock markets around the world have either gone nowhere
or been weak. Another possible explanation is that the weakness in the
silver/gold ratio is warning of stock market weakness to come.
Gold Stocks
Interpreting the gold sector's long-term performance
The main reason that this year's huge decline in the gold-mining sector took us
by surprise is that we didn't seriously consider the possibility that a
major/primary correction began in September of 2011, and one of the main reasons
we didn't seriously consider this possibility was our belief that a primary
correction had happened as recently as 2008. It didn't seem realistic that there
would be a gap of only 3.5 years between the start of one primary correction and
the start of another primary correction, given that there were gaps of at least
6 years between the primary downturns during the preceding long-term bull
market. However, much of what has happened to the gold-mining sector over the
past several years makes sense if we assume that the 2008 downturn was NOT a
primary correction, but was, instead, a very steep intermediate-term decline.
If we make the aforementioned assumption, then:
1) The short duration of the 2008 correction makes sense (each of the two
primary corrections that occurred during the 1960s-1970s bull market lasted
about 2 years, whereas the 2008 correction lasted only 7.5 months).
2) The rapidity with which all of the 2008 losses were recouped makes sense
(during the 1960s-1970s bull market it took the gold-stock indices more than 3
years to fully recoup the losses suffered during a primary correction, but the
entire 2008 loss was wiped out in around 12 months).
3) The relative performances of gold bullion and the gold-mining sector make
sense. Here's what we mean: Given that gold bullion was back to its 2008 peak by
February of 2009, it is clear that in the gold bullion market the 2008 downturn
was nothing more than an intermediate-term decline. While it is not uncommon for
the gold-mining sector to diverge from the bullion market for short periods, the
major trends in the bullion market and the gold-mining sector of the stock
market should always be the same.
In a nutshell, a good argument can be made that the 2011-2013 downturn in the
gold-mining sector constitutes the FIRST primary correction of the long-term
bull market that commenced in November of 2000. In which case and as previously
noted in our 15th July commentary, it is more appropriate to compare 2011-2013
with 1968-1970 than with 1974-1976.
Here is an update of our chart comparing the percentage change in the HUI from
its 2011 peak (the blue line) with the percentage change in the Barrons Gold
Mining Index (BGMI) from its 1968 peak (the green line).
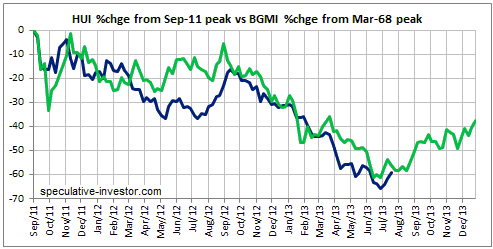
A literal interpretation of the chart displayed above would lead to the
conclusion that the HUI will consolidate over the next few weeks and then rally
to the 370s by year-end. However, money should never be put at risk based on
literal interpretations of chart comparisons such as this. The most reasonable
way to view this chart is as another piece of evidence that a primary
gold-sector correction is close to an end.
Current Market Situation
Large write-offs were announced by major gold producers Goldcorp (GG) and
Newmont Mining (NEM) last week. The stock market took this news in stride,
because large write-offs had already been factored into share prices when the
gold sector was bottoming in June.
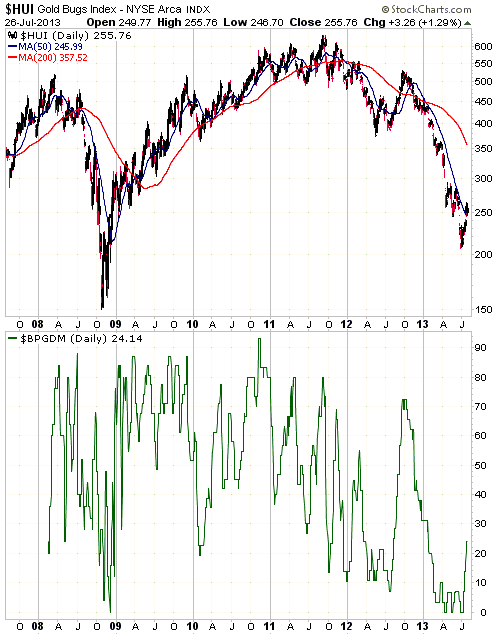
The upper section of the following chart shows the HUI and the lower section
shows the GDM Bullish Percentage (BPGDM). BPGDM is the percentage of stocks in
the Gold Miners Index that are on Point-and-Figure (P&F) buy signals.
The HUI broke above significant resistance at 245-250 last week. This is a sign
that a bottoming process has begun. Another sign that a bottoming process has
begun is the recent sharp rise in the BPGDM. Referring to the following chart,
notice that BPGDM had spent about five months oscillating between 0% and 10%
before surging above 20% last week.
The HUI's next resistance of significance is in the 290s. If this week's US
economic news is much worse than expected or if the FOMC announcement is more
'dovish' than expected then the HUI could rise as far as the 290s over the next
few days, but in the absence of a news-related upside catalyst there will
probably be some consolidation over the coming week or two.
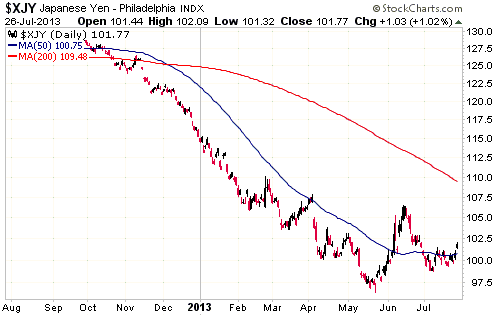
Currency Market Update
Last week's price action suggests that the Yen has resumed the rally that began
in May.
A rise to at least 110 within the next two months is a realistic possibility,
but in order for it to remain so the Yen should not close below its low of the
past two weeks.
Update
on Stock Selections
Notes: 1) To review the complete list of current TSI stock selections, logon at
http://www.speculative-investor.com/new/market_logon.asp
and then click on "Stock Selections" in the menu. When at the Stock
Selections page, click on a stock's symbol to bring-up an archive of
our comments on the stock in question. 2) The Small Stock Watch List is
located at http://www.speculative-investor.com/new/smallstockwatch.html
 Company
news/developments for the week ended Friday 26th July 2013: Company
news/developments for the week ended Friday 26th July 2013:
[Note: FS = Feasibility Study, IRR = Internal Rate of Return, MD&A =
Management Discussion and Analysis, M&I = Measured and Indicated,
NAV = Net Asset Value, NPV(X%) = Net Present Value using a discount
rate of X%, P&P = Proven and Probable, PEA = Preliminary Economic
Assessment, PFS = Pre-Feasibility Study]
*Almaden Minerals (AAU) reported results from the on-going
drilling at its 100%-owned Tuligtic project, Mexico. The 2013 drill
program is focused on expanding the resource immediately along
strike to known mineralisation, adjacent to the current resource
shell and within what is considered a potential pit shell. Just a
reminder that the Ixtaca Zone at the Tuligtic project is currently
estimated to contain 2.02M gold-equivalent (AuEq) ounces (960K
ounces of gold plus 55M ounces of silver) in the "Indicated"
category and 1.55M AuEq ounces (740K ounces of gold plus 42M ounces
of silver) in the "Inferred" category, for a total AuEq resource of
3.57M ounces.
Like the drilling results reported by AAU in May, the results
reported last week included some decent intercepts but nothing
exceptional. By far the best intercept reported last week was 119.5m
grading 1.0-g/t AuEq, but all other intercepts were under
50-gram-metres.
*Endeavour Mining (EDV.TO, EVR.AX) updated the market on its
progress and plans.
The company produced 75.4K ounces of gold during the June quarter
and reiterated its full-year guidance of 310K-345K ounces at a cash
cost of $840-$880/oz. The production run-rate is expected to
increase from 300K oz/year during the first half of this year to
330K-360K oz/year during the second half of this year and to well
over 400K oz/year in 2014. The increase in the second half of this
year will be due to the Tabakoto mill expansion and next year's
further increase will be due to the Agbaou mine coming into
production. Agbaou will be EDV's fourth operating mine in West
Africa.
Next year's all-in cost of production is expected to be around
$1000/oz, which means that EDV should be strongly cash-flow positive
over the next 12 months at any gold price above $1200/oz.
Also worth noting is that EDV has negotiated an increase in its
revolving credit facility from $200M to $350M. This should ensure
that the company will have plenty of financial breathing room even
if the market environment remains difficult.
At an operating level EDV continues to perform as well as or better
than expected. In our opinion, at current prices EDV is the best
candidate for new buying within the gold sector.
*Energy Fuels (EFR.TO), a junior uranium producer, advised that
Korea Electric Power Corporation ("KEPCO"), South Korea's largest
electric utility and the largest single shareholder of both EFR and
Strathmore Minerals (STM.TO), has confirmed that it will vote in
favour of the EFR-STM merger at next month's shareholder meetings.
This makes it very likely that the merger will happen.
As we said in May when it was first announced, we view the EFR-STM
merger as neutral for EFR shareholders. EFR will get some good
assets, but at this stage of their development the assets being
acquired will consume cash at a time when cash conservation is
paramount.
*Lydian International (LYD.TO) was within 5% and probably just a
couple of weeks of completing the updated FS for its Amulsar gold
project in Armenia, when the Armenian government threw a spanner
into the works.
According to a LYD press release last Wednesday, the Armenian
Government has just passed a resolution that modifies the area
defined as the "catchment basin" to Lake Sevan, Armenia's largest
freshwater lake. This Resolution expands the borders of the
catchment basin to include the currently proposed location for LYD's
heap leach processing facility. Furthermore, the Resolution states
that this part of the "catchment basin" is to be classified as the
"Immediate Impact Zone" to Lake Sevan, which impacts LYD's plans as
mineral processing activities are not permitted in the "Immediate
Impact Zone".
The company doesn't yet know exactly how the above-mentioned change
will affect the Amulsar project, other than causing a delay to the
completion of the FS. The government has invited LYD to participate
in a "working group" to review the new requirements as well as the
Amulsar project's Environmental and Social Impact Assessment. This
working group is expected to convene next week "with a view to
reaching a conclusion in an expeditious manner". When questioned in
last Thursday's
conference call as to what "expeditious manner" could reasonably
be expected to mean, Tim Coughlin, LYD's CEO, said that end-August
was the target. We think that getting a satisfactory resolution by
end-August should be viewed as the best-case scenario.
The upshot is that the future of the Amulsar project has just become
more uncertain. The project appears to have excellent economics at a
gold price of only $1200/oz, but the government is certainly capable
of making it uneconomic by imposing costly restrictions on mine
development.
We suspect that this issue will be sorted out within the next three
months without major drama and wouldn't sell LYD shares at the
current price, but it would be prudent to hold off on new buying
pending more information. Fortunately, the company has about $25M of
cash and therefore shouldn't need additional funding prior to
completing the FS and receiving all required permits.
*Pilot Gold (PLG.TO) reported more good drilling results from the
KCD Target at its TV Tower project (Turkey), including 15.3 g/t gold
over 45.2m (mostly contained within a 1.5m section grading 386 g/t)
from step-out drilling and 2.6 g/t gold over 56.5m from in-fill
drilling.
As we noted last week, there will be a steady stream of drilling
news from PLG to draw the market's attention over the next few
months.
*Pretium Resources (PVG) announced another set of results from the
underground drilling being carried out as part of its bulk sample
program. As usual there were spectacular grades among the reported
gold intercepts.
It is fair to say that the underground drilling continues to do what
it is supposed to do, which is verify the resource model.
PVG also announced the results of drilling carried out to test the
extension of the high-grade Cleopatra vein discovered late last
year. Once again there were some spectacular gold intercepts,
including 4,030 g/t over 0.5m in Hole VU-032 and 27,000 g/t over
0.5m in Hole VU-053.
The drilling results from the Cleopatra vein suggest that there is
plenty of potential to expand the high-grade underground resource.
Additional exploration to test this potential will be done over the
months ahead in parallel with the bulk sample program.
*Sabina Gold and Silver (SBB.TO) announced a new set of drilling
results from the "Goose" claim at its Back River project, northern
Canada. The results were generally good, with a few exceptional gold
intercepts such as 19.27 g/t over 18.60m in hole 13GSE337 and 24.13
g/t over 21.85m in hole 13GSE340.
The main purpose of the drilling was to confirm resource continuity
within the proposed pits and convert resources from the Indicated to
the Measured category. In this respect it was almost certainly
successful.
 Candidates
for new buying Candidates
for new buying
From within the ranks of TSI stock selections, the best candidates for new
buying at this time are:
- EDV.TO/EVR.AX
- PG.TO, ideally following a pullback to around C$2.05
- RIO.TO/RIOM, ideally following a pullback to around C$2.10
- SBB.TO
Chart Sources
Charts appearing in today's commentary
are courtesy of:
http://stockcharts.com/index.html

|

