|
-- Weekly Market Update for the Week Commencing 29th August 2011
Big Picture
View
Here is a summary of our big picture
view of the markets. Note that our short-term views may differ from our
big picture view.
In nominal dollar terms, the BULL market in US Treasury Bonds
that began in the early 1980s ended in December of 2008. In real (gold)
terms, bonds commenced a secular BEAR market in 2001 that will continue
until 2014-2020. (Last
update: 4 April 2011)
The stock market, as represented by the S&P500 Index, commenced
a secular BEAR market during the first quarter of 2000, where "secular
bear market" is defined as a long-term downward trend in valuations
(P/E ratios, etc.) and gold-denominated prices. This secular trend will bottom sometime between 2014 and 2020. (Last update: 22 October 2007)
A secular BEAR market in the Dollar
began during the final quarter of 2000 and ended in July of 2008. This
secular bear market will be followed by a multi-year period of range
trading. (Last
update: 09 February 2009)
Gold commenced a
secular bull market relative to all fiat currencies, the CRB Index,
bonds and most stock market indices during 1999-2001. This secular trend will peak sometime between 2014 and 2020. (Last update: 22 October 2007)
Commodities,
as represented by the Continuous Commodity Index (CCI), commenced a
secular BULL market in 2001 in nominal dollar terms. The first major
upward leg in this bull market ended during the first half of 2008, but
a long-term peak won't occur until 2014-2020. In real (gold) terms,
commodities commenced a secular BEAR market in 2001 that will continue
until 2014-2020. (Last
update: 09 February 2009)
Copyright
Reminder
The commentaries that appear at TSI
may not be distributed, in full or in part, without our written permission.
In particular, please note that the posting of extracts from TSI commentaries
at other web sites or providing links to TSI commentaries at other web
sites (for example, at discussion boards) without our written permission
is prohibited.
We reserve the right to immediately
terminate the subscription of any TSI subscriber who distributes the TSI
commentaries without our written permission.
Outlook Summary
Market
|
Short-Term
(0-3 month)
|
Intermediate-Term
(3-12 month)
|
Long-Term
(1-5 Year)
|
| Gold
|
Neutral
(19-Apr-11) |
Neutral
(24-Jan-11)
|
Bullish
|
| US$ (Dollar Index)
|
Neutral
(10-Aug-11)
| Neutral
(10-Aug-11)
|
Neutral
(19-Sep-07)
|
| Bonds (US T-Bond)
|
Bearish
(24-Aug-11)
|
Bearish
(24-Aug-11)
|
Bearish
|
| Stock Market (S&P500)
|
Neutral
(08-Aug-11)
|
Neutral
(24-Aug-11)
|
Bearish
|
| Gold Stocks
(HUI)
|
Neutral
(13-Jul-11) |
Bullish
(23-Jun-10)
|
Bullish
|
| Oil | Neutral
(31-Jan-11) | Neutral
(31-Jan-11)
| Bullish
|
| Industrial Metals
(GYX)
| Neutral
(29-Aug-11)
| Neutral
(29-Aug-11)
| Neutral
(11-Jan-10)
|
Notes:
1. In those cases where we have been able to identify the commentary in
which the most recent outlook change occurred we've put the date of the
commentary below the current outlook.
2. "Neutral", in the above table, means that we either don't have a
firm opinion or that we think risk and reward are roughly in balance with respect to the timeframe in question.
3. Long-term views are determined almost completely by fundamentals,
intermediate-term views by giving an approximately equal weighting to
fundamental and technical factors, and short-term views almost
completely by technicals.
Decade Cycle Update
There is a strong tendency for at least one of the major trends of a decade to make a trend-ending blow-off move during the final few months of the '9' year or the first half of the '0' year. During the second half of 2009 and the first half of 2010 we discussed this phenomenon and attempted to identify the best candidates for major trend reversals. It was a stretch, though, because at that time there were no powerful decade-long trends that met all the criteria for a trend-ending speculative blow-off. Given the price action of the past few months, we are now wondering if the most recent "decade cycle" has been extended by 1-2 years.
Unlike the final few months of 2009 and the first half of 2010, April-August of this year has contained blow-offs in a number of trends that began during the first two years of the last decade. The most notable have been the upside blow-offs in gold, silver and the Swiss Franc (SF). We explained in last week's Interim Update why gold's long-term bull market is probably not experiencing its 'final fling', and if gold is destined to make new all-time highs over the years ahead then so is silver. That leaves the SF.
A long-term chart of the SF/US$ exchange rate is shown below. The chart has an inverted scale, which means that the line on the chart falls when the SF strengthens against the US$. The chart certainly has the look of a major blow-off, in that the exchange rate recently blew through the bottom of a 40-year downward-sloping channel and plummeted in almost straight-line fashion before reversing upward over the past couple of weeks.
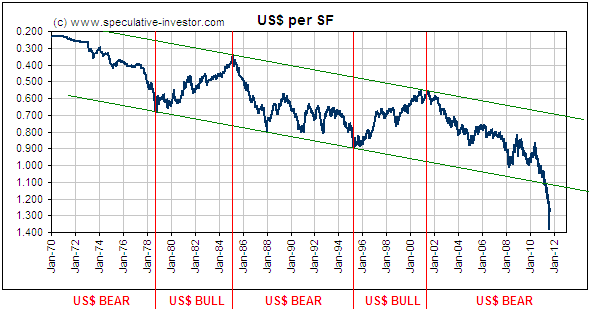
It could be years before we know for sure if a major trend change in the SF/US$ exchange rate occurred in August of 2011. What we can say right now is that all the ingredients needed for a long-term reversal are in place.
The Alternate CPI
The CPI calculated by Shadow Government Statistics
(SGS), also known as Shadowstats, has become a popular way of expressing the decline in the US dollar's purchasing power, especially amongst commodity bulls. However, we have warned in the past that the CPI calculation is not an appropriate measure of the change in purchasing power, regardless of whether the calculation is done by the US government or a private entity. Moreover, after recently being prompted by one of our readers to delve a little deeper into the methodology used by SGS, we are now convinced that the SGS CPI is no more credible than the bogus number reported each month by the government.
Despite the way it is often portrayed, the SGS CPI is not a calculation of the CPI using the methodology of the 1980s. There are substantial differences between the way the CPI was calculated in the 1980s and the way it is calculated today, and doing the actual calculation as it was done during the 1980s would require a massive data collection effort every month. It is reasonable to assume that SGS does not have the resources to carry out this exercise.
A big clue as to what SGS does is provided by the following chart-based comparison of the SGS CPI (the blue line) and the official CPI (the red line). Notice that a) every squiggle in the red line is mimicked by a similar squiggle in the blue line, b) regardless of what is happening in the world, the percentage change in the SGS CPI is always higher than the percentage change in the official CPI, and c) since 1997, the annual rate of change in the SGS CPI has always been 6%-9% higher than the annual rate of change in the official CPI.
Clearly, the rate of change in the SGS CPI is calculated by taking the official CPI and adding 6%-9% to it. The percentage addition is apparently an estimate of the effects of various changes, the main one being the change from arithmetic to geometric weighting*.
When you take a bogus number and add a percentage to it, the end result will simply be a higher bogus number.
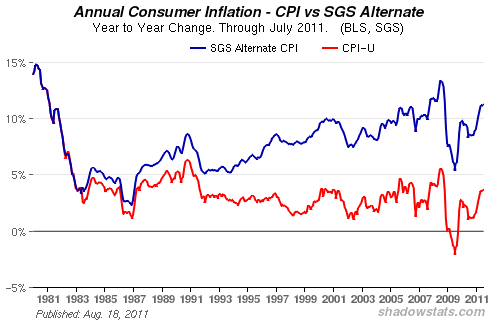
The real rate of decline in the US dollar's purchasing power can't be measured. However, by using the change in money supply and adjusting for the effects of productivity and population growth we estimate that reality lies somewhere between the official rate and the SGS rate. The official rate is too low and the SGS rate is too high.
*Note that SGS does not claim that its "Alternate CPI" is anything other than what it is: the current CPI with a 'guesstimated' addition to reflect the effects of changes to calculation methodology.
Commodities Update
Despite the recent carnage in global equity markets, the decline in the Continuous Commodity Index (CCI) currently looks more like a routine consolidation than the first leg of a new bear market. As illustrated below, the CCI's August low was only marginally below its June low. Also, since bottoming with the stock market earlier this month the CCI has rebounded to above its 50-day and 200-day moving averages.
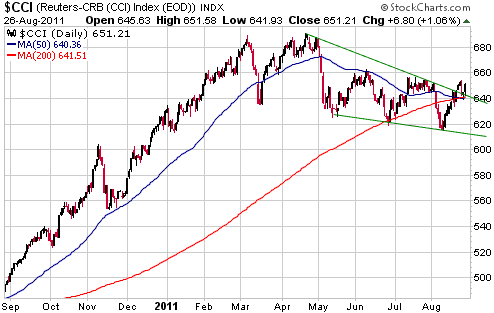
We confess that the CCI's resilience has surprised us. Considering the shift away from risk that occurred over the past few months, we would have expected non-monetary commodities to be a lot weaker.
The next chart reflects the performance of the industrial metals complex. Industrial metals were naturally among the commodities most adversely affected by August's stock market plunge, but even here the damage has been less than dramatic.
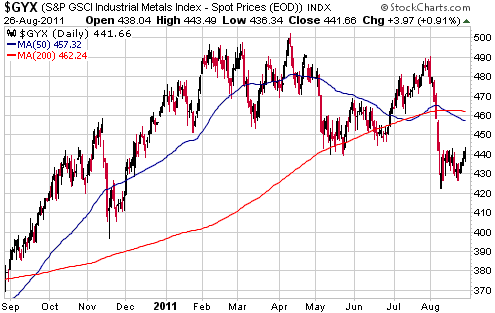
The industrial metals, as a group, usually trend with the stock market. In recognition of a) the evidence that the stock market has successfully tested its low of 8-9 August and b) the recent acceleration in the growth rate of US money supply, we are upgrading our short- and intermediate-term outlooks for industrial metals from "bearish" to "neutral".
The Stock
Market
There will always be significant differences between the current market and the same market during an earlier period, but when considering various scenarios it is natural to look for similarities between current and past market action. Recently there has been a lot of discussion about the similarities between the current situation and the situation in Q3 of 2008, but it may be more appropriate to compare today with August of 2007. Recall that there was a sharp stock market decline during July-August of 2007 as problems in the world of sub-prime mortgage finance rose to the surface, after which there was a multi-month rebound that resulted in the senior US stock indices testing their June-July highs. A major bear market then got underway.
That being said, there are also many differences between now and August-2007.
Instead of relying on the market situation evolving in accordance with a predetermined pattern, it is better to remain flexible and rely on real-time analysis. Currently, there are some good reasons to be bearish and we are headed into a part of the year that has had more than its fair share of stock market disasters, but price action and sentiment indicators suggest that the low for the year could already be in place.
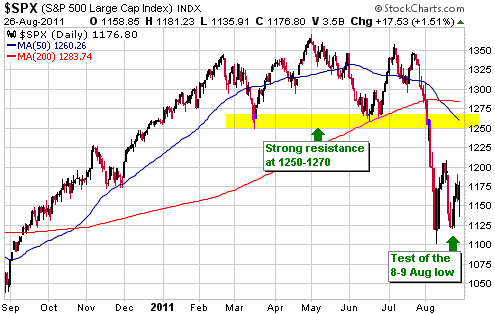
Note that even if the low for the year is in place, there doesn't appear to be much upside potential. As indicated on the following daily chart, the S&P500 Index has strong resistance at 1250-1270. We suspect that this resistance will cap any rally over the next few months.
Bernanke's speech on Friday led to some big swings in the markets, but he didn't really say much. He spouted some Keynesian hogwash (he warned Congress not to cut back on spending while the economy is weak, evidently oblivious to the fact that excessive government spending is a big part of the problem), but didn't make any veiled promises about future QE.
This week's
important US economic events
| Date |
Description |
| Monday Aug 29 | Personal
Income and Spending
Pending Home Sales
| | Tuesday
Aug 30 | Consumer Confidence
Case-Shiller Home Price Index
FOMC Minutes | | Wednesday
Aug 31 | Chicago PMI
Factory Orders | | Thursday
Sep 01 | ISM Manufacturing Index
Motor Vehicle Sales
Construction Spending
Labour Productivity and Costs
| | Friday Sep 02 | Employment
Situation
|
Gold and
the Dollar
Gold and Silver
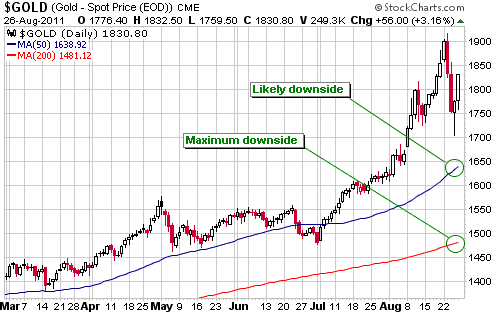
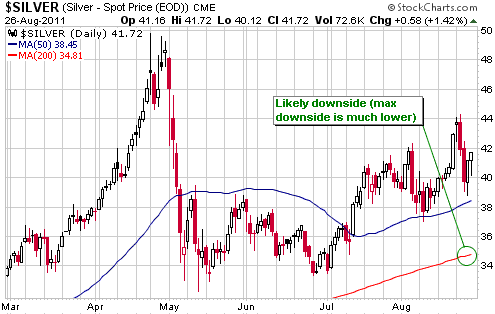
The gold price plunged $150/oz over Tuesday-Wednesday of last week. During the early part of Thursday's US trading session it quickly fell an additional $50, creating a good opportunity to take profits on hedges purchased to protect against a sharp decline. It then rebounded into the end of the week.
We can't rule out the possibility that last week's plunge was "all she wrote", but the rebound that began on Thursday morning is probably a counter-trend move within the context of a new short-term or intermediate-term correction. Reasonable downside targets for the correction are noted on the charts displayed below.
As things currently stand, we would view a rise to around $1850 as a new opportunity to do some selling or establish a hedge position.
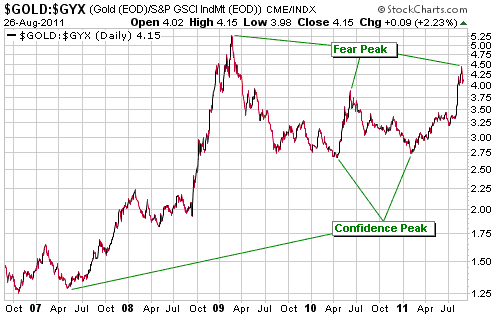
Below is a chart that shows how the gold/GYX ratio (gold versus a basket of industrial metals) has performed over the past 5 years. Intermediate-term peaks in this ratio represent peaks in fear (troughs in confidence), whereas intermediate-term bottoms in this ratio represent peaks in confidence (troughs in fear). It's too early to be sure, but it is possible that we have just witnessed an intermediate-term peak in fear. If this is the case then the industrial metals will strengthen relative to gold over the months ahead.
Alternatively, if gold/GYX moves to a new high for the year it will suggest that the market-wide shift away from risk that began in February of this year and accelerated in August is still in progress. Such a development would point to substantial additional weakness in the broad stock market.
Gold Stocks
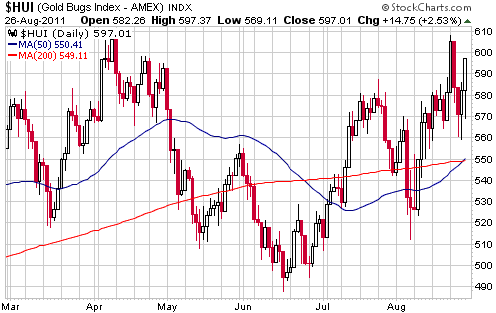
Last week's HUI performance was characterised by large daily swings. The net result of all the swings was a modest advance over the course of the week.
In its current position near the top of a 10-month trading range, the HUI has a lot of short-term upside potential and downside risk. Specifically, if the HUI could sustain a break above resistance at 610 then 700-720 would become a likely target over the ensuing few months, but failure to make a new high within the next several days could lead to a downward trend that took the HUI back to near the bottom of its range (490-510).
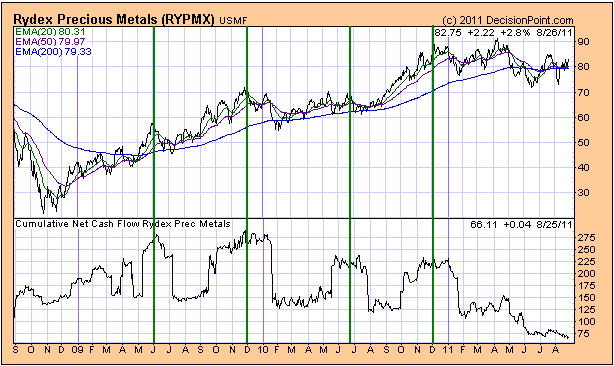
In the HUI's favour is the general lack of speculative interest in gold mining shares. This lack of interest is reflected by the following chart, which shows that the cumulative net cash flow into the Rydex Precious Metals Fund -- a mutual fund that invests in gold and silver mining shares -- is languishing at a 3-year low.
On the negative side of the ledger is the likelihood that gold bullion has just commenced a correction.
A false belief held by many investors/speculators is that figuring out when to buy or sell involves accurate short-term forecasting. The reality, however, is that consistently achieving good returns requires no short-term forecasting whatsoever. In fact, if your strategy relies on being able to consistently predict short-term price direction then you will probably end up under-performing, because the strategy you are trying to implement is based on the impossible.
When figuring out when to buy or sell, you don't even need to have an opinion on the likely direction of prices in the short-term. Actually, a strong opinion about short-term price direction can be dangerous because it can prevent you from making the appropriate buy/sell decision. What you need is a good understanding of the big picture, the ability to move in the opposite direction to the herd after the herd has accelerated in one direction, and patience. Patience is important, because without it you will tend to buy or sell too much too soon. To paraphrase a famous value investor, the market constantly pitches at you and you never have any obligation to swing. You can wait as long as you want, safe in the knowledge that there will always be more pitches -- some of which are bound to be 'juicy' -- in the future.
Currency Market Update
The Dollar Index continues to move back and forth within a narrow range. It ended last week near the bottom of its range.
If the stock market has bottomed and is set to retrace some its recent losses over the next couple of months, then a downside breakout by the Dollar Index would be likely. However, if the stock market is headed for a September-October calamity then we should soon see a definitive reversal in the Dollar Index followed by a strong upward trend.
Due to the currency-suppressing efforts of almost all central banks, a downside breakout by the Dollar Index in the near future would probably not be followed by a substantial decline. To put it another way, a dollar breakdown in the near future would very likely prompt many central banks to become more aggressive in their efforts to devalue their own currencies, thus limiting the dollar's downside.
Update
on Stock Selections
Notes: 1) To review the complete list of current TSI stock selections, logon at
http://www.speculative-investor.com/new/market_logon.asp
and then click on "Stock Selections" in the menu. When at the Stock
Selections page, click on a stock's symbol to bring-up an archive of
our comments on the stock in question. 2) The Small Stock Watch List is
located at http://www.speculative-investor.com/new/smallstockwatch.html
 Hathor Exploration (TSX: HAT). Recent price: C$3.88 Hathor Exploration (TSX: HAT). Recent price: C$3.88
In May, we wrote:
"HAT is the highest quality and lowest risk exploration-stage uranium stock that we know of. The high grade of its Saskatchewan-based Roughrider deposit means that the deposit will likely be attractive to larger mining companies even in the unlikely event that the uranium price fails to recover from the hit it took in response to Japan's recent "nuclear emergency"."
HAT jumped 45% to a 3-year high on Friday in response to an announcement that a larger mining company (Cameco) was planning to make a C$3.75/share takeover bid. The stock traded as high as C$3.99 and closed at C$3.88, so the market is obviously anticipating a higher bid. However, in the current dicey market environment we are happy to make a complete exit immediately and forego the potential for additional upside. The gain, based on our January-2011 entry price, was 52%.
 The most under-valued gold producers The most under-valued gold producers
Based on the amount at which the market is valuing current production, Dragon Mining (ASX: DRA) and Gold-Ore Resources (TSX: GOZ) are the two most under-valued gold producers in the TSI Stocks List. Both miners are being valued by the market at less than 1-times annual revenue, which is extraordinarily low for a gold producer. Interestingly, both operate in Scandinavian countries.
The relatively low valuations assigned to these companies stem in part from their small scale (the annual production rates of DRA and GOZ are 65K-ounces and 45K-ounces, resp.). All else being equal, a gold mining company producing 50K ounces/year will have a significantly lower valuation than one producing 250K ounces/year. However, the valuations appear to be unreasonably low even after taking company size into account, especially considering that both companies have been profitable over the past year and look set to be very profitable over the next few quarters.
Market sentiment is most likely the main reason for the unusually low valuations being assigned to the current gold production of DRA and GOZ. There has been minimal interest in gold mining stocks over the past 5 months, despite the strength in the bullion market. As discussed in earlier TSI commentaries, this is probably due to the general shift away from risk. This market-wide shift has affected the entire gold sector, but the effect has naturally been most pronounced at the junior end of the sector.
Charts of DRA.AX and GOZ.TO are shown below. Daily closes above A$1.50 for DRA and C$0.90 for GOZ would indicate that the lengthy consolidations had ended.
Both stocks are good candidates for accumulation near current prices.
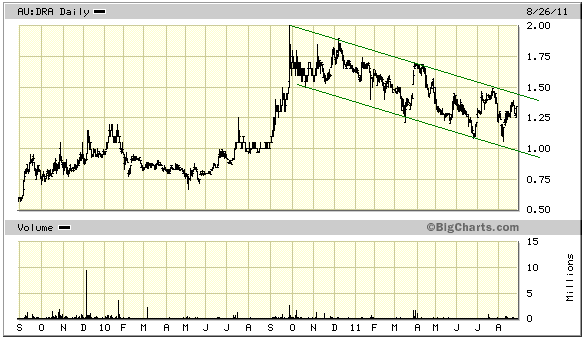
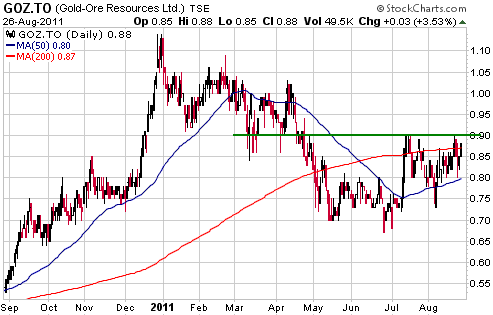
Chart Sources
Charts appearing in today's commentary
are courtesy of:
http://stockcharts.com/index.html
http://bigcharts.marketwatch.com/

|

