|
-- Weekly Market Update for the Week Commencing 29th October 2007
Big Picture
View
Here is a summary of our big picture
view of the markets. Note that our short-term views may differ from our
big picture view.
Bonds commenced a secular BEAR market in
June of 2003. (Last
update: 22 August 2005)
The stock market, as represented by the S&P500 Index, commenced
a secular BEAR market during the first quarter of 2000, where "secular
bear market" is defined as a long-term downward trend in valuations
(P/E ratios, etc.) and gold-denominated prices. This secular trend will bottom sometime between 2014 and 2020. (Last update: 22 October 2007)
The Dollar commenced a secular BEAR market during the final quarter of 2000. The
first major downward leg in this bear market ended during the first
quarter of 2005, but a long-term bottom won't occur until 2008-2010. (Last update: 28 March 2005)
Gold commenced a
secular bull market relative to all fiat currencies, the CRB Index,
bonds and most stock market indices during 1999-2001. This secular trend will peak sometime between 2014 and 2020. (Last update: 22 October 2007)
Commodities, as
represented
by the CRB Index, commenced a secular BULL market in 2001. The first
major upward leg in this bull market ended during the second quarter of
2006, but a long-term
peak won't occur until at least 2008-2010. (Last update: 08 January 2007)
Copyright
Reminder
The commentaries that appear at TSI
may not be distributed, in full or in part, without our written permission.
In particular, please note that the posting of extracts from TSI commentaries
at other web sites or providing links to TSI commentaries at other web
sites (for example, at discussion boards) without our written permission
is prohibited.
We reserve the right to immediately
terminate the subscription of any TSI subscriber who distributes the TSI
commentaries without our written permission.
Outlook Summary
Market
|
Short-Term
(0-3 month)
|
Intermediate-Term
(3-12 month)
|
Long-Term
(1-5 Year)
|
Gold
|
Neutral
(15-Oct-07)
|
Neutral
(15-Aug-07)
|
Bullish
|
US$ (Dollar Index)
|
Bullish
(11-Jun-07)
| Bullish
(31-May-04)
|
Neutral
(19-Sep-07)
|
Bonds (US T-Bond)
|
Bullish
(22-Oct-07)
|
Neutral
(23-Jul-07)
|
Bearish
|
Stock Market (S&P500)
|
Neutral
(29-Oct-07)
|
Neutral
(26-Mar-07)
|
Bearish
|
Gold Stocks (HUI)
|
Neutral
(29-Oct-07)
|
Neutral
(15-Aug-07)
|
Bullish
|
| Oil | Bearish
(23-July-07)
| Bearish
(22-Oct-07)
| Bullish
|
Industrial Metals (GYX)
| Bearish
(11-Jun-07)
| Bearish
(09-July-07)
| Bullish
|
Notes:
1. In those cases where we have been able to identify the commentary in
which the most recent outlook change occurred we've put the date of the
commentary below the current outlook.
2. "Neutral", in the above table, means that we either don't have a
firm opinion on which way the market will move or that we expect the
market to be trendless during the timeframe in question.
3. Long-term views are determined almost completely by fundamentals,
intermediate-term views by giving an approximately equal weighting to
fundmental and technical factors, and short-term views almost
completely by technicals.
Fed Speculation
The strong 10-week rallies in
gold, gold stocks, oil, the Hong Kong stock market, some NASDAQ100
components, emerging market equities and ocean shipping rates (the
Baltic Dry Index) are all linked: to weakness in both the US$ and the
Yen relative to the euro. The rubber band appears to have been
stretched almost to the breaking point as representatives of the US
Monetary Politburo (the Fed) get ready to meet. The official results of
their meeting will be announced to the world on Wednesday afternoon.
A 0.25% rate cut is 'baked into the cake' in that almost everyone
expects the official interest rate target to be reduced by at least
this amount. If the markets that have been moving relentlessly higher
over the past couple of months stay on their upward paths during the
first half of this week then they will probably pull back if the Fed
does no more than cut by the widely anticipated amount, but there
really shouldn't be a big reaction to a 0.25% cut. However, there will
almost certainly be a big reaction if the Fed does anything other than
cut by 0.25%.
Given what has happened to the prices of gold and oil since the Fed
last surprised the markets with a larger-than-expected rate cut we find
it hard to believe that Bernanke and Co. will do the same again.
Although a 0.50% rate cut might appear to be justified based on what's
happening in the US housing market, cutting by this amount would be an
act of monumental stupidity because it would be more likely to hurt
than help this downtrodden sector of the US economy. The reason is that
the resultant additional gains in gold and oil prices would put
downward pressure on the bond market, thus pushing bond yields (and
mortgage payments) upward.
We also find it hard to believe that Bernanke and Co. will leave the
official interest rate unchanged because it should be clear to them
that doing so would cause the stock market to plunge.
Our view is that the Fed will do the expected (cut by 0.25%), prompting
sell-the-news pullbacks in the markets that have recently been strong.
The Stock
Market
The Dichotomy
Valuations in the US stock market are generally nowhere near as
stretched today as they were when the great 'NASDAQ bubble' was
approaching its peak during the first quarter of 2000, but in one
respect the current situation is similar in that there are huge
disparities between the performances of different sectors of the
market. Back in 1999-2000 a mania was underway in stocks related to
tech, telecom and the internet (the so-called "new economy" stocks)
while stocks considered representative of the "old economy" languished.
This disparity was subsequently corrected in spectacular fashion
between March of 2000 and October of 2002.
The current disparity involves the bidding-up of some stocks/sectors as
if several years of rapid growth lay ahead of us, and the simultaneous
shunning or selling of other stocks/sectors as if the economic future
were guaranteed to be sub-par. For example, Research In Motion (RIMM),
a maker of mobile communication devices, just became Canada's largest
company by market capitalisation thanks to being valued at a
mind-boggling 78-times earnings and 15-times revenue. It could
reasonably be argued that RIMM should be valued far more highly than,
say, loss-making homebuilders or companies heavily involved in the
trouble-infested mortgage industry, but why should it trade at 5-times
the valuation of Texas Instruments (TXN)? TXN recently announced
financial results that were below the market's expectations, but TXN's
profit margins are similar to those of RIMM. Furthermore, TXN makes the
chips that go into mobile communication devices and is, in effect,
serving the same consumer demand as RIMM.
Another good example of the current valuation dichotomy within the
stock market can be found by comparing Amazon.com (AMZN) with Walmart
(WMT). AMZN's valuation is MUCH lower today than it was back in
1999-2000, but it is still nonsensical. AMZN is a mid-sized low-margin
retailer getting valued by the stock market as if it were a tech stock
with Microsoft-like profit margins and market share. In fact, in
valuation terms AMZN trades at a 500% premium to the world's leading
retailer (WMT) despite having LOWER profit margins than the market
leader. If WMT deserves to trade at a low valuation on the basis that
high energy prices and the downturn in the housing market are going to
crimp its growth, then so does AMZN.
Today's valuation dichotomy is more complicated than the one that
existed near the peak of the NASDAQ bubble. Back then the market drew a
clear line between the so-called "old economy" and "new economy"
sectors, with moderate valuations automatically being assigned to the
former and stratospheric valuations automatically being assigned to the
latter. There's now a lot more inconsistency, with fewer stocks being
assigned the stratospheric valuations and these speculative favourites
being more unevenly spread through the market. As a result, some stocks
look as risky now as they did back in the halcyon days of the
tech/telecom/internet bubble, but the overall market risk appears to be
a lot lower.
So, would we be looking to go 'short' the current speculative
favourites -- stocks such as RIMM, AMZN and GOOG -- that have been
bid-up to absurd levels? The answer is no; not unless we had good
reason to believe that a stock priced for spectacular growth was about
to report an unexpected decline in its growth rate. Something to bear
in mind is that reality always wins-out in the long run, but in the
short run it's the combination of perception and sentiment that matters
most; and when the stock market gets the 'bit between its teeth'
there's no telling how high is too high.
Instead of shorting the current speculative favourites we would be more
inclined to look for opportunities to go 'long' the stocks with
catch-up potential. We are thinking, here, of stocks such as MSFT and
INTC -- stocks that are certainly not under-valued in absolute terms
but are at bargain-basement levels relative to the current favourites.
Current Market Situation
In last week's Interim Update we noted that Wednesday's capitulation in
response to Merrill Lynch's $8B write-down in the value of its
mortgage-related securities had the look of a selling climax and,
therefore, that the financial sector of the market was probably close
to a short-term bottom. Friday's 8.5% rise in Merrill Lynch (MER) and
32% moon-shot in Countrywide Financial (CFC) lend some support to this
idea. We are mindful of the fact that bear markets tend to be littered
with very sharp 1-2 day rallies, but the stock market has spent the
bulk of this year factoring the mortgage mess into the prices of
financial stocks so unless the news backdrop quickly becomes even worse
then the downward pressure on these stocks could abate for a while.
The financial sector's recent selling climax is one positive. Another
is the marked improvement in the sentiment backdrop over the past two
weeks, as evidenced by: 1) a substantial shift in the put/call
situation (after generating a sell signal just two weeks ago our
put/call indicator is already close to generating a buy signal); and 2)
a plunge in the bull/bear ratio reported by the American Association of
Individual Investors from a 6-month high to a 6-month low over just the
past two weeks.
On the "risk" side of the ledger, the current market situation remains
dicey because while the stocks that have been relatively weak -- the
financial and homebuilding stocks, in particular -- are showing signs
of bottoming, the relatively strong stocks and markets are extremely
extended. Hong Kong's Hang Seng Index (HSI) and the Emerging Markets
ETF (EEM) are good proxies for these relative strength leaders, and
both closed at new all-time highs on Friday so the trends have clearly
not YET reversed. However, the market action during the first two days
of last week was indicative of how things can 'turn on a dime' in the
leading equity sectors in response to fairly minor moves in the
currency market (the HSI plunged 1000 points last Monday in conjunction
with a bounce in the Yen and then shot upward to the tune of 1000
points on Tuesday in conjunction with Yen weakness).
Due to the likelihood of some stabilisation in the financial sector and
the improved sentiment backdrop it is not appropriate for us to
maintain a short-term bearish stance, but the significant on-going risk
that an upward reversal in the Yen could bring about dramatic weakness
in the sectors/markets that have led the rally from the August lows
prevents us from being bullish. We have therefore shifted to the
sidelines.
A reasonable risk management strategy for traders who are 'long' the
leading stocks/sectors might be to remain long unless last week's lows
-- 28,336 in the case of the HSI -- are taken out on a daily closing
basis.
Update on the Airline Trade
The following chart compares the performances of the AMEX Airline Index (XAL) and the oil price over the past 12 months.
The most important determinant of the airline sector's trend is the
inverse relationship between this sector and the oil price. We
therefore sometimes refer to the XAL as the "anti-oil index". The XAL
has been valiantly trying to establish an upward trend over the past
few weeks, but the relentless strength in the oil market has kept a lid
on it.
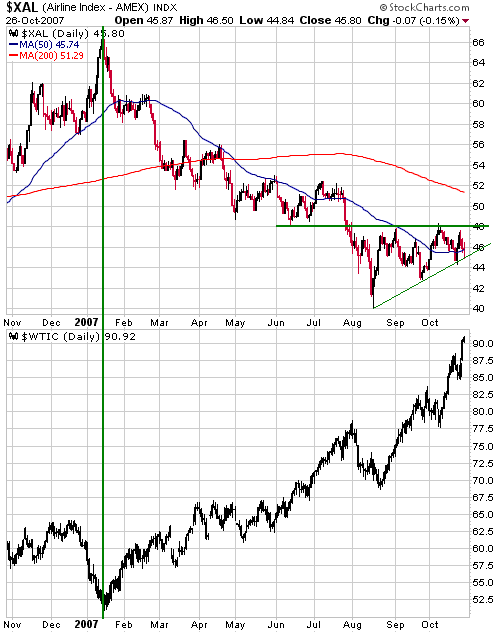
Given the extreme
recent strength in the oil market, the XAL has held up fairly well.
This is probably because the airline companies have been able to
partially offset the effects of the higher oil price by raising the
prices they charge for seats. However, for our suggested airline trade
to be a success the oil price will soon have to embark on a downward
trend.
In our own account we have taken positions in some airline stocks, but
we won't add to these positions until/unless the XAL breaks above
resistance at 48. A daily close above 48 would be a clear sign that an
upward trend had begun.
We may mention some specific airline stocks at TSI if/when the XAL
breaks above 48, but at this stage we are simply presenting a trading
theme. Traders who are interested can review charts of the XAL's components and select 2-4 likely candidates.
The Semis
The stock market's dichotomy is exemplified by the performance of the
Semiconductor Index (SOX) relative to the performance of the NASDAQ
Composite Index in that the NASDAQ ended last week above its July high
whereas the SOX has just broken below its August low. The SOX's recent
weakness is quite strange considering the overall market environment.
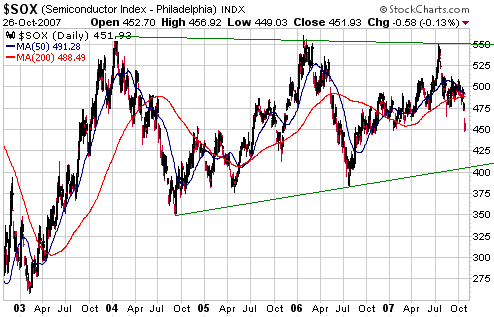
As illustrated by the following chart, the SOX has been tracing out a
large triangular consolidation pattern since the beginning of 2004.
This pattern is potentially creating a launch pad for a large
multi-quarter advance, but last week's break below the August low
indicates that the bottom of the pattern (the low-400s) might have to
be tested before a meaningful rally gets underway.
We had been contemplating some long exposure to the SOX, but last
week's performance extinguished that idea. We will almost certainly
take a long position in the semiconductor sector -- probably via SMH --
if the SOX drops below 420 at some point over the coming month, but
failing that it will probably take a daily close above 510 to re-ignite
our short-term optimism.
This week's
important US economic events
| Date |
Description |
Monday Oct 29
| No important events scheduled
|
| Tuesday Oct 30 | Consumer Confidence
| | Wednesday Oct 31
| FOMC Statement
Employment Cost Index
Chicago PMI
Construction Spending
| | Thursday Nov 01
| Personal Income and Spending
ISM Index
| | Friday Nov 02
| Monthly Employment Report
Factory Orders
|
Gold and
the Dollar
Gold Stocks
...the
fact that the HUI has not corrected to a meaningful degree during
October REDUCES the probability of the overall advance extending into
next year.
With reference to the charts of the HUI and the HUI/gold ratio included
below, Friday's surge into the 780s by the spot gold price took the HUI
back to, but not beyond, its 11th October intra-day high. With the gold
price now more than $30 above its 11th October level at the same time
as the HUI is testing its 11th October high, the HUI/gold ratio is
naturally well below the peak it reached earlier this month.
The failure of the HUI/gold ratio to confirm gold's surge to new
multi-decade highs is a bearish divergence, but it doesn't necessarily
mean much as far as the next few weeks are concerned. The reason is
that bearish divergences such as this usually have to persist for
longer and become more pronounced before they signal an important trend
reversal. The current divergence is not particularly significant
because it is only about two weeks old, but it could obviously evolve
into something of significance over the coming month or so.
The HGO (HUI/Gold Oscillator) sell signal generated on 20th September
hasn't yet worked in that such a signal is supposed to be followed by a
drop in the HUI/gold ratio to at least a few percent below its 40-day
moving average. The operative word, here, is "yet", in that we continue
to anticipate such a decline. Note, though, that due to the increase in
the gold price over the past couple of weeks the HGO's criteria could
now be met by the HUI dropping back to around 390 while the gold price
stays within about $20 of Friday's peak.
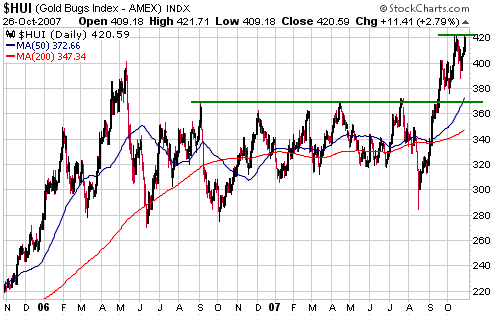

The recent action
suggests that more gains will be seen over the coming month. Also, the
improved short-term outlook for the broad stock market reduces the
short-term downside risk for the gold sector. Our guess, now, is that
any pullback over the coming 1-2 weeks -- perhaps a sell-the-news
pullback in response to the Fed doing what everyone expects it to do --
will take the HUI back to around 390 (at worst) and will be followed by
a move to new highs.
However, the fact that the HUI has not corrected to a meaningful degree
during October REDUCES the probability of the overall advance extending
into next year. Sharp 2-3 week declines in gold and gold stocks during
October in parallel with a US$ rebound could have set the stage for
multi-month extensions of the current trends, but, instead, the trends
that began in mid August have remained over-stretched.
A characteristic of the strong rally in the gold sector from its
mid-August low has been its narrowness, so much so that the rally
probably hasn't felt strong to many gold-stock investors. The rally has
resulted in large gains for a relatively small number of stocks, and
despite the new highs in the gold-stock indices most gold stocks have
remained well below their 2006 or early-2007 highs.
Had the gold-stock indices corrected sharply during October then the
subsequent advance would probably have had much broader participation,
but note that even if the gold-stock indices reach intermediate-term
peaks over the coming 6 weeks we could still see some interest return
to the speculative end of the market during the first quarter of next
year. Those who have been involved with junior gold stocks over the
past several years might recall, for instance, that even though the HUI
reached intermediate-term peaks in early-December of 2003 and
late-November of 2004, plenty of exploration-stage gold stocks went on
to make new highs during the first quarters of 2004 and 2005.
The point is: the longer this rally goes the greater the chance that it
will result in rampant speculation amongst the sorts of gold stocks
that we tend to focus on, but even after it ends there could be a 2-3
month period when the exploration-stage stocks do well while the majors
trend downward.
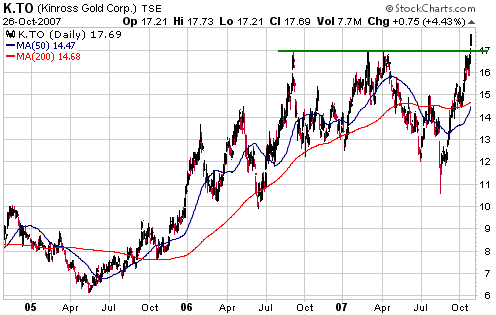
The HUI ended last week at a new closing high, but due to the
continuing narrowness of the rally only one of the many large and
mid-tier gold stocks we follow made a decisive move into new-high
territory. The stock that we are referring to is Kinross Gold (NYSE:
KGC, TSX: K). In fact, not only did the US$-denominated shares of
Kinross build on the upside breakout achieved early this month, the
following chart shows that the C$-denominated shares also ended the
week at a new high.
There has been considerable speculation this year about Barrick Gold
making a takeover bid for Newmont Mining, but the price action has us
wondering if Kinross is Barrick's target.
Silver
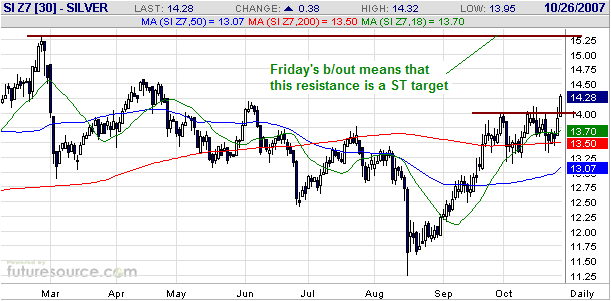
The following daily chart shows that the December silver contract has
broken out to the upside. This breakout suggests that December silver
will, at a minimum, test resistance at around 15.25 at some point over
the coming two months. Interestingly, this upside breakout by silver
coincided with an upward reversal in the Bank Index (refer to last
week's Interim Update for a discussion about why this might be
significant).
The set-up for a long trade in silver-related investments is not ideal
because gold and the gold-stock indices are so 'overbought', but silver
is not extended in terms of either price action or sentiment so we will
respect the breakout.
The simplest and
lowest-risk way to obtain long exposure to silver is via the silver ETF
(SLV), but more 'bang for the buck' (and more downside risk) can be
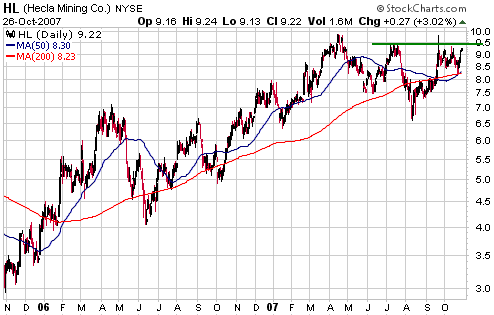
obtained by purchasing stocks of silver miners. In this respect, Hecla
Mining (NYSE: HL) currently looks like a reasonable trading vehicle in
that the consolidation pattern traced out by the stock over the past 6
months would be capable of supporting a 30% up-move. Note that about
half of HL's revenue comes from mining gold, but almost all of its
profit comes from mining silver.
First Majestic Silver (TSXV: FR), one of our core holdings, should also
do well if silver follows through on last week's breakout, although FR
is better suited to being a longer-term investment than a short-term
trade.
Currency Market Update
We are going to quickly re-visit a relationship we first addressed several weeks ago.
Via annotations on the following Bloomberg.com chart of the Baltic Dry
Index (BDI -- an index of ocean freight rates) we have attempted to
show that intermediate-term peaks in the BDI tend to coincide with
intermediate-term bottoms in the US$, and vice versa. Therefore, when
the US$ eventually reverses upward 'for real' we should get
confirmation in the form of a downward reversal in the BDI.
Update
on Stock Selections
(Note: To review the complete list of current TSI stock selections, logon at http://www.speculative-investor.com/new/market_logon.asp
and then click on "Stock Selections" in the menu. When at the Stock
Selections page, click on a stock's symbol to bring-up an archive of our comments on the stock in question)
 The Venezuela Gold Play The Venezuela Gold Play
At the beginning of this month we added Gold Reserve (AMEX: GRZ) to the
TSI Stocks List as a trade at US$4.38/share. As far as we can tell, GRZ
is the cheapest way for stock speculators to gain exposure to a
development-stage gold deposit with more than 10M ounces of P&P
reserves in that the stock market is presently valuing these reserves
at only US$26/ounce. One reason for the low valuation is the low grade
of GRZ's Brisas gold project, but this is not the main reason because
the significant copper by-product should allow the gold to be extracted
from the ground at a cost of only US$250/ounce.
The main reasons for GRZ's low valuation are country risk (Venezuela)
and the extraordinarily long time it is taking for the Venezuelan
Ministry of the Environment to issue the full mining permit (GRZ's
current permit only allows them to do some preparatory infrastructure
development).
GRZ's Brisas deposit adjoins the Las Cristinas deposit owned by
Crystallex (AMEX: KRY). In fact, the two deposits are just different
sections of the same ore body. The stock market is valuing KRY's
reserves at almost double the amount at which it is valuing GRZ's
reserves, but KRY's valuation premium is probably justified given that
it controls the largest and highest-grade portion of the ore body. In
any case, KRY's valuation is still very low relative to industry
standards as a consequence of the risks mentioned above.
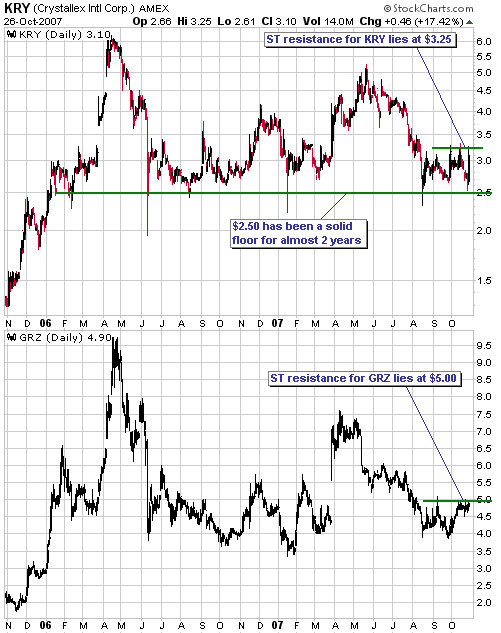
After KRY dropped back to the 2.50s last Thursday we decided to feature
it in today's Weekly Update because US$2.50 has acted as a solid floor
over the past two years and because at Thursday's closing prices the
KRY/GRZ ratio had dropped to near its lows of the past two years.
Unfortunately, news on Friday morning
that additional pressure had been put on Venezuela's Ministry of the
Environment to grant the relevant mining licence/permit caused KRY to
jump 17%, but we still thought it was worth presenting the idea of
buying it for a trade.
We aren't going to add KRY to the Stocks List, but anyone interested in
the Venezuela play will probably be best served by buying equal dollar
amounts of GRZ and KRY (with the total amount risked across both stocks
being the equivalent of a single position). If we were forced to choose
just one we'd choose GRZ, but the following charts show that the two
stocks tend to move in unison. Also, owning both stocks would cover a
speculator against the risk that one of the companies receives the
relevant permit well in advance of the other.
The Venezuela play, by the way, is based the following combination of factors:
a) The likelihood that receipt of full mining permits will result in
substantial upward re-ratings of GRZ and KRY, almost regardless of what
is happening to the price of gold
b) The distinct possibility that if the gold rally continues then GRZ
and KRY will make sizeable gains due to the enormous gold-price
leverage they offer, almost regardless of whether the required mining
permits have been issued
c) The outside chance that KRY and/or GRZ will receive takeover bids
(we doubt that any large North American or South African gold miner
would be interested in investing a lot of money in Venezuela, but a
large Russian miner might be interested).
Note that a daily close above US$3.25 by KRY would create a short-term
chart-based target of US$4.00 and that a daily close above US$5.00 by
GRZ would create a short-term target of US$6.00.
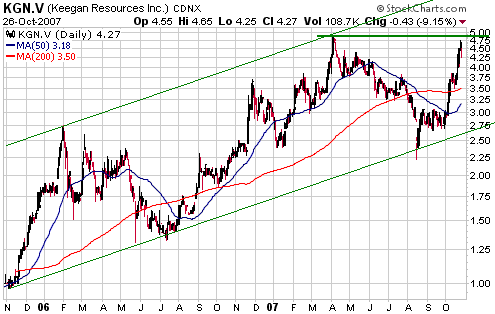
 Keegan Resources (TSXV: KGN). Shares: 23M issued, 30M fully diluted. Recent price: C$4.27 Keegan Resources (TSXV: KGN). Shares: 23M issued, 30M fully diluted. Recent price: C$4.27
Last Thursday KGN reported an initial resource estimate of 1.7M ounces
of gold at its Esaase project in Ghana. This initial estimate is based
on just the first year of drilling at the project and can reasonably be
described as a good start.
We expect the Esaase resource to expand considerably over the coming
year in response to additional in-fill and step-out drilling, leading
to a much higher stock price and, eventually, to a takeover bid from a
mid-tier gold miner. However, with the stock having run up from the
2.70s to the low-4.00 area during the three weeks prior to Thursday's
news and then jumping to the 4.70s in the hours following the news it
was not surprising that profit taking occurred on Friday. The stock's
close proximity to the lateral resistance shown on the following chart
also made a period of consolidation a likely outcome in the aftermath
of Thursday's strong up-move.
As noted in the 23rd August Interim Update, we think KGN has the right
stuff to be a "core" gold/silver holding (along with CKG.V, FR.V,
GGN.TO, GOZ.V, LST.AX, MFN, MRB and SBB.V). The positions that we
consider to be "core" aren't necessarily the ones that we expect to
deliver the greatest short-term gains; rather, they are the ones we are
most comfortable sitting with during the market's upward AND downward
swings.
We think a pullback to around C$3.80 would create a new opportunity to buy some KGN.
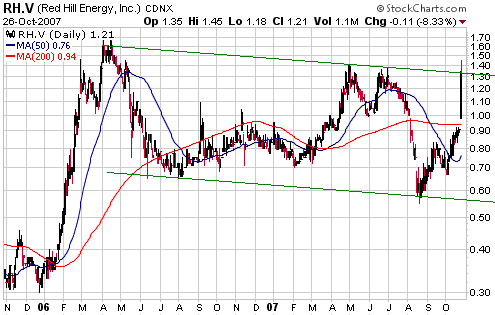
 Red Hill Energy (TSXV: RH). Shares: 47M issued, 57M fully diluted. Recent price: C$1.21 Red Hill Energy (TSXV: RH). Shares: 47M issued, 57M fully diluted. Recent price: C$1.21
In the 23rd August Interim Update we described RH as a steal at its
then price of C$0.60. Due mostly to a new coal discovery reported last
Thursday the stock price of this Mongolia-based exploration-stage coal
miner has since doubled, but in our opinion RH offers even better value
now at around C$1.20 than it did at C$0.60 in August. This is because
the new discovery has increased RH's M&I coal resource by 180%
(from 350M tonnes to 1B tonnes) and total coal resource by 290% (from
386M tonnes to 1.5B tonnes).
The value of RH's in-ground coal resource is now so large relative to
the stock's market capitalisation that additional growth in the
resource is probably not going to do much. What we really need now in
order to obtain the large gains that this stock is capable of
delivering is increased speculation in the coal mining sector of the
stock market and/or a deal between RH and a major coal producer.
The Mongolian Government continues to be the biggest risk, but this
risk can be mitigated by limiting one's combined exposure to
Mongolia-related plays.
RH can be accumulated from near its current level down to around C$1.00
(we doubt that it will trade significantly lower than 1.00).
 Kinross
Gold Warrants (TSX: K.WT.B). Exercise price C$10.00, expiry date
Sep-2011, 2.2487 warrants per share. Recent price: C$2.55 Kinross
Gold Warrants (TSX: K.WT.B). Exercise price C$10.00, expiry date
Sep-2011, 2.2487 warrants per share. Recent price: C$2.55
Warrants on Canadian resource shares regularly trade considerable
distances from their fair values. More often than not they trade at
premiums to fair value, especially during the latter stages of
intermediate-term market advances when the speculative juices are
flowing freely, but occasionally they trade at significant discounts.
We were therefore not surprised when we discovered, a few months ago,
that the Kinross Gold warrants (K.WT.B) were trading at a significant
discount to fair value. We WERE surprised, however, when the discount
seemed to increase as the underlying stock moved sharply higher over
the past few weeks. This caused us to question the assumptions we made
when doing the original valuation.
What we've found is that we have made a basic error in our
calculations. We have been assuming that 2.2487 warrants could
converted into one share at a cost of C$10.00, but in actuality the
total amount that would have to be paid per share when exercising the
warrants is C$22.487 (2.2487*$10). In other words, the effective
exercise price of these warrants is around $22.50. As a result, we now
realise that they were significantly over-valued when we originally
added them to the TSI List, and are now, thanks to the gains in the
Kinross stock price, roughly at fair value.
This will hopefully be a case of "no harm no foul", because as noted
earlier in today's report the Kinross stock price has broken out to the
upside from a lengthy consolidation. The stock is overbought and likely
to pause for breath in the near future, but last week's breakout
suggests an upside target of around C$23; and if Kinross trades at C$23
within the next few months then our Series B warrants will probably
move up to around C$4.00. That is, an additional 30% increase in the
stock price over the next few months should lead to an increase of at
least 50% in the price of K.WT.B.
It is, of course, possible that Friday's upside breakout by Kinross
will prove to be a 'head fake' and that the stock will quickly drop
back into its lengthy consolidation range. The best thing about these
warrants, though, is that their expiry date is almost 4 years into the
future; so although further short-term gains in Kinross shares would be
welcome, our warrant position does not require them.
Chart Sources
Charts appearing in today's commentary
are courtesy of:
http://stockcharts.com/index.html
http://www.futuresource.com/

|

