|
-- for the Week Commencing 29th December 2003, 2nd Page
Commodities
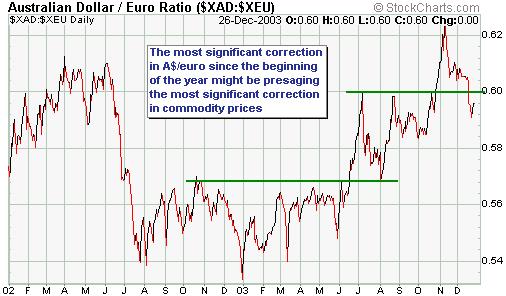
The commodity currencies (currencies
of countries that are heavily reliant on the production and exporting of
commodities) have recently been very weak relative to the major European
currencies. For example, A$/euro (see chart below) is presently immersed
in its most significant correction of the past 12 months. This relative
weakness could, in turn, be a sign that a sizeable pullback in commodity
prices will soon get underway.
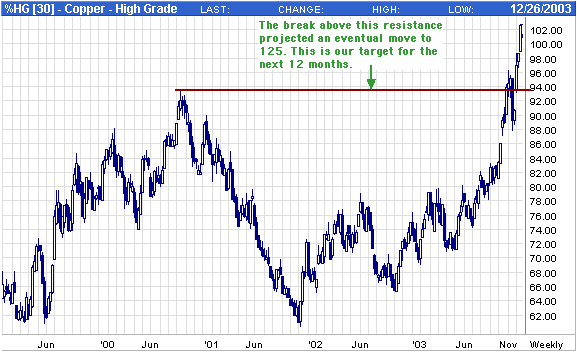
When we look at the below weekly chart
of copper futures we don't see any sign of weakness as yet, but what we
do see is an almost vertical rise. Vertical rises are unsustainable, so
while copper will probably continue its ascent for a short while a peak
is likely within the next few weeks.
Following the sort of rise that the
industrial metals have just experienced it would be normal to see a pullback
lasting 6 months or longer. However, while a lengthy correction would be
consistent with our expectations for a slowdown in US economic growth,
China's money supply continues to grow at a frenetic pace and as long as
Chinese demand for commodities remains strong a prolonged downturn in commodity
prices is most likely not going to occur. As such, a 1-3 month pullback
in the metals and some other commodities is probably all we are going to
get.
One wildcard is the potential for another
outbreak of SARS as this is something that could quickly slow China's growth
rate and, in so doing, cause a sudden and sharp reduction in the demand
for most commodities. However, we don't think another SARS epidemic is
going to occur because the medical profession in this part of the world
(China and Hong Kong) now knows what to look and how to treat the disease.
Furthermore, much greater levels of awareness and preparedness throughout
the population will severely limit the ability of the disease to spread
(potential new cases will be quickly quarantined and people will take precautions
to prevent themselves from being exposed).
Another wildcard is the potential for
a major and successful terrorist attack. In today's world this is, unfortunately,
an ever-present threat and is something that could lead to a sharp sell-off
in commodities and all other economically-sensitive investments. It is,
however, something we have no way of handicapping.
The bottom line is that barring a disaster
we should get a normal correction in commodity prices over the next few
months, perhaps following a final run-up in January.
Gold and
the Dollar
Gold Stocks
Another look at the 1970s model
During 2002 and the first half of 2003
we would regularly show a chart comparing the performance of the AMEX Gold
BUGS Index (HUI) from its November-2000 bottom with the performance of
the Barrons Gold Mining Index (BGMI) from its January-1972 bottom. The
chart was interesting because it showed that the gold-stock bull market
that began in 2000 was following a very similar path to the one that began
in 1972.
If the HUI of today had continued to
follow the BGMI of the early 1970s it would have reached a major peak towards
the end of June 2003. When June 2003 arrived, though, it was apparent to
us that gold stocks were not close to a major peak. We therefore stopped
showing this chart comparison because the gold-stock bull market of today
was clearly diverging from its 1970s counterpart. However, provided we
don't take the chart comparison too literally, that is, provided we don't
have the unrealistic expectation that the current bull market will mimic
every significant twist and turn of the 1970s bull market, there might
still be some validity to the 1970s model. The reason we say this is that
although gold stocks reached a major peak in August of 1974 (the 1974 peak
was not exceeded until the second half of 1979), the trend remained positive
until around July of 1975 (the July-1975 peak wasn't far below the August-1974
peak). On the below chart, which compares the 1970s BGMI with the HUI of
today, the BGMI's secondary peak in July of 1975 would correspond with
May of 2004.
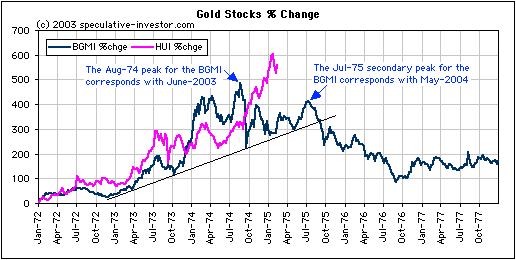
We are re-introducing the 1970s model
at this time because a major peak in the gold stocks in May of 2004 meshes
with what we see happening in other markets. In particular and as further
explained below, it fits with the strong tendency of the gold sector to
peak some time AFTER the Dow Industrials Index has reached a major peak
of its own.
When the medium-term outlook for the
gold price is bullish, as it is now, gold stocks usually do well during
the initial stages of any substantial downturn in the broad stock-market
but get hit hard when the broad market begins to decline at an accelerated
pace. In other words, the intermediate-term trend for gold stocks should
remain positive until the Dow has entered the accelerated phase of its
next decline. However, after the stock market has rallied as strongly as
it has done over the past 14 months it would be atypical for it to peak
and then immediately fall to pieces. Rather, an initial decline followed
by a 'test' of the peak would be a more likely outcome. So if the Dow makes
an important peak in January, as per our current forecast, then a March
'test' of the peak would be normal with an accelerated decline not commencing
until April at the earliest.
Current Market Situation
There is evidence, such as the breakdown
in the HUI/gold ratio, to indicate that the HUI has already peaked for
this cycle. However, regardless of whether this is or isn't the case it
now looks like the positive trend in the gold sector is going to extend
into April-May of 2004. This might mean that the HUI makes a lower peak
over the coming months while many of the junior gold stocks, as well as
some of the majors that didn't really participate in this year's rally
(for example, Harmony Gold Mining and Gold Fields Limited), make new highs.
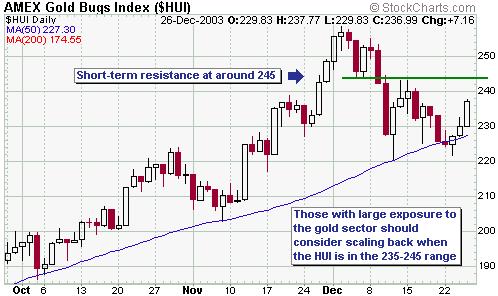
In the short-term (the next 1-2 months),
the correction that began in early December is likely to continue. The
HUI has some resistance at around 245 and some rather important short-term
support at 220.
By the way, if you are planning to
take profits in a stock and you know that the stock has a 70% probability
of trading at a higher price in three months time, should you take your
profits now or wait for three months? The correct answer is: it depends
on the expected magnitude of the upside relative to the downside risk.
For example, if you assess that the stock has a 70% chance of rising 5%
over the next three months and a 30% chance of falling 25% then you should
take the profits now.
The above question is relevant to the
gold sector's current situation because although there is a reasonable
chance that gold stocks, as a group, will trade above today's levels within
the next several months, most of the major North American gold stocks and
a few of the junior/mid-tier producers do NOT look attractive from a risk/reward
perspective. In all likelihood they will trade higher, but at their current
prices the downside risk exceeds the probable upside.
Gold and the Dollar - Current Market
Situation
Nothing of any real significance happened
during last week's holiday-shortened trading so the following extract from
the 22nd December Weekly Update is still applicable:
"The Swiss Franc moved up to the
top end of its 78-80 major resistance range last week while the euro moved
slightly above equivalent resistance. At the same time, gold moved up to
the middle of the 410-420 resistance range that has been our focus for
several months and the Dollar Index hit important trend-line support. We
have therefore reached a point where a Dollar rebound is highly probable.
The only thing we haven't seen, as yet, is any significant sign of strength
in the US$ to indicate that a short-term bottom is already in place. As
such, it is still possible that we'll get a final downward spike in the
Dollar before a counter-trend move gets underway.
As previously discussed, if a US$
rally began from around the current level it would probably last for only
1-2 months.
Gold could drop all the way back
to around 375 in the short-term without doing any significant technical
damage, although we doubt that it will go that low. It is more likely that
any pullback would hold in the 390s. It is also possible that gold and
gold stocks have already discounted a 1-2 month US$ rebound (remember that
gold leads the dollar and gold stocks lead gold)."
One thing worth mentioning is that
there has not yet been a downward spike in the US$ or upward spike in the
gold price. Instead, there has been a slow and relentless grind. This doesn't
mean that corrective moves won't soon begin (we expect that they will),
but does support the view that we are not yet close to a sustainable bottom
in the US$ or peak in the gold price.
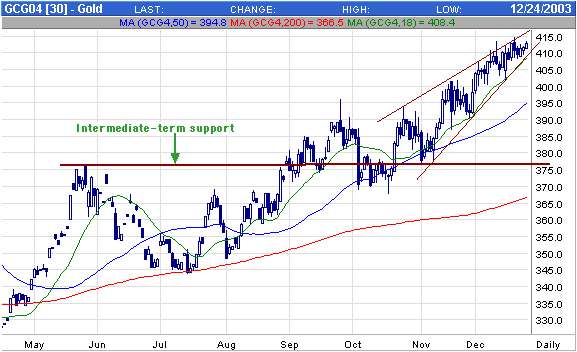
February gold futures have successfully
tested their 18-day moving average on three occasions over the past 6 weeks,
which simply means that a daily close below this moving average (currently
about $408) would be a sign that a more extended pullback was in the works.
In fact, the below chart indicates that a close below 408 would also result
in a break of trend-line support and is therefore something for short-term
traders to be aware of.
Our intermediate-term forecast continues
to be that the gold price is on its way to $460, most likely following
a pullback from resistance in the 410-420 range.
Update
on Stock Selections
 In
the 22nd December Weekly Update we said we'd add trading positions in Corvis
(NASDAQ: CORV) and Lynx Therapeutics (NASDAQ: LYNX) to the Stocks List
if the stocks traded down to $1.55 and $4.80, respectively, but in both
cases our suggested buy prices proved to be too stingy. However, CORV is
only marginally above our suggested buy price and will be added to the
List immediately at Friday's closing price of $1.62. LYNX took off like
a scalded cat (pun intended) last week and is now too far above its trend-line
to be of interest as far as any new buying is concerned. In
the 22nd December Weekly Update we said we'd add trading positions in Corvis
(NASDAQ: CORV) and Lynx Therapeutics (NASDAQ: LYNX) to the Stocks List
if the stocks traded down to $1.55 and $4.80, respectively, but in both
cases our suggested buy prices proved to be too stingy. However, CORV is
only marginally above our suggested buy price and will be added to the
List immediately at Friday's closing price of $1.62. LYNX took off like
a scalded cat (pun intended) last week and is now too far above its trend-line
to be of interest as far as any new buying is concerned.
We
added a position in USPIX -- an inverse index fund -- to the Stocks List
in mid December and expect to add a second USPIX position to the List in
early January if the NDX continues to under-perform the Dow.
Housekeeping
Due to the markets being closed this
coming Thursday for New Year's Day, we'll post a briefer-than-usual Interim
Update one day earlier than usual (on Wednesday morning instead of Thursday
morning).
It seems that some of our readers aren't
aware that the e-mails we send out to notify that a new commentary has
been posted at TSI always include a direct link to the commentary. If you
click on this link you will bypass the login screen and go straight to
the commentary.
Chart Sources
Charts appearing in today's commentary
are courtesy of:
http://stockcharts.com/index.html
http://www.futuresource.com/

|
