


--
Weekly Market Update for the Week Commencing
30th January 2017
Big Picture
View
Here is a summary of our big picture
view of the markets. Note that our short-term views may differ from our
big picture view.
The BULL market in US Treasury Bonds
that began in the early 1980s ended in early-2015, but there will be many years
of topping action in bond prices and bottoming action in bond yields before
major new trends get underway. (Last update: 29 June 2015)
The stock market, as represented by the S&P500 Index,
commenced
a secular BEAR market during the first quarter of 2000, where "secular
bear market" is defined as a long-term downward trend in valuations
(P/E ratios, etc.) and gold-denominated prices. This secular trend will bottom sometime between 2018 and 2020.
(Last update: 29 June 2015)
A secular BEAR market in the
US
Dollar
began during the final quarter of 2000 and ended in July of 2008. This
secular bear market will be followed by a multi-year period of range
trading.
(Last
update: 09 February 2009)
Gold commenced a
secular bull market relative to all fiat currencies, the CRB Index,
bonds and most stock market indices during 1999-2001.
This secular trend will peak sometime between 2018 and 2020.
(Last update: 29 June 2015)
Commodities,
as represented by the CRB Index, commenced a
secular BULL market in 2001 in nominal dollar terms. The first major
upward leg in this bull market ended during the first half of 2008, but
a long-term peak won't occur until 2018-2020.
(Last
update: 29 June 2015)
Copyright
Reminder
The commentaries that appear at TSI
may not be distributed, in full or in part, without our written permission.
In particular, please note that the posting of extracts from TSI commentaries
at other web sites or providing links to TSI commentaries at other web
sites (for example, at discussion boards) without our written permission
is prohibited.
We reserve the right to immediately
terminate the subscription of any TSI subscriber who distributes the TSI
commentaries without our written permission.
Outlook Summary
Market
|
Short-Term
(1-3 month)
|
Intermediate-Term
(6-18 month)
|
Long-Term
(2-5 Year)
|
|
Gold
|
N/A |
Neutral
(21-Nov-16) |
Bullish
|
|
US$ (Dollar Index)
|
N/A |
Neutral
(17-Aug-16) |
Neutral
(19-Sep-07) |
|
US Treasury Bonds (TLT)
|
N/A |
Neutral
(21-Nov-16)
|
Bearish |
|
Stock Market (DJW)
|
N/A |
Neutral
(14-Nov-16) |
Bearish |
|
Gold Stocks
(HUI)
|
N/A |
Neutral
(21-Nov-16) |
Bullish
|
|
Oil |
N/A |
Neutral
(26-Oct-15) |
Bullish
|
|
Industrial Metals
(GYX)
|
N/A |
Neutral
(10-Oct-16) |
Bullish |
Notes:
1. Our short-term expectations are discussed in the commentaries, but except in
special circumstances we won't attempt to assign a "bullish", "bearish" or
"neutral" label to these expectations.
2. The date shown below the current outlook is when the most recent outlook change occurred.
3. "Neutral" means that we think risk and reward are roughly in balance with respect to the timeframe in question.
4. Long-term views are determined almost completely by fundamentals and intermediate-term views
are determined by a combination of fundamentals, sentiment and technicals.
Last week's posts at the TSI Blog
Casey's Financial Chaos Prediction
Gold
and the US Constitution
Summary of current
thinking/positioning
1) Thinking that the rebounds in
gold, silver and the associated mining indices are not yet close to being
over.
2) Expecting intermediate-term tops in non-gold commodities
and the associated equities later this quarter. Looking for profit-taking
opportunities, but planning to maintain some long-term exposure. Hedged
via EEM and USO put options.
3) Thinking that the US Treasury Bond
has significant additional short-term upside (within a long-term bearish
trend).
4) Expecting an extension of the US equity bull market and
expecting a generally-bullish global equity trend. Concerned about
short-term downside risk, but acknowledge that a significant correction
might not begin before March.
5) Thinking that the Dollar Index is
immersed in a 2-3 month correction, after which its longer-term upward
trend will resume.
6) Maintaining a large cash reserve to hedge
downside risk in equities (current cash percentage is about 35%).
Loosening is the
new tightening
The Fed meets to discuss its
monetary policy this week. There is almost no chance that an outcome of
this meeting will be another boost in the Fed Funds Rate (FFR), but
there's a decent chance that the next official rate hike will be announced
in March. Regardless of when it happens and regardless of how it is
portrayed in the press, the next Fed rate hike, like the two before it,
will NOT imply a tightening of US monetary policy/conditions.
The
two-part explanation for why hikes in the FFR no longer imply the
tightening of monetary policy has been discussed many times in TSI
commentaries over the past few years and was also addressed in a
March-2015 post at the TSI Blog titled "Tightening
without tightening". The first part of the explanation is that with
the US banking system inundated with excess reserves there is no longer an
active overnight lending market for Federal Funds (banks never have to
borrow Federal Funds anymore because they have far more than they
require). In other words, when the Fed hikes the FFR it is hiking an
interest rate that no one uses.
The second and more important part
of the explanation is that Fed rate hikes are now implemented by
increasing the interest rate PAID by the Fed on bank reserves. That is,
Fed rate hikes are now implemented not by charging the banks a higher rate
of interest but by paying the banks a higher rate of interest. To put it
another way, whereas in the "good old days" rate hikes were implemented by
removing reserves from the banking system, the Fed now implements rate
hikes by injecting reserves -- in the form of interest payments -- into
the banking system.
So, what's widely known as monetary tightening
is now a Federal Reserve action that actually has the effect of LOOSENING
monetary conditions.
Orwell's "1984" had the slogans "War is
Peace", "Freedom is Slavery" and "Ignorance is Strength". Thanks to the
Fed we can now add "Loosening is Tightening".
US Recession
Watch
Our most recent "US Recession
Watch" was in the 4th January Interim Update, at which time we concluded:
"The message of the ISM Manufacturing NOI [New Orders Index], the
most reliable short-term recession indicator, is that a US recession will
not begin EARLIER than the second quarter of 2017. At the same time, the
message of Real Gross Private Domestic Investment (RGPDI), the most
reliable long-term indicator of US recession, is that a US recession will
not begin LATER than the second quarter of this year.
The combined
message of the two indicators could therefore be interpreted as: a
recession should begin during the second quarter of this year. However, we
aren't confident that this is the correct interpretation. The reason is
that due to the extraordinary interventions on the monetary front and the
likelihood that -- for the first time ever, as far as we can tell --
"fiscal stimulus" will be implemented in the US with the economy in the
late stages of an expansion, the time from a downward reversal in RGPDI to
the start of a recession could be longer during the current cycle than
during any previous cycle."
A new quarterly RGPDI number was
released on Friday 27th January and revealed a significant increase in
Q4-2016. Due to this increase, RGPDI is within spitting distance of its
Q3-2015 peak.
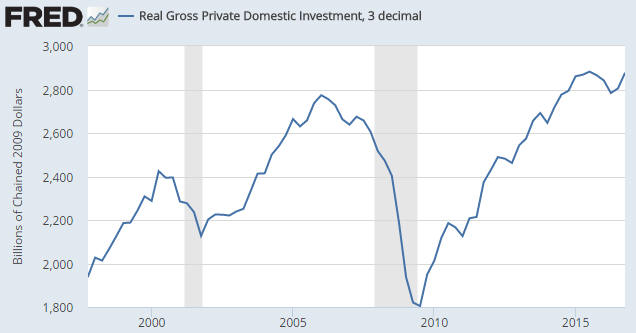
We've been operating under the assumption that RGPDI's Q3-2015 peak
was the cyclical kind (the final high prior to the start of a major
decline), but the rebound over the past two quarters to the vicinity of
the high indicates that this assumption is probably wrong. If the
assumption is wrong and RGPDI is yet to reach its high for the cycle then
the next US recession probably won't begin until 2018.
The revised
message from RGPDI fits better than the previous message with most of our
current financial-market expectations and assessments. For one example, we
expect that 2017 will turn out to be a good year for industrial
commodities and a generally bullish year for global equities, but it's
difficult to imagine how this could happen if a US recession were to begin
by the middle of the year. For another example, the likelihood that the US
economy is still at least a few quarters away from the start of a
recession is consistent with our assessment that the fundamental backdrop
remains bearish for the world's premier counter-cyclical investment (gold).
Copper Update
The copper price remained below
its November high last week, meaning that it didn't break out to the
upside. It also remained above its 50-day MA, meaning that the potential
for an upside breakout and a quick rise to around $3.00 is intact.
The Stock Market
The US
Last week's upside breakouts by the S&P500 Index (SPX) and the Dow
Industrials Index established the first significant bearish divergence
between the senior US stock indices and stock-market internals since 2015.
The bearish divergence is illustrated by the following chart, the top
section of which shows the SPX and the bottom section of which shows the
UWSPX/SPX ratio (the unweighted SPX divided by the normal
market-cap-weighted SPX). The UWSPX/SPX ratio generally turns down well
before major and intermediate-term tops, warning that the rally is
becoming narrower. For example, notice that it turned down about 3.5
months prior to the intermediate-term top of July-2015.
As a result
of last week's price action we now have a divergence of almost two months,
in that the UWSPX/SPX ratio peaked in early-December and remains well
below this peak despite the new high achieved by the SPX last week.
If market internals continue to diverge bearishly from the senior
indices then an intermediate-term top (a top that holds for at least 6
months) will probably be put in place later this quarter.
A likely
news-related 'excuse' for an intermediate-term decline from a Q1-2017 peak
is the looming political battle over the US government's debt ceiling. The
current debt limit expires in mid-March and will have to be raised to
enable the government to continue its borrowing. It will be raised, but
months of Congressional wrangling over the issue could be the story that
justifies, in the mainstream financial press and the minds of many
traders, months of weakness in the stock market.
This week's
significant US economic events
[Notes:
1) The most important events
(to the markets) are shown
in bold. 2) A list of global economic events can be found
HERE]
| Date |
Description |
|
Monday January 30 |
Personal Income and Spending
Pending Home Sales Index |
| Tuesday
January 31 |
Employment Cost Index
Chicago PMI
Consumer Confidence |
|
Wednesday February 01 |
Motor Vehicel Sales
ISM Mfg Index
Construction Spending
FOMC
Announcement |
|
Thursday February 02 |
Q4 Productivity and Costs
(prelim) |
|
Friday February 03 |
Monthly Employment
Report
ISM Non-Mfg Index
Factory Orders |
Gold and the Dollar
Gold
The
US$ gold price reached its 50-day MA on Friday and then bounced. This means that
the decline has now gone as far as it should go IF, as we currently think is
most likely, the market is experiencing a routine correction prior to resuming
its short-term upward trend. However, with the fundamental backdrop
gold-bearish, as evidenced in part by the current enthusiasm for pro-cyclical
speculations such as copper, oil and the broad stock market, we certainly can't
rule out the possibility of a larger pullback in the gold price.
A solid
daily close below the 50-day MA would change the anticipated pattern/roadmap.
Such an event would suggest that the initial rebound from the December-2016 low
had ended sooner than expected and that a test of the December low was on the
cards, but could also lead to an extension of the overall rebound. We will deal
with the possibility of a longer rebound involving a test of the December-2016
low if the 50-day MA is solidly breached.
The Fed's actions naturally affect the gold market. The FOMC Announcement
scheduled for this Wednesday (1st February) could therefore be a market-moving
event, although it probably won't be.
The US$ gold price has risen on 11
of the past 13 FOMC Announcement days, but if it rises on Wednesday it probably
won't be due to anything the Fed does or says. The reason is that the Fed will
almost certainly do what almost everyone expects, which is make no change to its
targeted interest rate and make no significant change to the wording of its
policy statement.
Silver
Silver is in a similar
position to gold, in that it bounced off its 50-day MA on Friday. However, on a
very short-term basis the silver chart looks more bullish than the gold chart,
the reasons being that silver has now completed three successful tests of its
50-day MA and Friday's reversal was stronger in the silver market than in the
gold market (Friday was an "outside-up" day in the silver market).
The
Silver price has short-term upside potential to $18-$19.
Gold Stocks
The gold-mining sector remains in
consolidation mode, which is where it has been since 5th January. It is getting
helped to some extent by the strength in the industrial-metals-mining sector,
but at the same time the enthusiasm for gold-related investments is being
dampened by rising economic confidence.
There's no reason to favour gold
stocks over stocks in general and other commodity stocks in particular if the
pace of real economic growth is about to increase. The pace of real economic
growth is probably not actually about to increase, but financial-market price
trends are driven by perception and perception regularly deviates from reality.
We continue to have 220-250 in mind as a target for the HUI's rebound from
its December low. The upper end of this range will be achievable during Q1-2017
as long as the gold price holds above its 50-day MA.
The
first clear-cut evidence that the gold-mining consolidation is over will
probably be provided by GDXJ. This is due to GDXJ's numerous tests of its
200-day MA (the red line on the following chart). A daily close above this MA
would signal the resumption of the gold sector's short-term upward trend.
The Currency Market
The euro reached resistance near
108 last Monday and then pulled back. It could do what the gold and silver
markets have just done and drop back to its 50-day MA. That would be a routine
correction to a short-term upward trend, whereas a decline to below this MA
would suggest that the short-term rebound was over and the longer-term downward
trend had resumed.
The most we are expecting from the euro's rebound is a
test of intermediate-term resistance near 109.5.
The following chart compares the euro (the blue line) with the difference
between German and US 10-year government bond yields.
It is clear that
there has been a positive correlation over the 2-year period covered by the
chart and that the positive correlation has been very strong over the past 6
months. That is, recently the euro has consistently strengthened against the US$
when German 10-year interest rates have risen relative to US 10-year interest
rates and weakened against the US$ when the interest-rate differential has moved
in the other direction.
Prior to the past 2 years there were some large divergences between the
euro/US$ exchange rate and the interest-rate differential shown in the above
chart. Also, as an indicator of the euro/US$ exchange rate, relative
equity-market performance has a much better long-term track record than the
interest-rate differential. However, for some reason the interest-rate
differential has recently exerted more influence than usual.
We are
mentioning the relationship depicted above as something to watch, but at this
stage it is not giving us any clues about the future performance of the euro.
The reason is that we don't have an opinion on whether 10-year German interest
rates will rise or fall relative to 10-year US interest rates over the months
ahead. The fact that the ECB is still aggressively monetising bonds while the
Fed takes some tentative steps towards 'policy normalisation' suggests that
German bond yields are more likely to fall than rise relative to US bond yields,
but on the other hand German bond yields are starting at much lower levels than
US bond yields in both nominal and real terms.
Updates
on Stock Selections
Notes: 1) To review the complete list of current TSI stock selections, logon at
http://www.speculative-investor.com/new/market_logon.asp
and then click on "Stock Selections" in the menu. When at the Stock
Selections page, click on a stock's symbol to bring-up an archive of
our comments on the stock in question. 2) The Small Stock Watch List is
located at http://www.speculative-investor.com/new/smallstockwatch.html
 Company
news/developments for the week ending Friday 29th January 2017:
Company
news/developments for the week ending Friday 29th January 2017:
[Note: AISC = All-In Sustaining Cost, FS = Feasibility Study, FY = Financial
Year, IRR = Internal Rate of Return, ISR = In-Situ Recovery, MD&A = Management
Discussion and Analysis, M&I = Measured and Indicated, NAV = Net Asset Value,
NPV(X%) = Net Present Value using a discount rate of X%, P&P = Proven and
Probable, PEA = Preliminary Economic Assessment, PFS = Pre-Feasibility Study]
*Blackham Resources (BLK.AX) published a revised
resource estimate for the Matilda/Wiluna gold project in Western Australia in
December. At that time, 900K ounces were added to the project's estimated global
resource. Specifically, the combined Matilda/Wiluna Measured, Indicated and
Inferred Mineral Resource grew to 6.0Moz (58Mt at 3.2g/t) from 5.1Moz, with
about 2.1M ounces of the new total being open-pit resources.
Another
revision to the resource estimate was published last week. The result is that
the project's estimated global resource has grown by an additional 400K ounces
-- to 6.4Moz (63Mt at 3.2g/t), including about 2.4M ounces of open-pit
resources. In other words, BLK has increased its estimated gold resource by 1.3M
ounces (about 25%) over the past 2 months.
These revised estimates are
part of the Stage 2 expansion study aimed at growing annual gold production to
200K ounces from this year's target of 100K ounces.
There was no market
reaction to BLK's mid-December announcement of an additional 900K ounces of
in-ground resources. There was, however, a meaningful positive reaction to last
week's news of a 400K-ounce resource addition, with the stock rising quickly to
A$0.80 before dropping back to the A$0.60s in sympathy with the sector-wide
correction.
This indicates that gold-sector sentiment is continuing to
cycle from depression to exuberance and back again. The market environment for
gold-mining stocks swung from depressed during the second half of 2015 (a period
when the market mostly ignored genuinely good news from gold-mining companies)
to exuberant during the second and third quarters of 2016 (when gold-mining
stocks rallied strongly in reaction to almost any news, regardless of its
significance) to depressed during November-December of 2016 (when genuinely good
news was again being mostly ignored). It now appears to be on its way back to
exuberant, although it still has a long way to go.
Obviously, most buying
should be done during the periods when sentiment is depressed and most selling
should be done during the periods when sentiment is exuberant.
*Evolution
Mining (EVN.AX) issued its quarterly report for the December quarter.
The results were good, but not surprising.
Gold production during the
quarter was 218K ounces at an AISC of only A$900 (US$675) per ounce. This puts
EVN on track to do a little better than its FY2017 guidance of 800K-860K ounces
at an AISC of A$900-$960/oz. Net debt at 31st December was apparently A$588M,
which is roughly in line with our expectations and not a problem for a company
with $100M+/quarter of positive cash flow.
As far as we know, EVN has
the lowest production cost of any mid-tier or major gold producer. It also has
the lowest geopolitical risk profile of any mid-tier or major gold producer. Its
shares should therefore be assigned a valuation premium, but if anything they
trade at a discount.
*Petrus Resources (PRQ.TO) provided
production guidance for 2017. The capital budget for the year is C$50M-$60M
(oil-and-gas production is a capital-intensive business), which will be funded
from cash flow, working capital and existing credit facilities. The plan is for
this money to fund the drilling of 16 new wells.
The production rate in
December was about 8,500 boe/d (barrels of oil equivalent per day). The company
has a base decline rate of 28%, which means that if it drilled no new wells its
production rate would decline to about 6,100 boe/d by December of this year.
However, due to this year's drilling the production rate is expected to rise to
the 9,600-10,200 range by year-end 2017.
*Sprott Resource
Corp. (SCP.TO) and Adriana Resources (ADI.V)
shareholders have given their respective approvals to the merging of the two
companies. The merger is now expected to be finalised on or shortly after 9th
February, at which time the name of the combined company will be Sprott Resource
Holdings.
List
of candidates for new buying
From within the ranks of TSI stock
selections the best candidates for new buying at this time, listed in
alphabetical order, are:
1) AAU at around US$0.90 (last Friday's closing
price: US$1.03)
2) ALK.AX at A$0.35 or lower (last Friday's closing
price: A$0.37)
3) BLK.AX (last Friday's closing price: A$0.665)
4)
PRQ.TO in the low-C$2.70s (last Friday's closing price: C$2.95)
5) SCP.TO
(last Friday's closing price: C$0.57) or ADI.V (last Friday's closing price:
C$0.19)
The above list is limited to five stocks. It will sometimes
contain less than five, but it will never contain more than five regardless of
how many stocks are attractively priced for new buying.
Speculative
exposure to fertiliser
Due to last week's news it's worth
revisiting Focus Ventures (FCV.V), a tiny company that owns the large Bayovar
phosphate (fertiliser) project in northern Peru. Based on the updated PFS
completed in Q2-2016, this project is estimated to have an after-tax NPV(7.5%)
of US$458M.
FCV is a member of the
TSI Small
Stocks Watch List, which means that we think it has speculative merit but
that it is too small/risky/illiquid to be in the TSI Stocks List.
Here's
what we wrote about FCV in the 2nd November 2016 Interim Update, at which time
it was trading at C$0.065:
"For there to be a large increase in FCV's
stock price, one of two things will have to happen. The company will have to
attract a JV partner of sufficient size and financial resources to fund the
development of the project or there will have to be a substantial rise in the
speculative enthusiasm for fertiliser-related equities. Currently, there is
almost no interest in such stocks.
Also worth mentioning is that FCV has
about C$1.1M of short-term liabilities and only about $0.6M of cash, so unless
it attracts a financially-strong JV partner in the near future it will have to
do another dilutive equity financing.
With a market cap of less than
US$7M and 100% ownership of a project with a US$458M NPV, FCV has massive upside
potential. However, in the absence of unexpected news the stock probably won't
do much over the next few months and could soon be weighed down by an equity
financing."
The expected equity financing was announced last week.
The company is raising C$4M by issuing 80M new shares at C$0.05/share and in
doing so is increasing its total share count to about 212M. Although this
dilutes the per-share value, it removes a short-term risk and allows the company
to move forward.
More significantly, in the
press release
that announced the equity financing the company also announced the hiring of a
new president.
The new president (Gordon Tainton) has an excellent C.V.,
including decades of experience in senior management roles in the fertiliser
industry. He should have the contacts and knowledge needed to negotiate the JV
deal that would make FCV a far more valuable company, and the fact that he has
accepted the position with FCV is a stamp of approval for the Bayovar project.
A final relevant point is that fertiliser stocks are beginning to garner
some interest as part of the general rise in the enthusiasm for
commodity-related investments. This is evidenced by the following chart of
Potash Corp. (POT), one of the world's largest producers of potash. It looks
like POT has completed a long-term base.
Buying POT shares would be a relatively low-risk way of obtaining exposure to
fertiliser, especially if the shares are bought with the price near the top of
the base (US$18.00). FCV is more of a Vegas-style gamble, but with better odds
for the punters.
FCV is an interesting speculation near its financing
price of C$0.05.
Chart Sources
Charts appearing in today's commentary
are courtesy of:
http://stockcharts.com/index.html
http://research.stlouisfed.org/
