|
-- Weekly Market Update for the Week Commencing 30th March 2009
Big Picture
View
Here is a summary of our big picture
view of the markets. Note that our short-term views may differ from our
big picture view.
In nominal dollar terms, the BULL market in US Treasury Bonds
that began in the early 1980s will end by mid-2010. In real (gold)
terms, bonds commenced a secular BEAR market in 2001 that will continue
until 2014-2020. (Last
update: 09 February 2009)
The stock market, as represented by the S&P500 Index, commenced
a secular BEAR market during the first quarter of 2000, where "secular
bear market" is defined as a long-term downward trend in valuations
(P/E ratios, etc.) and gold-denominated prices. This secular trend will bottom sometime between 2014 and 2020. (Last update: 22 October 2007)
A secular BEAR market in the Dollar
began during the final quarter of 2000 and ended in July of 2008. This
secular bear market will be followed by a multi-year period of range
trading. (Last
update: 09 February 2009)
Gold commenced a
secular bull market relative to all fiat currencies, the CRB Index,
bonds and most stock market indices during 1999-2001. This secular trend will peak sometime between 2014 and 2020. (Last update: 22 October 2007)
Commodities,
as represented by the Continuous Commodity Index (CCI), commenced a
secular BULL market in 2001 in nominal dollar terms. The first major
upward leg in this bull market ended during the first half of 2008, but
a long-term peak won't occur until 2014-2020. In real (gold) terms,
commodities commenced a secular BEAR market in 2001 that will continue
until 2014-2020. (Last
update: 09 February 2009)
Copyright
Reminder
The commentaries that appear at TSI
may not be distributed, in full or in part, without our written permission.
In particular, please note that the posting of extracts from TSI commentaries
at other web sites or providing links to TSI commentaries at other web
sites (for example, at discussion boards) without our written permission
is prohibited.
We reserve the right to immediately
terminate the subscription of any TSI subscriber who distributes the TSI
commentaries without our written permission.
Outlook Summary
Market
|
Short-Term
(0-3 month)
|
Intermediate-Term
(3-12 month)
|
Long-Term
(1-5 Year)
|
Gold
|
Neutral
(17-Dec-08)
|
Bullish
(12-May-08)
|
Bullish
|
US$ (Dollar Index)
|
Neutral
(23-Mar-09)
| Neutral
(16-Feb-09)
|
Neutral
(19-Sep-07)
|
Bonds (US T-Bond)
|
Neutral
(18-Mar-09)
|
Bearish
(22-Sep-08)
|
Bearish
|
Stock Market (S&P500)
|
Bullish
(11-Mar-09)
|
Neutral
(02-Feb-09)
|
Bearish
|
Gold Stocks (HUI)
|
Bullish
(12-Jan-09)
|
Bullish
(12-May-08)
|
Bullish
|
| Oil | Bullish
(17-Nov-08)
| Neutral
(22-Sep-08)
| Bullish
|
Industrial Metals (GYX)
| Bullish
(26-Nov-08)
| Neutral
(22-Sep-08)
| Bullish
|
Notes:
1. In those cases where we have been able to identify the commentary in
which the most recent outlook change occurred we've put the date of the
commentary below the current outlook.
2. "Neutral", in the above table, means that we either don't have a
firm opinion or that we think risk and reward are roughly in balance with respect to the timeframe in question.
3. Long-term views are determined almost completely by fundamentals,
intermediate-term views by giving an approximately equal weighting to
fundmental and technical factors, and short-term views almost
completely by technicals.
The Relevance of the Fed
John Hussman wrote an article in August of 2001 titled "Why the Fed is Irrelevant". Commenting on this article in the 16th August 2006 Interim Update, we wrote:
"...Dr Hussman argues,
quite correctly in our opinion, that the Fed generally has very little
direct control over monthly or even yearly changes in the money supply
because:
a) The quantity of bank
reserves -- something over which the Fed does have considerable
influence -- no longer determines the amount of lending carried out by
commercial banks (the "money multiplier" taught in basic economics
courses no longer exists in any meaningful way)
b) These days, a lot of money is created outside the banking system
c) The Fed tends to follow market-controlled interest rates rather than lead them"
However, we went on to say:
"...there's a bigger
picture that will be missed by someone who draws conclusions about the
Fed's relevance based solely on what the Fed does during its day-to-day
operations. It's not, for example, a coincidence that during the 100
years prior to the creation of the Fed the US$ didn't lose any
purchasing power and that during the 93 years since the creation of the
Fed the US$ has lost more than 95% of its purchasing power. There's a
cause/effect relationship at work here.
The important point
missed by Dr Hussman is that it's the existence of the Fed that gives
the government the ability to issue huge (unlimited, actually) amounts
of debt. With the Fed in place the US Congress could vote to issue 10
trillion dollars of new debt tomorrow and if there were no other buyers
of this debt then the Fed would buy it all with newly created dollars.
If not for the Federal Reserve the US Federal Government would be a
relatively small institution that never went far into debt."
We remembered the "Why the Fed is Irrelevant" article when reading Dr Hussman's 23rd March 2008 commentary.
In this recent missive Dr Hussman rails against the latest plans of the
Fed-Treasury combo on the basis that these plans will crater the US$,
allow foreigners to purchase US assets at artificially low prices, and
mortgage the future of the US economy; all for the sake of preventing
the bondholders of US financial corporations from taking losses.
Perhaps he now understands why the Fed is not irrelevant.
On a related matter, some analysts have emphasised that today's
monetary system is credit based. Their point, as we understand it, is
that the private banks create credit and then, some time later, the Fed
boosts the monetary base to reflect the additional credit. That is, in
the realm of credit/money creation the Fed follows, rather than leads,
the private banking industry, the implication being that if the private
banks don't lend then deflation must occur.
These analysts are effectively making the same point that Dr Hussman
made in his August-2001 article, and it is a point that we agree with
to a certain extent. Again, however, we think the bigger picture is
being missed. For one thing, the banks only behave in this way (make
new loans without regard to their current reserves) because they know
that the Fed will always be around to top-up their reserves as needed.
In other words, even though the Fed usually doesn't provide the initial
monetary impetus to the credit expansion, it is the Fed's existence
that makes the unrestrained expansion of credit possible. For another
thing, when push comes to shove, as it has over the past seven months,
the Fed has shown itself to be quite capable of taking the lead in the
money-creation process. In fact, arguing at this time that the Fed
can't keep the supply of money and credit expanding in the face of
reduced lending on the part of the private banking industry is akin to
arguing that it can't rain whilst standing in the middle of a
rainstorm. It is happening right now and it has been happening since
last September.
The Stock
Market
The following decisionpoint.com
chart shows the NASDAQ Composite Index and the NASDAQ's McClellan
Oscillator (MO). The NASDAQ's MO reached its highest level in more than
20 years last Thursday.
The 20-year high in the MO indicated that the market was very
overbought on a short-term basis following Thursday's advance.
Furthermore, it was overbought at the same time as the NASDAQ was
nearing important resistance at around 1600. Not surprisingly, then,
the market pulled back on Friday.
While the market is
overbought on a short-term basis, it is not overbought beyond that. The
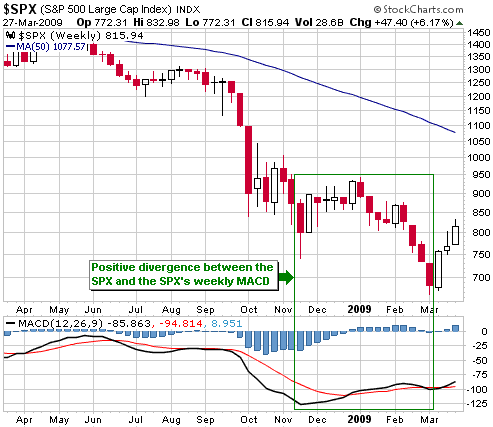
following weekly chart, for example, shows that the SPX was at a
multi-year low only three weeks ago. The chart also shows the positive
divergence between the SPX and the SPX's weekly MACD indicator that
developed between November and March (the MACD remained in an upward
trend while the SPX collapsed to new lows).
It would only take
one or two more days like last Friday to completely relieve the
market's overbought condition. Alternatively, the market could relieve
its overbought condition by trading sideways for a week or so.
In last week's Interim Update we said that price action and 150 years
of stock market history point to additional gains over the weeks and
months ahead. The price action we were referring to includes the strong
market breadth over the past three weeks, the almost total evaporation
of new lows for individual stocks, positive momentum divergences such
as the one mentioned above for the NASDAQ, and the fact that a number
of important stock indices, including the NASDAQ100, held above their
November-2008 lows earlier this month. With regard to the "150 years of
stock market history", we were referring to the fact that massive
declines such as occurred last year have always, in the past, been
followed by either a new bull market (very unlikely in this case) or a
strong counter-trend rebound lasting at least 6 months. The
November-January rebound was neither long enough nor strong enough to
qualify, which means that unless it's different this time then the bulk
of the obligatory multi-month rebound lies ahead.
This week's
important US economic events
| Date |
Description |
Monday Mar 30
| No important events scheduled
| Tuesday Mar 31
| Case Schiller Home Price Index
Chicago PMI
Consumer Confidence
| | Wednesday Apr 01
| ISM Manufacturing Index
Construction Spending
| | Thursday Apr 02
| Factory Orders
| | Friday Apr 03
| Monthly Employment Report
ISM Non-Manufacturing Index
|
Gold and
the Dollar
Gold
In our opinion, gold's ability to remain above an upward-sloping trend
line is a reason (perhaps the main reason) that the metal's pullback
from its late-February peak has not yet caused a meaningful reduction
in bullish enthusiasm. It looked like this trend line was going to be
breached on Wednesday 18th March, but then the Fed made an announcement
that prompted fear of US$ inflation and made sure the breach didn't
occur at that time.
As evidenced by the following daily chart of the April futures
contract, at the end of last week the gold market was poised at its
50-day moving average and was, again, threatening to break below its
upward-sloping trend line. Further weakness from here would take gold
below its trend-line and set up another test of the more important
lateral support that lies at around $890 (also shown on the following
chart). Due to the high level of optimism that currently exists, a
break below $890 would probably set off a wave of selling that would
ultimately take the gold price back to the low-$800s.

The following chart
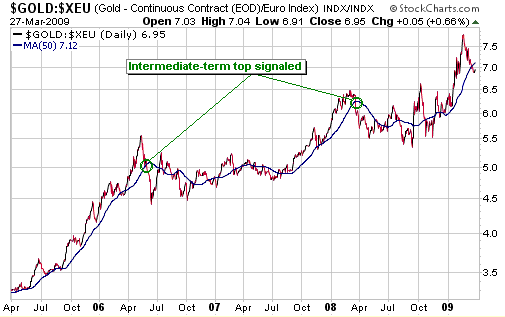
shows that gold is also at a critical level in euro terms. When
gold/euro is in an intermediate-term upward trend it tends to find
support near its 50-day moving average, with the first decisive break
below this moving average signaling the start of a lengthy
consolidation. Gold/euro was just below its 50-day moving average at
the close of trading last Friday, so any significant additional
weakness from here would strongly suggest that a multi-month peak was
put in place last month.
The point we are
trying to make is that the gold market is delicately balanced. It needs
to resume its upward trend almost immediately to avoid signaling a
larger-degree correction.
As an aside, don't believe the propaganda about the so-called shortage
of physical gold. No such shortage exists. From time to time there will
be a shortage of gold in one form or another due to mints
under-estimating the demand for certain products, but there is
currently no general shortage of physical gold and it's extremely
unlikely that such a shortage will arise anytime soon (if ever). A lot
more physical gold changes hands via the London Bullion Market
Association (LBMA) in an average week than is mined by the gold-mining
industry or consumed by the jewellery industry in an entire year, so
changes in mine supply or jewellery demand will never be important
drivers of the gold price. Also, a significant contango currently
exists across the entire gold futures spectrum, which suggests adequate
supply.
Gold Stocks
Current Market Situation
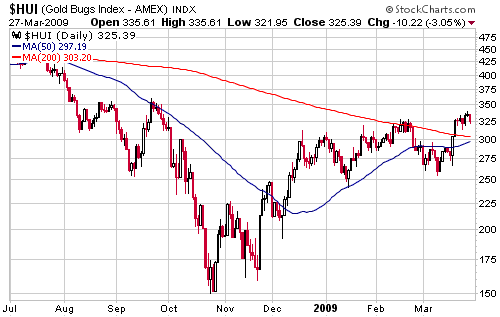
The HUI hit a new 5-month high on Thursday and then pulled back on
Friday. We have no opinion as to whether the pullback will continue
over the coming week or immediately give way to an advance to new
multi-month highs. What we can say is that if the pullback continues
then the HUI should find support at, or above, 300. As illustrated by
the following chart, the 50-day and 200-day moving averages are about
to come together at around 300. These moving averages should limit the
downside during any correction provided that the gold price remains
above support at $890.
There are never any
guarantees with regard to short-term outcomes in the financial world,
but all of the previous intermediate-term upward trends during the
course of the gold sector's long-term bull market have concluded with
multi-week rallies that took the HUI well above the highs of the
preceding few months. In other words, if history is any guide then last
week's move to a marginal new multi-month high should not be "all she
wrote".
Compounding errors by learning the wrong lessons
It is obviously important to learn from mistakes, but it is equally
important not to learn the wrong lessons. It seems to us that investors
often learn the wrong lessons and therefore compound their errors. We
are referring, in particular, to the tendency for investors to
automatically do in the present what they should have done, or wish
they had done, over the preceding 1-2 years. Based on emails we have
received and on what we have observed, the investing community's
collective appraisal of the merits of owning gold-mining shares
exemplifies this tendency.
By way of further explanation, we get the impression that by
October-November of last year many investors had come to the conclusion
that large-cap gold mining shares represented the second worst
investment idea ever, with the worst being small-cap gold mining
shares. This was not just because these shares had tanked along with
the broad stock market; it was also because they had tanked to a
similar extent as non-gold commodity stocks even while the price of
gold bullion was a) holding up well in US$ terms, b) rallying in terms
of most other currencies, and c) rocketing upward relative to almost
all other commodities. However, at the very time when many investors
were swearing never to buy another gold mining stock and never to go
anywhere near another junior gold mining stock, a phenomenal buying
opportunity was staring them in the face. This buying opportunity was
created by the simple fact that gold mining stocks were pummeled even
while the economics of the gold mining business were improving in leaps
and bounds.
Whether you were fortunate/smart enough to have stayed away from all
stocks during July-November of last year or were amongst the vast
majority of stock market investors that suffered large losses, the
wrong lesson to have learned was to steer clear of gold mining stocks.
Since the October-2008 bottom the AMEX Gold Mining Index (HUI) is up by
around 125% in nominal terms and 75% relative to gold bullion.
Moreover, this is very likely just the beginning. Over the coming two
years the senior gold stocks are likely to make large additional gains
in nominal dollar terms and significant additional gains in gold terms,
while the juniors, as a group, are likely to do much better than the
seniors. As a result, we think that two years from now the average
investor will have learned a very different lesson.
Regardless of how optimistic we are about the prospects of any
investment we will never express unbounded enthusiasm at TSI. There are
two reasons for this: First, there will always be a chance that we are
wrong. For example, we thought that gold's relative strength during
August-October of last year would support the gold mining sector, but
we were very wrong about that. Second, we don't want to encourage
people to take-on more risk than they should based on their own
financial situations and expertise. Therefore, when the gold sector was
bottoming between late October and late November of last year we didn't
say things like "this is one of the greatest buying opportunities the
world has ever seen" and "you are guaranteed to make a fortune if you
load up on junior gold shares at current prices". Here's what we did
say:
a) In the 20th October 2008 Weekly Update we wrote: "The gold sector is now at its most oversold extreme ever..." and "... this month's low will probably be the major variety (the type that sets the stage for a multi-year bull market)...".
b) In the 22nd October 2008 Interim Update we wrote: "...the longer-term outlook for gold and gold stocks is an order of magnitude more bullish today than it was in October of 1987" and "...the sharp rebound that follows the 2008 crash should prove to be the first leg of a new cyclical bull market".
c) In the email alert sent on 21st November 2008 we wrote: "Perhaps
there will be 1-2 more days of pain before the gold sector begins to
rally, but whether it begins today (Friday) or early next week we
suspect that the coming rally will be explosive".
d) In the 24th November 2008 Weekly Update we wrote: "The
similarities with the early 1930s potentially pave the way for a more
consistent upward trend in the gold sector over the next two years than
was seen during the two-year periods following the corrections of the
late-1960s and mid-1970s. In any case, regardless of whether we are
talking 1930s or 1970s we should now be in the early part of a new
multi-year upward trend in the gold sector".
e) In the 26th November 2008 Interim Update we wrote: "...we
not only view the break above 225 as confirmation that a short-term
bottom was put in place last month; we view it as confirmation that a
new 4-5 year bull market has begun. As mentioned earlier in today's
report and in previous commentaries, the gold sector's fundamentals
were improving over the past few months even while stock prices were
getting hammered in response to the global de-leveraging. This suggests
that the gold sector has a lot of catching up to do over the months
ahead."
The above excerpts are not presented to show that we were right (it's
way too early to tell if we were right to anticipate a new multi-year
bull market); they are presented to show that being too bullish about
the gold sector during the three months leading up to the 24th October
bottom didn't cause us to lose our objectivity and to compound our
error by failing to identify a great buying opportunity.
The lesson that should have been learned from last year's drama doesn't
revolve around the merits of any particular group of stocks; it
revolves around money/risk management. First, every investor should
embrace the reality that once in a while he/she will be completely
wrong about something, and, consequently, never put himself/herself in
the position where being wrong will create a big financial problem. One
aspect of this is to never be 'margined to the hilt' if you are a
full-time professional investor and to never be margined at all if you
are a part-time investor. Second, an investor should always be in the
position where he/she can take advantage of an unexpected opportunity
such as the one presented by the gold sector last October-November.
This involves maintaining a sizeable cash reserve at all times.
Currency Market Update
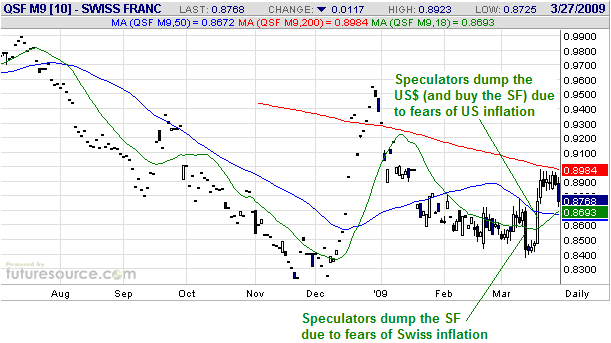
Referring to the following daily chart of the June Swiss Franc futures,
notice that there was a big down-day just over two weeks ago that was
followed, about a week later, by a big up-day. The down day was the
market's reaction to news that the Swiss National Bank was going to
inflate like crazy whereas the up day was the market's reaction to news
that the Fed was going to inflate like crazy. This truly is a race to
the bottom.
Most analysts use the
Baltic Dry Index (BDI) as an indicator of global trade, but we use it
primarily as a currency market indicator due to its tendency to bottom
at around the time the Dollar Index peaks and peak at around the time
the Dollar Index bottoms.
The following chart shows that the BDI has had an upward bias since
last November. This upward bias has coincided with a correction in the
Dollar Index (the Dollar Index reached a multi-year high last
November).
If the BDI can take out its recent peak it would be evidence that the
correction in the Dollar Index has not yet run its course.
Update
on Stock Selections
(Note: To review the complete list of current TSI stock selections, logon at http://www.speculative-investor.com/new/market_logon.asp
and then click on "Stock Selections" in the menu. When at the Stock
Selections page, click on a stock's symbol to bring-up an archive of our comments on the stock in question)
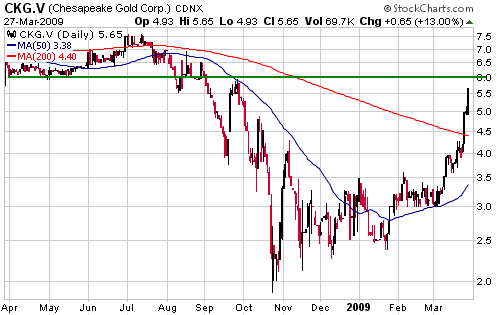
 Chesapeake Gold (TSXV: CKG). Shares: 38M issued, 43.5M fully diluted. Recent price: C$5.65 Chesapeake Gold (TSXV: CKG). Shares: 38M issued, 43.5M fully diluted. Recent price: C$5.65
In last week's Interim Update we wrote: "It
regularly happens that an under-valued junior with seemingly excellent
prospects lies dormant for a long time, and then suddenly, for no
apparent reason, springs to life." CKG's recent performance exemplifies what we were talking about.
The following chart shows that CKG traded as low as C$2.40 in January,
traded at C$3.00 early this month, and then suddenly sprang to life. It
closed at C$5.65 on Friday, up 13% on a day when most gold stocks fell
by a few percent.
There was no company-specific news over the past month, so CKG's sudden
up-move was not news-related. The price run-up could be in anticipation
of news, the reason being that a NI-43-101 resource estimate for the
company's flagship project (the Metates gold project in Mexico) is
likely to be reported within the next few weeks, or it could be related
to something else. We have no way of knowing. What we do know is that
the Metates project probably has 10M-20M ounces of gold and that if
this deposit is economic then CKG is extremely under-valued even after
its recent surge.
It may or may not be prudent for CKG shareholders to take some money
off the table in response to the recent price gains. It all comes down
to money management. On the one hand and as noted above, the stock is
probably very under-valued at its current price and market-moving news
is likely within the next few weeks. On the other hand, someone who
already had a sizeable position in CKG when the stock was trading in
the C$2.40-C$3.00 range during the first two months of this year may
now find himself/herself with an excessively large position. In this
case it may be appropriate to do some selling for money-management
reasons.
Another consideration is that the stock has resistance at around
C$6.00, although this resistance won't present much of an obstacle if
the upcoming resource estimate is positive.
CKG's recent surge
was caused by a fairly small increase in demand for the stock. Just
imagine, then, what junior gold stocks such as CKG will do once the
general public becomes an enthusiastic buyer.
 Australian Gold Stocks Australian Gold Stocks
Here are quick updates on our three Australia-listed gold stock selections:
1. Dominion Mining (ASX: DOM). Recent price: A$5.48
DOM has a low-risk/high-margin gold mine in South Australia and a
strong balance sheet, but at this time it doesn't have significant
in-house growth potential and is close to being fully valued. It will
probably make additional gains if the overall sector continues to trend
upward, but we don't see a good reason for it to outperform over the
months ahead. We are therefore going to remove DOM from the TSI List
and record a profit of 96% based on our July-2008 entry at $2.87 (the
profit calculation includes an 8c dividend).
2. Resolute Mining (ASX: RSG). Recent price: A$0.83
RSG traded below A$0.40 for a while in January, but is now 'on the
mend'. The stock was crushed due to a large and very poorly managed
capital raising -- a capital raising that got underway during the final
quarter of last year and ended up being priced at such a low level that
it destroyed a huge amount of shareholder value. The only way that
shareholders could have protected themselves from the effects of the
massive stock dilution was to 'double down' by participating in the
capital raising or by purchasing shares on market once a lengthy
trading suspension had ended.
Despite the value destroyed by poor management of the Q4-2008 capital
raising, a lot of value still remains in the shares assuming that the
company's management is better at building/operating mines than at
corporate financing. Based on past performance this certainly seems to
be the case.
Apart from the price of gold, the key to the stock's future performance
is the company's nearly-complete 250K-oz/yr Syama gold mine in Mali.
The Syama project is now in the final commissioning phase and if it can
operate at close to its design criteria then RSG's group of projects
should be able to produce about 400K ounces this calendar year and 500K
ounces in 2010 at a cost that results in substantial cash flow.
Assuming a gold price near the current level, this, in turn, should
enable the stock to move back to around A$2.00. By the same token, the
main risk is that Syama falls well short of its design criteria.
Due to the above-mentioned risk we do not view RSG as an ideal
candidate for new buying at the current price, but new buying would be
appropriate following a pullback to A$0.70-A$0.75. Also, investors who
bought a lot of RSG shares near the recent lows in the A$0.35-A$0.50
range, either by participating in the capital raising or by making
on-market purchases, should consider making a PARTIAL exit if the stock
trades up to around A$1.00 within the next few weeks.
3. Lion Selection (ASX: LST). Recent price: A$0.92
We think the market is greatly under-estimating the value of LST's
assets, especially the value of the company's recently-acquired 51%
stake in the development-stage Edna May gold project. In our opinion,
LST is a buy below A$1.00 and a strong buy below A$0.90.
Chart Sources
Charts appearing in today's commentary
are courtesy of:
http://stockcharts.com/index.html
http://www.futuresource.com/
http://www.decisionpoint.com/

|

