|
-- Weekly Market Update for the Week Commencing 30th March 2015
Big Picture
View
Here is a summary of our big picture
view of the markets. Note that our short-term views may differ from our
big picture view.
In nominal dollar terms, the BULL market in US Treasury Bonds
that began in the early 1980s ended in 2012. In real (gold)
terms, bonds commenced a secular BEAR market in 2001 that will continue
until 2018-2020. (Last
update: 20 January 2014)
The stock market, as represented by the S&P500 Index,
commenced
a secular BEAR market during the first quarter of 2000, where "secular
bear market" is defined as a long-term downward trend in valuations
(P/E ratios, etc.) and gold-denominated prices. This secular trend will bottom sometime between 2014 and 2020.
(Last update: 22 October 2007)
A secular BEAR market in the Dollar
began during the final quarter of 2000 and ended in July of 2008. This
secular bear market will be followed by a multi-year period of range
trading.
(Last
update: 09 February 2009)
Gold commenced a
secular bull market relative to all fiat currencies, the CRB Index,
bonds and most stock market indices during 1999-2001.
This secular trend will peak sometime between 2014 and 2020.
(Last update: 22 October 2007)
Commodities,
as represented by the Continuous Commodity Index (CCI), commenced a
secular BULL market in 2001 in nominal dollar terms. The first major
upward leg in this bull market ended during the first half of 2008, but
a long-term peak won't occur until 2014-2020. In real (gold) terms,
commodities commenced a secular BEAR market in 2001 that will continue
until 2014-2020.
(Last
update: 09 February 2009)
Copyright
Reminder
The commentaries that appear at TSI
may not be distributed, in full or in part, without our written permission.
In particular, please note that the posting of extracts from TSI commentaries
at other web sites or providing links to TSI commentaries at other web
sites (for example, at discussion boards) without our written permission
is prohibited.
We reserve the right to immediately
terminate the subscription of any TSI subscriber who distributes the TSI
commentaries without our written permission.
Outlook Summary
Market
|
Short-Term
(1-3 month)
|
Intermediate-Term
(6-18 month)
|
Long-Term
(2-5 Year)
|
|
Gold
|
N/A |
Bullish
(26-Mar-12) |
Bullish
|
|
US$ (Dollar Index)
|
N/A |
Bearish
(26-Jan-15) |
Neutral
(19-Sep-07) |
|
US Treasury Bonds (TLT)
|
N/A |
Neutral
(18-Jan-12)
|
Bearish |
|
Stock Market
(DJW)
|
N/A |
Bearish
(28-Nov-11) |
Bearish
|
|
Gold Stocks
(HUI)
|
N/A |
Bullish
(23-Jun-10) |
Bullish
|
|
Oil |
N/A |
Bullish
(17-Dec-14) |
Bullish
|
|
Industrial Metals
(GYX)
|
N/A |
Neutral
(15-Sep-14) |
Bullish
(28-Apr-14) |
Notes:
1. Our short-term expectations are discussed in the commentaries, but except in
special circumstances we won't attempt to assign a "bullish", "bearish" or
"neutral" label to these expectations.
2. The date shown below the current outlook is when the most recent outlook change occurred.
3. "Neutral" means that we think risk and reward are roughly in balance with respect to the timeframe in question.
4. Long-term views are determined almost completely by fundamentals and intermediate-term views
are determined by a combination of fundamentals, sentiment and technicals.
Last
week's posts at the TSI Blog
Why were the Commercials so wrong about the euro?
Expensive
Copper
Gold's price should be consistent with the prices of other things
The ECB is trying to follow
in the Fed's bubble-blowing footsteps
The monetary data published by the ECB last week showed that the rate of
euro-zone TMS (True Money Supply) expansion continued to accelerate in February
-- to a year-over-year growth rate of 11.8%, from 11.4% in January and 'only'
6.4% last October. Here's a chart that puts the current monetary inflation rate
into perspective.
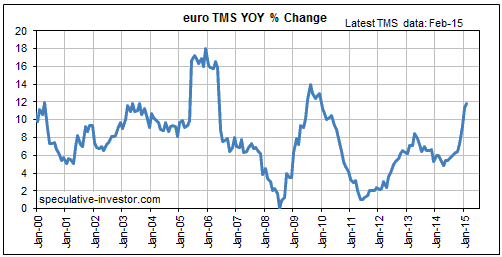
The ECB didn't begin its new QE program until March, so the above chart doesn't
include any of the effects of this new program. In fact, the effects of the new
program probably won't start becoming apparent until the April monetary data are
published in late-May.
In one way, the current situation in Europe is similar to the situation in the
US during the final few months of 2012. Back then, the Fed embarked on an
aggressive new money-pumping program despite the year-over-year rate of US TMS
growth already being in double digits and despite the prices of US stocks and
bonds being near multi-year or all-time highs. Now we have the ECB embarking on
an aggressive new money-pumping program despite the year-over-year rate of
euro-zone TMS growth already being in double digits and despite the prices of
European stocks and bonds being near multi-year or all-time highs.
The QE program introduced by the Fed in late-2012 did not help the US economy,
but it did inflate a new stock market bubble. It also encouraged stock buybacks
at the expense of capital investment, incentivised the continued accumulation of
debt at a time when both the private and public sectors were over-indebted, and
fostered an investment boom in the shale-oil industry that's now in the process
of collapsing.
Apart from the specific example of the oil-investment boom, it's possible that
the QE program introduced by the ECB this month will end up having similar
effects.
Oil and
Gas
Checking on oil's bottoming
process
The oil price needed to fall by more than $2/barrel on Friday to
avoid generating a bullish signal in the form of a weekly close
above its 10-week MA. Fall by more than $2 is what it dutifully did,
ending the week just below the aforementioned MA.
Based on the way the oil market has performed in the past in the
aftermath of a price collapse, when oil closes above its 10-week MA
it will suggest that an important price low is in place and that one
of the following is about to occur:
1) An upward trend lasting several months.
2) A few additional weeks of upside and then a decline to test the
low prior to the start of an intermediate-term upward trend.
We favour the second possibility, but first oil must signal a bottom
by making a weekly close above its 10-week MA.
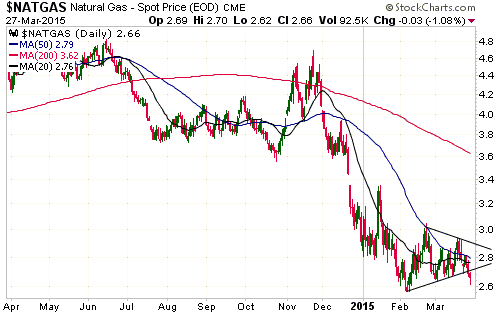
Natural Gas (NG) is also searching for a price bottom
The NG price broke out to the downside during the second half of
last week from what currently looks like a bearish consolidation,
which suggests that another leg down has begun. That's the obvious
interpretation, but we aren't confident that it's the right one.
Another possibility is that NG will do something along the lines of
what the Industrial Metals Index (GYX) did during the week before
last, which is reverse upward shortly after breaking out to the
downside.
Like oil, NG could be close to an important bottom, but, like oil,
it hasn't yet done anything to signal a bottom.
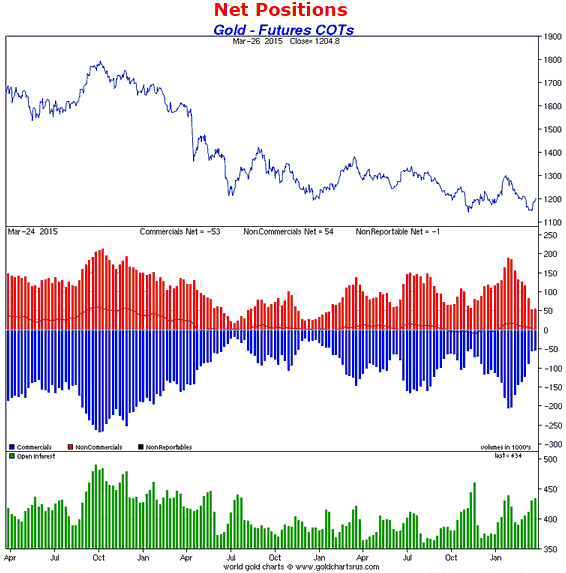
Commitments of Traders (COT)
Charts
A few of the markets we follow have interesting COT situations at the moment, so
for this week's report we've created a separate COT section. The charts
presented below are courtesy of
Sharelynx.com. On these charts, the blue bars show the net position of
commercials in the US futures market, the red bars show the net position of
large speculators, and the thin black line shows the net position of small
traders. We lump the large speculators and the small traders together under the
label "speculators".
1) Gold
The gold-price rebound that began on 18th March hasn't yet affected gold's COT
situation, in that the speculative net-long and the offsetting commercial
net-short positions on the COMEX remain close to their recent lows. This
indicates that the rebound was not driven by speculative buying in the futures
market, which is very unusual and is a short-term plus for the bulls. It's a
short-term plus because it means that there is still plenty of capacity for new
speculative buying.
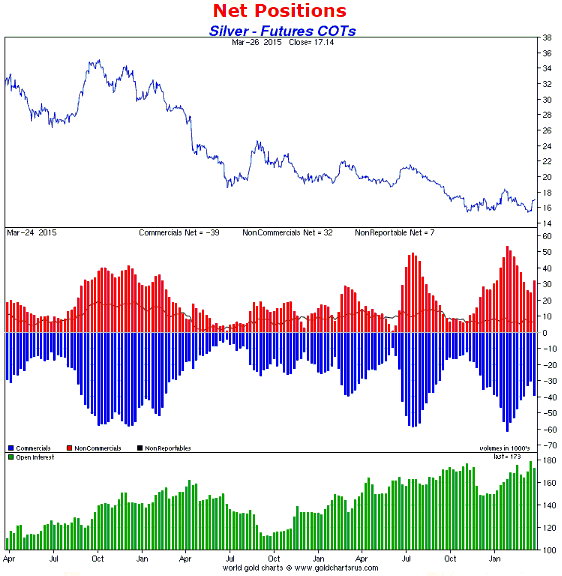
2) Silver
According to the COT data, there is presently a lot more speculative enthusiasm
for silver than for gold.
As illustrated below, the recent price rebound began with the speculative
net-long position at a higher-than-normal level for a price low, and there was a
surge in speculative buying during the first five days of the price rebound. The
speculative net-long position in silver futures is not yet high enough to signal
a precariously high level of optimism, but it's more than half way there.
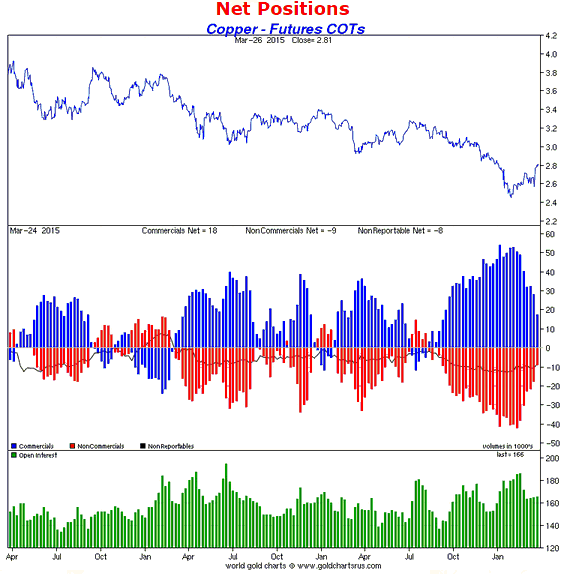
3) Copper
Over the past three years, short-term rebounds in the copper price have begun
with the speculative net-short position and the commercial net-long position
near multi-year highs and have usually ended at around the time that these net
positions were reduced to around zero.
The current COT situation indicates that there is scope for another test of
resistance at $2.90-$3.00 prior to the next short-term price top.
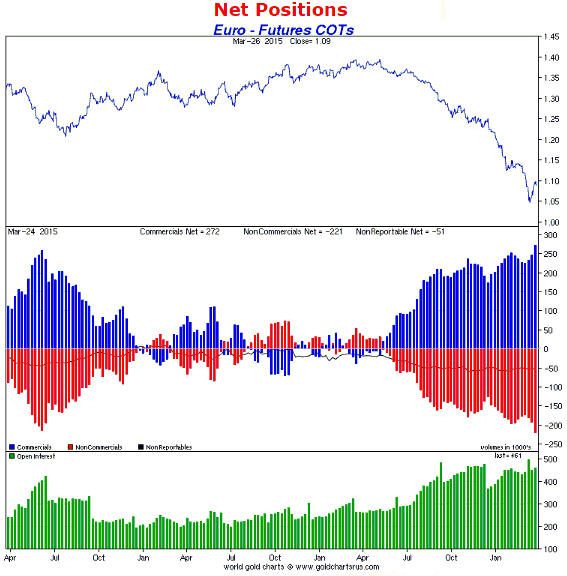
4) The Euro
The rebound in the euro that began on 18th March was accompanied by another wave
of speculative short-selling in the futures market. This is so unusual that we
don't know what to make of it.
It would be more typical for the speculative net-short position in euro futures
to peak just ahead of, rather than just after, a short-term price low, so on a
short-term basis last week's increases in the speculative net-short position and
the offsetting commercial net-long position to new all-time highs is not
bullish. However, the additional build-up in the speculative net-short position
means that there is now even more fuel to power an eventual euro rally.
The Stock
Market
The US stock market did what it needed to do
last week to remain in synch with the short-term bearish scenario that we favour.
Additional weakness is needed over the next several days to provide further
validation, or at least to avoid invalidation, of this scenario.
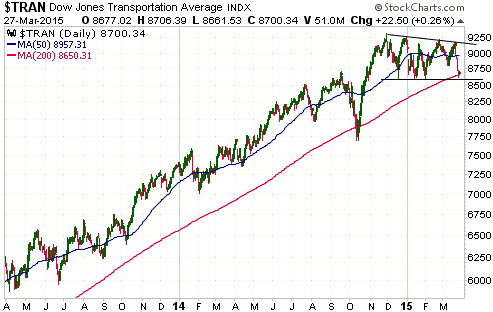
As noted in last week's Interim Update, the Dow Transportation Average (TRAN) is
likely to be one of the first important US stock indices to generate a clear-cut
short-term bearish signal. It would do this by closing below lateral support at
8600. This support was re-tested last Thursday.
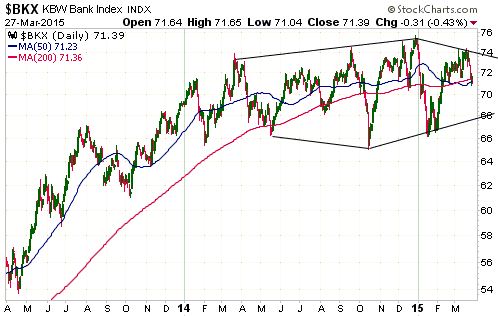
Due to its relative weakness over the past 12 months, the Bank Index (BKX) is
now in a position where it could be one of the first indices to generate a
long-term bearish signal. The BKX's potential major topping pattern is
illustrated below.
If the BKX follows the pattern of the past 12 months then it will rise to around
76 before making its next short-term top. However, last week's downward reversal
indicates that a short-term top could already be in place. If so, a decline to
below 66 on a weekly closing basis would generate clear-cut evidence of a major
top.
This week's
significant US economic events
(The most important events are shown
in bold)
| Date |
Description |
| Monday Mar 30 |
Personal Income and Spending
Pending Home Sales Index
Dallas Fed Mfg Survey | | Tuesday
Mar 31 |
Chicago PMI
Consumer Confidence
Case-Shiller Home Price Index | | Wednesday
Apr 01 |
Construction Spending
ISM Mfg Index | | Thursday
Apr 02 |
Factory Orders
International Trade Balance
|
| Friday Apr 03 |
Financial markets closed for Good Friday
Monthly Employment Report |
Gold and
the Dollar
Gold
The problematic comparison with the 1970s
We suspect that the gold bull market that began in 2001 is, in very rough terms,
an elongated version of the 1971-1980 bull market. Part of our reasoning is that
there is evidence in the performance of the gold-mining sector of a bullish gold
trend beginning in the early-1960s, with gold itself being unable to reflect
this bullish trend until 1971 when it was officially untethered from the US$.
At the point when the official link to the US$ was broken, the gold price was
like a coiled spring. After it was released it shot upward in spectacular
fashion to a high in 1974 and then plummeted to a low in 1976, all as part of
trying to find the level that best reflected gold's value under the new monetary
system.
Our point is that due to gold's price being fixed at $35/oz until 1971, what
would have been an 18-20 year bull market ended up being compressed into 9
years.
This time around the gold price has been free to fluctuate in response to
changing economic and financial-market conditions. As a result, the rise to the
2011 top was much longer and steadier than any of the cyclical advances of the
previous secular bull market and the decline from the 2011 top has also been
longer and steadier than the single cyclical decline of the previous secular
bull market.
A consequence of the gold price being fixed at $35/oz during what was, we think,
roughly the first half of the previous secular gold bull market is that it's not
possible to say something along the lines of "we are now at the equivalent of
point X from the previous bull market". For example, although using the
following weekly gold chart to make a superficial comparison of the two bull
markets could lead to the conclusion that the current bull market is near the
equivalent of the previous bull market's point B, we need to take into account
that the pattern of the 1970s partly results from the elimination of the advance
that would have taken place from the early to the late 60s if the gold price
hadn't been fixed. This 'missing' advance of the 1960s in the bullion market is
clearly evident on the chart of the Barrons Gold Mining Index (BGMI) displayed
below the gold chart.
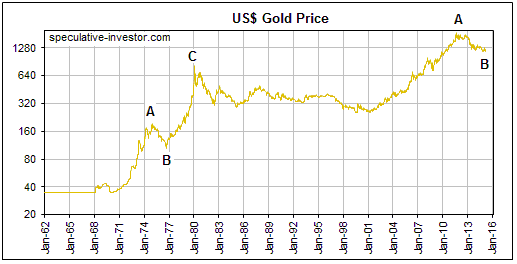
So, whereas a superficial view of the US$ gold price action could lead to the
conclusion that the present is the equivalent of somewhere in the 1976-1977
range, an argument could be made that the present is actually more like the
early-1970s. Although the gold price chart doesn't show it, the early-1970s was
really when the first cyclical decline of the earlier long-term gold bull market
came to an end. In addition, the position of the broad US stock market today
certainly has a lot more in common with 1972 than 1976-1977.
The fixing of the gold price during the 1960s also makes it difficult to
directly compare the secular bear market of the S&P500 relative to gold that
extended from the late-1960s to the early-1980s with the secular bear market
that began during 1999-2001. The reason is that if the gold price had been free
to fluctuate, the SPX/gold ratio most likely would have been in a downward trend
during the 1960s instead of having the slight upward bias shown on the following
chart.
At a superficial level the SPX/gold ratio's performance over the past few years
looks most similar to its performance during 1975-1976, but, again, this is
largely a result of gold's price being fixed prior to 1971.
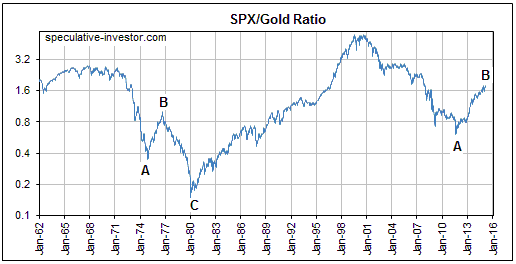
The prevention of an upward trend in the gold price during the 1960s and the
subsequent compression of a secular bull market into the space of only 9 years
gets in the way of direct chart-based comparisons between the current secular
gold bull market and the preceding one. That partly explains why such
comparisons have been unreliable, although it should always be kept in mind that
there are going to be significant differences between the current cycle and any
previous cycle.
Current Market Situation
Gold fell on 11 of the 12 trading days ending 17th March. It then rose for 7
trading days in a row, fully retracing its preceding near-vertical decline and
creating a classic 'V' bottom. Last Friday was the first down-day since the day
before the 18th March FOMC Statement, although Thursday's reversal following a
spike up to $1220 signaled that a near-term top was in place.
Last Thursday's upward price spike appeared to be a reaction to news that Saudi
Arabia's airforce was attacking targets in Yemen. The idea that gold should be
bought in response to military conflict remains a popular superstition, despite
the fact that the gold-price gains that are made on the back of such
developments are never sustained.
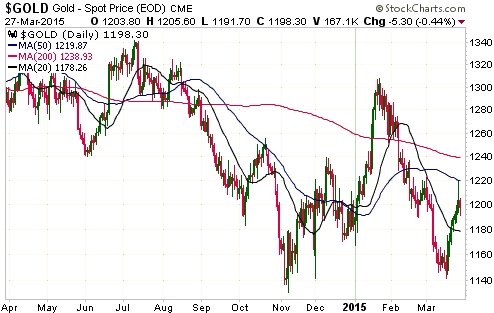
We suspect that gold just completed the first stage of a multi-week rebound,
with several days of consolidation in the $1175-$1205 range possibly lying
ahead. The 200-day MA near $1240 remains a viable target for the rebound.
Gold Stocks
To date, the HUI's rebound from its March low has been weaker than the rebounds
in gold and silver. Whereas gold managed to reach its 50-day MA before pulling
back and silver managed to exceed its 50-day MA, the HUI didn't get close to its
50-day MA (the blue line on the following chart) and wasn't even able to
accomplish a solid break above its sharply-declining 20-day MA (the black line
on the following chart).
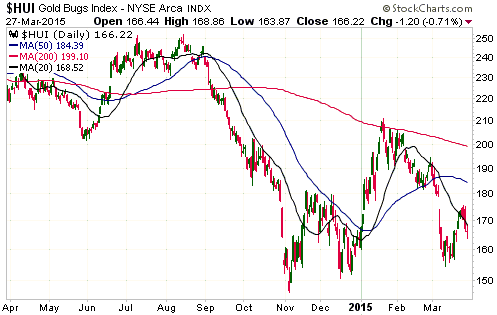
The lacklustre performance of the gold-mining sector last week doesn't offer any
clues as to what the coming week holds in store, although it is consistent with
the view that gold will probably break below last year's low before beginning a
major rally.
With the gold-mining indices trading near multi-year lows there are few signs of
meaningful strength among the individual gold stocks. However, as is always the
case, many individual stocks within the sector are positioned differently from
the indexes that represent the sector. Below are the charts of two that we
follow closely.
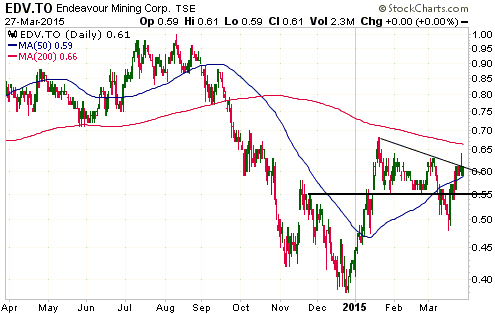
Unlike the HUI, which turned lower last week from well below its 50-day MA,
Endeavour Mining (EDV.TO) ended the week slightly above this moving average and
not far from a 5-month high. However, there appears to be enough resistance just
above the current price to prevent this stock from making significant additional
progress without some help from the gold-mining indices.
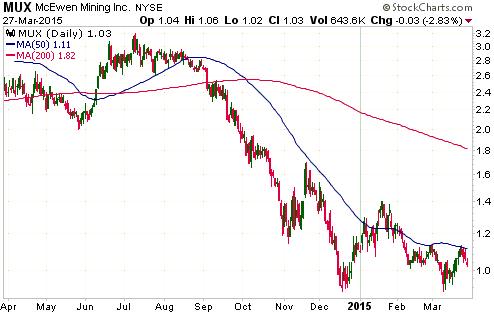
McEwen Mining (MUX) hasn't been as strong as EDV, but it did make it to the
50-day MA before reversing course last week. A daily close above the 50-day MA
would now suggest a near-term target of US$1.40, although, as is the case with
EDV, MUX probably won't make significant additional progress without some help
from the gold-mining indices.
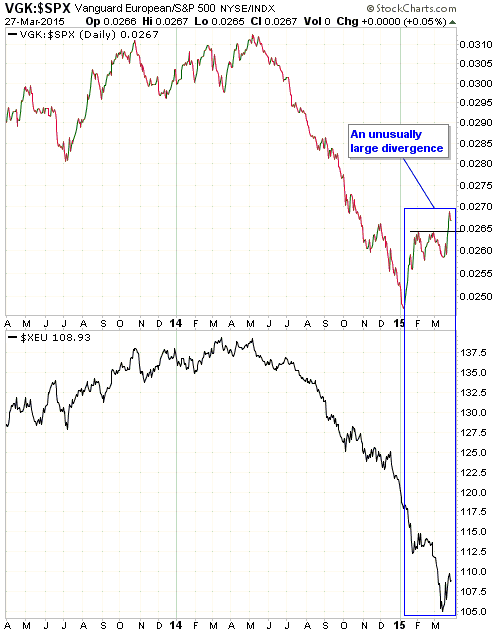
The Currency Market
The VGK/SPX ratio, our favourite measure of how European equities are performing
relative to US equities, broke out to a new high for the year last week. This
accentuated the divergence between relative equity performance and the euro that
began to develop in early-January.
It's possible that the small but not trivial risk of a Greek exit from the
euro-zone ("Grexit") is getting in the way of a decent euro rebound. On the
surface it could seem like the euro-zone would be stronger without Greece, but
this ignores the interconnectedness of banks and the extent to which the ECB and
other supranational organisations are exposed to Greek government debt. It also
ignores the risk of default that would immediately have to be priced into the
bonds issued by other 'peripheral' euro-zone governments. In particular, if the
Greek government were permitted to default on its debt, there would likely be a
rush to get out of the bonds issued by Portugal, Spain, and a few other
euro-zone governments.
Bear in mind that at no point over the past few years has Greece or the
government of Greece been bailed out. The holders of Greek government bonds were
the ones who were bailed out at the expense of taxpayers and savers throughout
the euro-zone. The Greek government ended up being saddled with a vastly greater
debt burden, the people of Greece ended up with higher taxes, and people
throughout the euro-zone were indirectly put on the hook by virtue of the
transfer of Greek government default risk from private banks and other
bondholders to public institutions such as the ECB. This created the perception
that buying the bonds of bankrupt euro-zone governments was risk-free. Something
that challenges this perception could create a financial crisis.
The probability of "Grexit" happening within the next few months is small, but
it isn't zero. If it does happen it will, we think, precipitate a banking, debt
and financial-market crisis in the euro-zone that results in panic buying of
both the US$ and gold.
Updates
on Stock Selections
Notes: 1) To review the complete list of current TSI stock selections, logon at
http://www.speculative-investor.com/new/market_logon.asp
and then click on "Stock Selections" in the menu. When at the Stock
Selections page, click on a stock's symbol to bring-up an archive of
our comments on the stock in question. 2) The Small Stock Watch List is
located at http://www.speculative-investor.com/new/smallstockwatch.html
 Company
news/developments for the week ended Friday 27th March 2015: Company
news/developments for the week ended Friday 27th March 2015:
[Note: AISC = All-In Sustaining Cost, FS = Feasibility Study, IRR = Internal
Rate of Return, MD&A = Management Discussion and Analysis, M&I = Measured and
Indicated, NAV = Net Asset Value, NPV(X%) = Net Present Value using a discount
rate of X%, P&P = Proven and Probable, PEA = Preliminary Economic Assessment,
PFS = Pre-Feasibility Study]
*Asanko Gold (AKG) advised that it plans to spend $2M in 2015 on
exploration near the deposits that form Phase 1 and Phase 2 of the Asanko gold
mine in Ghana. This is a small budget considering AKG's financial resources and
the high probability that there's a lot more gold to be discovered on the
company's existing tenements, but it's a reasonable budget considering the
market environment and the importance of remaining focused on mine engineering
and construction.
*Dalradian Resources (DNA.TO) published its financial results for
the year ending 31st December 2014. According to these results, the company had
C$30M of working capital at the end of last year.
Accounting for spending and the C$19.6M raised since the end of last year, the
company probably now has C$45-C$47M of working capital. This will be more than
enough to fund 2015's costly work program involving drilling, bulk sampling and
detailed mine planning, which aims at having a completed PFS before year-end.
*Golden Star Resources (GSS) reported a large reduction in P&P
reserves and a small increase in M&I resources across its projects in Ghana. The
large reduction in reserves was due to a change in mining strategy at the Wassa
project (from open-pit to open-pit plus underground), the removal of the Prestea
Underground reserves pending the completion of a revised FS in mid-2015, and
some parts of the Bogoso resource being rendered uneconomic by the lower gold
price.
GSS also reported the results of the FS for the new Wassa mining strategy, which
involves changing the mine from open-pit to a combined open-pit and underground
operation. The FS follows up on the PEA published last September.
At the $1200/oz gold price assumed in the study it makes economic sense to add
the underground operation to the existing open-pit mine at Wassa. The result
would be a lower-cost and more profitable operation with a higher IRR. Financing
is the problem. Although the estimated pre-production capex for the
transformation is only about $40M, GSS does not appear to have sufficient
balance-sheet strength to fund this capex. That being said, orders have
apparently been placed for some of the underground equipment, so GSS's
management obviously has something in mind for the financing.
The precarious condition of GSS's balance sheet makes it too risky for new
buying at the current gold price. For this stock to be worth the risk there
would probably have to be either a sustained rise above $1300/oz in the gold
price or a substantial injection of new capital.
*Pilot Gold (PLG.TO) published its financial results for the year
ending 31st December 2014. According to these results, the company had US$17.8M
of working capital at the end of last year.
PLG's 2015 exploration budget is for expenditure of $1.6M at the Kinsley
Mountain project in Nevada, $4.6M at the TV Tower project in Turkey and $0.3M at
the Halilaga project in Turkey. It therefore has more than enough cash to fund
this year's work program, although the company will probably look for an
opportunity during the second half of this year to top up its treasury.
*Pretium Resources (PVG) provided us with the most important
company-specific news of the week when it announced that it has been issued an
environmental assessment certificate for the Brucejack gold project by the
British Columbia Minister of the Environment and Minister of Energy and Mines.
This means that PVG now has Province-level environmental approval for the
Brucejack project. Federal approval is still pending. If all goes according to
plan, Federal approval will be obtained during the second quarter of this year.
*Timmins Gold (TGD) advised that shareholder meetings to approve
the takeover of Newstrike Capital (NES.V) will take place on 29th April.
TGD also advised that the C$10M private placement that was originally expected
to occur in conjunction with the approval of the NES takeover has been cancelled
"due to current market conditions". In other words, with the stock price below
C$1 the investors that had previously agreed to buy shares at C$1.25/share
balked and the company let them off the hook.
*True Gold Mining (TGM.V) announced that it has found a new CEO.
TGM's new CEO is Christian Milau, who, prior to last week, was the CFO of
Endeavour Mining.
This is a good hire by TGM, because as part of EDV's senior management team Mr.
Milau had success in doing exactly what TGM's previous CEO failed to do, which
is to work with all stakeholders to ensure that a new mining development does
not run into any governmental or community-relations obstacles. Also, Milau's
decision to make this move is a knowledgeable vote of confidence in the
potential of TGM's Karma project, because the decision would only have been
taken after doing careful study of the situation on the ground in Burkina Faso.
Despite this positive development, we would continue to hold off on new buying
of TGM shares until it is clear that the reasons for the suspension of
construction activities have been addressed and a construction re-start date has
been confirmed.
List
of candidates for new buying
From within the ranks of TSI stock selections the best candidates
for new buying at this time, listed in alphabetical order, are:
1) AKG (last Friday's closing price: US$1.50).
2) EDV.TO (last Friday's closing price: C$0.61).
3) EVN.AX (last Friday's closing price: A$0.84).
4) MUX (last Friday's closing price: US$1.03).
5) TGD (last Friday's closing price: US$0.75).
Note that the above list is limited to five stocks. It will
sometimes contain less than five, but it will never contain more
than five regardless of how many stocks are attractively priced for
new buying.
Chart Sources
Charts appearing in today's commentary
are courtesy of:
http://stockcharts.com/index.html

|
