


--
Weekly Market Update for the Week Commencing
30th July 2018
Big Picture
View
Here is a summary of our big picture
view of the markets. Note that our short-term views may differ from our
big picture view.
The BULL market in US Treasury Bonds
that began in the early 1980s ended in mid-2016, but there will be many years
of topping action in bond prices and bottoming action in bond yields before
major new trends get underway. A major decline in government bond prices will
unfold during the 2020s. (Last update: 11 September 2017)
The stock market, as represented by the S&P500 Index,
commenced
a secular BEAR market during the first quarter of 2000, where "secular
bear market" is defined as a long-term downward trend in valuations
(P/E ratios, etc.), gold-denominated prices and inflation-adjusted prices. This secular trend will bottom
in 2020 or later.
(Last update: 11 September 2017)
A cyclical BEAR market in the
US
Dollar
began in 2016-2017.
(Last
update: 11 September 2017)
Gold commenced a
secular bull market relative to all fiat currencies, the CRB Index,
bonds and most stock market indices during 1999-2001.
This secular trend will peak in 2020
or later.
(Last update: 11 September 2017)
Commodities,
as represented by the CRB Index, commenced a
secular BULL market in 2001 in nominal dollar terms. The first major
upward leg in this bull market ended during the first half of 2008, but
a long-term peak won't occur until 2020 or later.
(Last
update: 11 September 2017)
Copyright
Reminder
The commentaries that appear at TSI
may not be distributed, in full or in part, without our written permission.
In particular, please note that the posting of extracts from TSI commentaries
at other web sites or providing links to TSI commentaries at other web
sites (for example, at discussion boards) without our written permission
is prohibited.
We reserve the right to immediately
terminate the subscription of any TSI subscriber who distributes the TSI
commentaries without our written permission.
True
Fundamentals Summary
[Notes:
1) The date shown next to the current True Fundamentals Model (TFM) signal is
when the most recent change occurred. 2) Charts of the Gold and Equity
TFMs are included in the "Charts and Indicators" section of the TSI web
site]
|
Market |
True Fundamentals Model (TFM) |
|
Gold (US$ Price) |
Bearish (20 Jul 2018) |
|
US Equity (SPX) |
Bearish (29 Jun 2018) |
|
Currency (Dollar Index) |
Bullish (27 Apr 2018) |
|
Commodities (GNX) |
Bearish (01 Jun 2018) |
Last week's posts at the TSI Blog
The
"Productivity of Debt" Myth
Summary of current
thinking/positioning
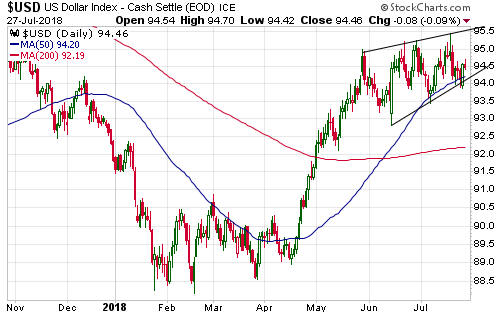
1) Despite numerous attempts,
the Dollar Index (DX) has failed to close above resistance at 95. This
leaves us expecting a DX decline to 92 and a euro rally to 1.20 within the
next 1-2 months.
2) There is a good set-up for counter-trend
rallies in the gold and silver markets, but upward reversals have not been
signaled. This leaves the door open to new 2018 lows prior to meaningful
rallies getting underway.
3) Last week's breakdown by the HUI/gold
ratio warns that the gold-mining indices may extend their downward trends
into August. The risk is that there will soon be the speculative
capitulation in this sector that has been resolutely avoided to date. We
have substantial exposure to the gold-mining sector and have hedged
against this short-term risk via GDX put options.
4) There are
numerous divergences within the US stock market. With monetary conditions
tightening, the short-term downside risk appears to be high.
5)
Most industrial commodities probably will remain in correction mode for
another 2-3 months, although as expected the industrial metals markets are
rebounding from 'oversold' extremes.
6) The T-Bond price should
have an upward bias for another 2-3 months.
7) We are holding a
cash reserve of around 30% and looking for opportunities to build up this
reserve.
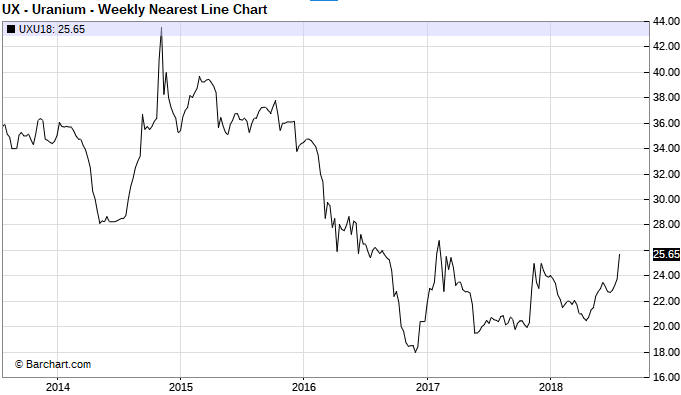
Uranium catches a
bid
The uranium price gained about
$2/pound last week and is now close to its highest level in 2 years,
although on a long-term basis it remains very low.
The catalyst for last week's surge was an announcement by Cameco (CCJ)
that what had been planned as a 10-month shutdown of its Key Lake mill and
McArthur River mine would go on indefinitely. According to Cameco's CEO,
the long-term global outlook for the industry remains positive, with 57
new nuclear reactors planned including 14 expected to come on-line this
year. At the same time, an oversupply has kept prices so low that it is
cheaper to buy in the spot market than to produce, which is exactly what
Cameco intends to do at times to fulfill its supply contracts.
Does
the recent market action mean that the uranium price has completed the
basing pattern that began to form in late-2016?
We don't know. We
gave up a few years ago trying to predict when the next uranium bull
market would begin. However, it doesn't take much to excite speculators in
uranium-mining equities. As a result, strong rallies in the uranium-mining
sector periodically occur even with no evidence of substantial improvement
in the commodity's long-term prospects. With or without a new bull market
it's possible that another of these rallies has begun.
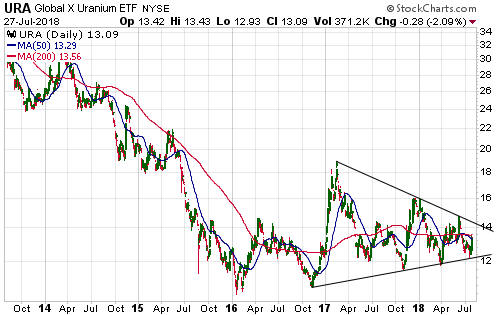
It would be
reasonable to buy the
Global X Uranium ETF (URA) for a trade near its current price in the
low-US$13 area as long as the risk of loss was limited to around 10% by
placing a daily-closing stop at US$11.75-$11.80.
Tariffs are
taking their toll
In most cases the superficial
short-term effects of bad government policy are positive, hence the appeal
of the policy, with the negative effects being far-enough removed (in
time) from the policy implementation to be blamed on something else. In
this regard tariffs and other protectionist measures are unusual, in that
both the long-term and the short-term effects are blatantly negative. For
example, some negative effects of the steel and aluminium tariffs
implemented by the Trump administration a few months ago are already
obvious.
Signs of the aforementioned negative effects have
appeared in the latest earnings reports and forecasts issued by numerous
US corporations. Here are four examples from just the past week:
1)
Ford, GM and Fiat Chrysler have warned of lower profits and higher costs
due to steel and aluminium tariffs.
2) Coca Cola has stated that it
is going to hike its selling prices due to the aluminium tariffs.
3) Oil driller ConocoPhillips has warned that steel tariffs imposed by the
Trump administration are driving a significant increase in costs.
4) Plains All American Pipeline has appealed to Congress for relief from
higher steel prices. According to the company, the tariffs will add $40
million to the cost of the new pipeline it is building.
The
increasing cost of doing business in the US due to the tariffs imposed on
imports implies, correctly, that a tax on imports is economically
equivalent to a tax on exports. The fact is that imports are often used to
make exports, so government decisions that push up the prices of imports
will increase the cost, and ultimately reduce the quantity, of exports,
even if other governments do not retaliate by imposing their own import
tariffs. In other words, Trump is effectively imposing tariffs on US
exports, and when Xi Jinping retaliates in kind he is effectively imposing
tariffs on Chinese exports. Wouldn't it be nice if the people with the
power to make decisions that have major economic effects actually
understood economics.
Most government interventions in the economy
cause problems that provide the 'justification' for additional
intervention, but due to time lags it is often difficult for the layman to
see the link between the perceived need for new intervention and the
unintended negative consequences of earlier intervention. In this respect
tariffs are again unusual in that the perceived need for new intervention
stems directly and almost immediately from the earlier intervention. The
appeal by Plains All American Pipeline for government relief is one
example. Another example is Trump's decision last week to extract $12B of
savings from the economy to be used to help US farmers who have been hurt
by the Chinese tariffs that predictably were put in place in reaction to
US tariffs.
There's still a chance that commonsense will prevail
and that the obvious negative effects of protectionist measures and
counter-measures will prompt governments around the world to change
course. If so, Trump's "bull in a china shop" approach to international
trade ultimately could have some positive ramifications. However, the
current course is the shortest route to what is sometimes called
"stagflation" -- the combination of economic weakness and rapidly-rising
living costs.
Add "stagflation"
to the long-term downward forces on bond prices
The market for long-dated US
Treasury securities, as represented on the following chart by TLT, is in
the process of completing a major topping pattern. The topping pattern
began to form well before there was any inkling that a "trade war" would
put upward pressure on consumer prices, so Trump's protectionist measures
are not the reason that the long-term trend towards higher bond prices
(lower interest rates) has ended. However, obstacles that are put in the
way of international trade will exacerbate the new trend towards lower
bond prices (higher interest rates) by increasing the fear of price
inflation and reducing foreign investment in US bonds (every dollar
reduction in the US trade deficit equals a dollar reduction in the US
investment surplus).
TLT's long-term topping pattern probably will complete within the next
9 months, but not within the next 3 months. With the total speculative
net-short position in 10-year T-Note futures still near an all-time high,
T-Bond strength is more likely than T-Bond weakness in the short-term.
The Stock Market
The Fed's QT
The Fed is implementing Quantitative Tightening (QT) by not
reinvesting the proceeds of maturing securities. The securities mature in
batches, generally at the end of a month but sometimes in the middle of a
month. Consequently, the QT happens in chunks rather than at a steady
pace.
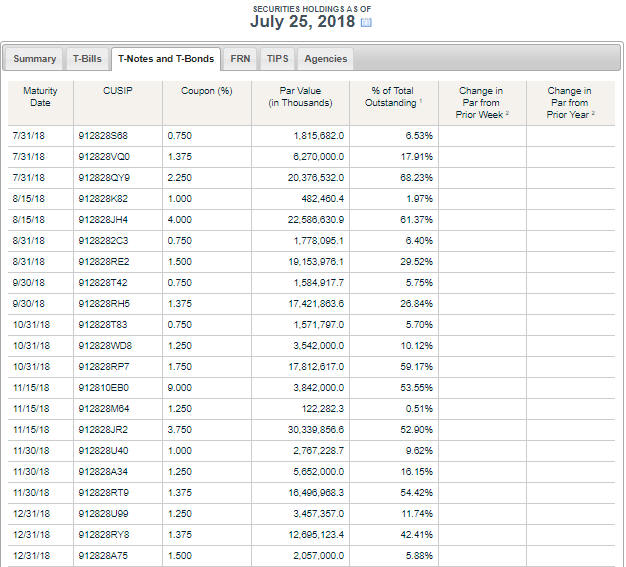
Displayed below is part of the
maturity schedule for the Fed's holdings of Treasury securities. It
reveals that within the coming five weeks there will be three QT chunks,
with the associated maximum amounts of money removal being approximately
$28B on 31st July, $23B on 15th August and $21B on 31st August. This means
that over the coming few weeks the Fed's QT could be a significant
negative force on financial asset prices.
Current Market Situation
In last week's
Interim Update, we wrote:
"The Russell2000 Index (RUT) has
tested its June high twice without closing above it. This is not bearish
price action, as it may just be consolidating prior to resuming its rally.
A daily close below the 50-day MA would be the first chink in the RUT's
bullish armour.
Speculators who are betting against the RUT, for
example, by owning TWM (UltraShort Russell2000), should now risk a weekly
close or consecutive daily closes above 1710."
The first chink
in the RUT's bullish armour (a daily close below the 50-day MA) appeared
on Friday 27th July. It doesn't yet look like a reversal of consequence,
but reversals of consequence in the US stock market usually don't look
like much in their early days. It usually takes a while for selling
pressure to build to the point where it overwhelms support provided by
dip-buying.
The NASDAQ100 Index (NDX), the strongest of the high-profile US stock
indices, made a new all-time high on Wednesday of last week and then
reversed course. The reversal does not look significant at this time,
although it was of sufficient size to create an 'outside down' week (a
week with a lower close that trades above the high and below the low of
the preceding week). Also, as mentioned above, reversals of consequence in
the US stock market usually don't look like much in their early days.
The following daily chart shows QQQ, the ETF that tracks the NDX. The
channel drawn on the chart originates at the November-2016 Presidential
election low.
There is currently one bearish stock-market speculation in the TSI
Stocks List: the IWM (Russell2000 ETF) September-2018 $150 put option.
This position was added about two weeks ago. Due to last week's price
reversal, sentiment, the Fed's tightening, divergences between indices,
signs of weakness in market internals and negative seasonality that
extends from mid-July through to early-October, we are now adding another
equity-focused bearish speculation to the TSI List in the form of the QQQ
October-2018 $150 put option. Friday's closing bid-ask spread for this
option was US$0.87-US$0.94 and the last sale was at US$0.89. For record
purposes we'll set our entry price at US$0.91.
Buying QID
(UltraShort QQQ) would be an alternative to buying the aforementioned QQQ
put option.
For any bearish speculations currently held or bought
in the near future it would be prudent to place a daily-closing stop
slightly above the high of the past two months. For example, speculators
betting against QQQ could risk a daily QQQ close above $183.
This week's
significant US economic events
[Notes:
1) The most important events
(to the markets) are shown
in bold. 2) A list of global economic events can be found
HERE]
| Date |
Description |
|
Monday Jul-30 |
Pending Home Sales |
|
Tuesday Jul-31 |
Employment Cost Index
Chicago PMI
Personal Income and Spending
Case-Shiller Home Price
Index
Consumer Confidence |
|
Wednesday Aug-01 |
ISM Mfg Index
Construction Spending
FOMC Announcement
Motor Vehicle Sales |
|
Thursday Aug-02 |
Factory Orders |
|
Friday Aug-03 |
Monthly Employment
Report
Trade Balance
ISM Non-Mfg Index |
Gold and the Dollar
Gold
In
last week's Interim Update we discussed the extreme negativity towards gold
indicated by the Consensus-inc survey. We wrote: "Based on the historical
record of this sentiment survey, the current negativity extreme does NOT imply
that an intermediate-term upward trend will soon get underway. However, it does
imply that a multi-month price bottom is close (in terms of time) and that a
rebound of at least $100 will soon get underway."
The RSI shown at
the bottom of the following weekly gold-price chart is another reason to expect
that a rebound of at least $100 will soon get underway. The weekly RSI(14) is
now very close to 30 and the last three times it got this low (indicated by
arrows on the chart) the gold price traded at least $100 higher within the
ensuing three months, even in the case (October-2014) when the low RSI reading
didn't mark the price low.
There are, however, three reasons to be cautious and not blindly assume that
an upward reversal is imminent. They are:
1. The COT situation is
supportive, but not decisively so because the open interest in gold futures is
too high. Important lows in the gold price tend to go with relatively low open
interest.
2. A decline in the weekly RSI to around 30 was a reliable
indicator of a multi-month price low over the past four years, but in 2013 there
was a large and fast price decline after the weekly RSI reached 'oversold'
territory.
3. The fundamental backdrop is bearish for gold at this time.
Until an upward reversal is signaled via a daily close above $1240 there
will be a risk of a final decline to a new 12-month low. As illustrated by the
following daily chart, no upward reversal has been signaled yet. A decline to a
new low probably would take the form of a downward spike to the $1190s, but
there's a risk of a larger decline. The most likely catalyst for a larger
decline would be an upside breakout in the Dollar Index.
Silver
Like the gold market, the silver market has
not yet signaled an upward reversal. The US$ silver price has initial resistance
in the $15.60s, which was tested last week, followed by resistance at $15.80. An
upward reversal (a short-term bottom) would be signaled by a daily close above
$15.80.
Despite the substantial weakness in the silver price over the past 6 weeks,
silver's COT situation is only slightly supportive. As is the case with gold,
the open interest in silver futures is too high. In any case, silver should
rally when gold rallies.
Gold Stocks
From the
second half of March through to early-July there was strength in the gold-mining
sector relative to the bullion market, involving an upward-trending HUI/gold
ratio and higher lows in the HUI in parallel with lower lows in the bullion
market. Unlike many other analysts, we never viewed this relative
strength/resilience on the part of the gold-mining sector as a significant
bullish divergence. On the contrary, we were concerned that it reflected an
undercurrent of stubborn optimism.
It's important to understand that a
divergence between the gold-mining indices and the gold price that involves
relative strength in the gold-mining indices is not inherently bullish. In fact,
such a divergence is only a reliably-bullish development when it occurs during a
short-term downward correction within the context of an intermediate-term upward
trend. In particular, if both gold and the gold-mining indices are in
intermediate-term upward trends, which wasn't the case over the past several
months, then a market correction that results in lower multi-week lows for gold
in parallel with higher multi-week lows for the HUI constitutes a bullish
divergence.
If gold and the mining indices are not in intermediate-term
upward trends then the best rallies are set up by dramatic relative WEAKNESS,
not modest relative strength, in the mining indices.
Our most recent
comments on gold mining relative strength were in the 16th July Weekly Update.
At that time we wrote:
"There has been strength in the gold-mining
indices relative to gold bullion since March, but at this point the strength has
the look of a counter-trend rebound. With regard to this relative strength, the
following chart shows that a) the HUI/gold ratio has just turned down shortly
after moving above its 150-day MA, and b) the previous four times it did
something similar it dropped to at least a 2-month low before making a
short-term bottom.
To signal that its current rebound is more significant
than the other rebounds of the past 18 months, HUI/gold should hold above its
150-day MA during any additional corrective activity and then break above its
early-July high."
The following chart shows that last week the
HUI/gold ratio broke below its 150-day MA. In doing so it stayed consistent with
the pattern of the past 18 months.
If the pattern continues then within
the coming two months the HUI/gold ratio will decline to below its March low.
The pattern would be altered -- and a more bullish market environment signaled
-- by the HUI/gold ratio bottoming above its March low and then moving above its
early-July high.
In last week's Interim Update we noted that GDX (the Gold Miners ETF) had
just rebounded by a small amount after testing support defined by its lows of
the past 12 months ($21.00-$21.25). GDX re-tested that support on Friday.
The HUI's position is both different and similar. It is different in that
the HUI has just made a new 12-month low, but it is similar in that the HUI is
also testing the bottom of its intermediate-term range. It's just that in the
HUI's case the range has a downward slope as illustrated below.
The
gold-mining sector has reached a critical juncture. The indices/ETFs will either
hold support near their current levels and soon commence 2-4 month rallies OR
break below support and accelerate downward. The former outcome has the higher
probability, but due to last week's decline in the HUI/gold ratio and the fact
that the bullion market hasn't generated any evidence of a bottom we should be
prepared for the possibility that the latter outcome will happen. The best way
to be prepared is to have a substantial cash reserve.
With regard to our
own accounts, over the past couple of months we have taken some opportunities to
raise cash. However, we have also done some buying when our favourite stocks
became 'too cheap'. As a result, we are not as 'cashed up' as we would like to
be (we are about 30% in cash at the moment). Due to having less cash than we
would like, late last week we purchased insurance (against a short-term
gold-mining capitulation) in the form of GDX $20 September put options. These
options will quickly lose most of their current market value if support holds
and the gold-mining sector begins to recover, but they will gain a lot of value
if a near-term breach of support leads to panicked selling of gold stocks.
The risk of a near-term gold-mining capitulation would be greatly diminished
by a daily close above $1240 in the gold price.
The Currency
Market
The Dollar Index (DX) remains within its "rising wedge",
the top of which is now at around 95.5. This pattern could be either a
short-term top or a consolidation within an on-going upward trend.
The
euro is almost the mirror image of the DX, which is not surprising since the
US$/euro exchange rate is almost 60% of the DX. The euro has been tracing out a
pattern that could be either a short-term bottom or a consolidation within an
on-going downward trend.
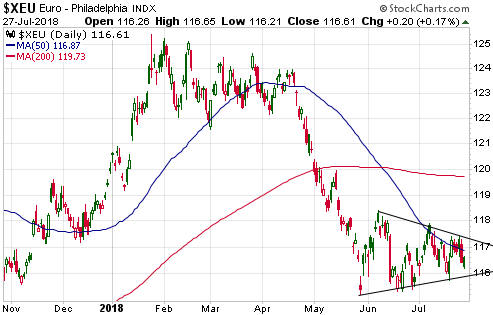
There will soon be a breakout in the DX and an opposite breakout in the euro.
Fundamental influences continue to favour the US$ over the euro, but general
currency-market sentiment puts the odds in favour a near-term downside breakout
in the DX.
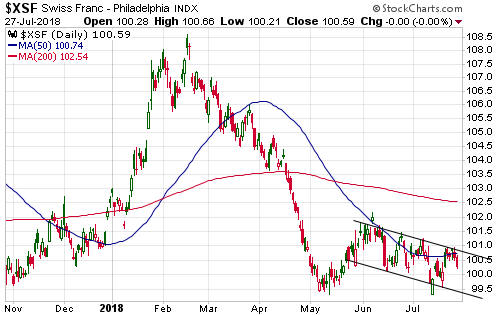
Euro sentiment is not extreme, but Swiss Franc (SF) sentiment
definitely is (the total speculative net-short position in SF futures hit a new
10-year high last week). The SF appears to have made a double bottom during
May-June and looks set to move upward.
Updates
on Stock Selections
Notes: 1) To review the complete list of current TSI stock selections, logon at
http://www.speculative-investor.com/new/market_logon.asp
and then click on "Stock Selections" in the menu. When at the Stock
Selections page, click on a stock's symbol to bring-up an archive of
our comments on the stock in question. 2) The Small Stock Watch List is
located at http://www.speculative-investor.com/new/smallstockwatch.html
 Company
news/developments for the week ending Friday 27th July 2018:
Company
news/developments for the week ending Friday 27th July 2018:
[Note: AISC = All-In Sustaining Cost, FS = Feasibility Study, FY = Financial
Year, IRR = Internal Rate of Return, ISR = In-Situ Recovery, MD&A = Management
Discussion and Analysis, M&I = Measured and Indicated, NAV = Net Asset Value,
NPV(X%) = Net Present Value using a discount rate of X%, NSR = Net Smelter
Return, P&P = Proven and Probable, PEA = Preliminary Economic Assessment, PFS =
Pre-Feasibility Study]
*Alkane Resources (ALK.AX)
issued its Quarterly Activities and Cash Flow reports for the June quarter (the
final quarter of FY2018).
The combined amount of cash, cash equivalents
and bullion increased by A$11M during the quarter and now totals about A$80M.
Gold production during the quarter from the company's Tomingley Gold
Operation (TGO) was on plan and total production for the 2018 Financial Year
(1st July 2017 to 30th June 2018) was 78.5K ounces at an AISC of A$1002/oz. This
is close to the top of the original guidance range for production quantity and
at the bottom of the original guidance range for production cost. Therefore, it
is fair to say that the TGO performed well over the past 12 months.
Due
to the completion of open cut mining, FY2019 production is expected to be much
lower. Guidance is for 30K-35K ounces of gold at an AISC of A$1,300-A$1,400/oz.
Consequently, the TGO probably won't make a significant positive contribution to
ALK's balance sheet during the coming 12 months.
The primary focus of
ALK's management over the months ahead should be on recruiting a large,
well-financed JV partner to fund the bulk of the pre-production capex for ALK's
Dubbo Project in exchange for equity in the project.
*Africa
Oil (AOI.TO): According to the article linked
HERE, Tullow Oil (TLW.L) has stopped work at its Kenyan oilfields and halted
trucking operations after protests by the local community disrupted a transport
scheme. The affected project is a JV between Tullow, Total and AOI.
The
protest was not against the oil project, but "to demand the deployment of
more security forces in the area, which has long been plagued by banditry and
cattle rustling."
This does not appear to be a major problem, but it
does highlight the location risk associated with AOI's project.
*Blackham
Resources (BLK.AX) announced in April an initial rough estimate of 37M
tonnes averaging 0.71-g/t gold for the historical tailings at the company's
Wiluna project. This implied a gold resource of about 800K ounces. At that time,
metallurgical testwork was indicating a gold recovery of 45%-50%, suggesting the
potential for BLK to add 350K-400K ounces of production to its overall mine
plan.
We concluded at the time: "The tailings opportunity (called
"Wiltails") will have to be confirmed by drilling, additional metallurgical
testing and economic studies, but it could give the per-share value a
significant boost."
Subsequent drilling has enabled the company to
arrive at a maiden JORC-compliant resource calculation for the tailings. The
resource is estimated to have an average grade of 0.57-g/t and to contain 620K
ounces. Metallurgical testing indicates a recovery of 42%-50% in a standard gold
leaching process similar to the existing Wiluna CIL circuit.
The maiden
JORC-compliant resource is not as good as the preliminary estimate announced by
the company in April, although it still looks like "Wiltails" will make a
significant positive contribution to the operation over the next few years.
*Clean TeQ (CLQ.AX, CLQ.TO) issued its Quarterly
Activities report for the June quarter. This report mostly repeated information
that was published in June along with the results of the Sunrise project
Definitive Feasibility Study (DFS). Noted in the report was that the company had
A$153M of cash at the end of the quarter.
Three steps are expected to
lead to a Final Investment Decision (FID) for the Sunrise project in early-2019.
The first step is deciding on the final delivery model, which effectively means
deciding on the main contractor. As explained in the press release issued last
week:
"The DFS assumed the Project will be designed and built by
Clean TeQ in conjunction with SNC-Lavalin and McDermott International
(collectively the Alliance), whereby the three parties will jointly manage
engineering, procurement and construction. In parallel, Clean TeQ has been
evaluating a competing fixed-price Engineering-Procurement-Construction (EPC)
proposal received from one of China's largest engineering and construction
groups. At the end of the quarter, Clean TeQ remained in discussions with both
the potential Chinese EPC contractor and the Alliance partners, with a decision
on the final delivery model expected during the third quarter of 2018."
The second and third steps are arranging off-take agreements and financing.
Following the FID, construction is expected to take 2 years. Therefore, the
plan is for Sunrise to be in production by the first half of 2021, although the
full production rate isn't expected to be reached until 2023.
It's worth
highlighting that the Sunrise project is a laterite (iron-hosted) deposit. This
means that the nickel mined at Sunrise is combined with iron and is not pure
enough to be used directly in the manufacture of cathodes for EV batteries.
However, CLQ's process plant will be employ High-Pressure Acid Leaching (HPAL)
and the company's proprietary "Clean iX" technology to produce battery-ready
products (nickel and cobalt sulphate) at the mine site. Currently this is more
important for nickel than for cobalt, because nickel sulphate trades at a
substantial premium to nickel in its basic metallic form.
The nickel
price that is typically quoted is for metal that may not be suitable for use in
EV batteries (less than half the nickel mined in the world is suitable for use
in EV batteries). At the end of last week it was US$6.21/pound. Over the past 12
months nickel sulphate has traded at an average premium over the basic metal of
about US$1.60/pound, and the premium should expand over the next few years as
the amount of nickel used in EV batteries grows as a percentage of total nickel
demand.
Also worth highlighting is that the Sunrise mine's scandium
byproduct could become very significant.
The demand for scandium
potentially could be far greater than it is at present, chiefly to create
aluminium alloys for use in aircraft manufacture. However, global scandium
demand is limited right now to only about 20 tonnes per year due to the lack of
reliable supply.
To further explain, in a typical commodity market
greater demand leads to a higher price, which prompts an increase in supply,
which eventually leads to a lower price. However, in the scandium market there
has been no significant growth in demand because the prospective consumers of
additional metal are concerned that the market will be unable to increase supply
to meet the increased demand.
CLQ is planning to address this obstacle
to scandium demand growth. It has designed an operation with 80-tonnes per annum
of current scandium production capacity and expansion potential to 160-tonnes
per annum, while assuming sales of only 10-tonnes per annum (worth US$15M at the
assumed US$1500/kg price). The plan is for the rest of the scandium to be
stockpiled. The appearance of a scandium stockpile would -- so the thinking goes
-- encourage aircraft manufacturers and other potential users of scandium to
make investments predicated on the greater availability of this metal.
CLQ's scandium strategy has a high potential reward relative to the risk,
because the economics calculated in the recently-completed FS are based on only
10-tonnes/year of scandium sales.
List
of candidates for new buying
From within the ranks of TSI stock
selections the best candidates for new buying at this time, listed in
alphabetical order, are:
1) AAU (last Friday's closing price: US$0.67)
2) EGD.V (last Friday's closing price: C$0.32)
3) KBLT.V (last
Friday's closing price: C$7.25)
4) PG.TO (last Friday's closing price:
C$2.56)
5) SBB.TO (last Friday's closing price: C$1.51)
The above
list is limited to five stocks. It will sometimes contain less than five, but it
will never contain more than five regardless of how many stocks are attractively
priced for new buying.
Removing
some positions from the TSI List
1) In November of last year we
added the Alio Gold A-Series Warrants (TSX: ALO.WT.A) to the TSI List. This was
a high-risk trade that could yield a very high return if there was a multi-month
rally in the gold-mining sector during the first half of 2018 and Alio Gold
performed well operationally. Both had to happen to make the trade a winner, but
neither happened. Consequently, the warrants have expired worthless.
2)
Nevsun Resources (NSU) is 'in play' and there's a good chance that it will be
bought by a larger base-metals mining company within the next several months. It
could make sense to hold the stock in anticipation of a better offer than
Lundin's current C$4.75/share bid, but we are removing it from the Stocks List
as part of an effort to cut back on the number of 'stories' that we are
covering.
NSU is up by 52% since the beginning of this year and up by 43%
since its inclusion in the List at around this time last year.
3)
Resolute Mining (RSG.AX) was added to the TSI List in November last year as an
intermediate-term trading position. It hasn't done badly (it is up by 28% in a
down gold market), but, taking into account the gold-mining sector's current
situation as well the stock's price action and valuation, the risk/reward no
longer justifies this trade.
4) Alio Gold (ALO) has been an unmitigated
disaster for us. It has been sold down to the point where it is bound to spring
back strongly at some point, but there are plenty of gold-mining juniors with
less baggage that are in the same boat. Moreover, due to the surprising change
of plan for the Ana Paula project early this year and then the ill-conceived
takeover bid for Rye Patch Gold, we have no confidence in the company's
management. We are therefore 'biting the bullet' and removing ALO from the TSI
for a huge average loss (across two positions) of almost 90%.
Note that
if the information provided by the company about its Feasibility-stage Ana Paula
project (Mexico) is correct then eventually ALO could attract a takeover bid.
This possibility has kept us interested up until now, but on the other side of
the ledger is the risk that the company will burn through all of its cash over
the coming few quarters and be forced to do an extremely dilutive financing to
put Ana Paula into production.
Chart Sources
Charts appearing in today's commentary
are courtesy of:
http://stockcharts.com/index.html
http://www.barchart.com/
