|
-- Weekly Market Update for the Week Commencing 30th September 2013
Big Picture
View
Here is a summary of our big picture
view of the markets. Note that our short-term views may differ from our
big picture view.
In nominal dollar terms, the BULL market in US Treasury Bonds
that began in the early 1980s will end by 2013. In real (gold)
terms, bonds commenced a secular BEAR market in 2001 that will continue
until 2014-2020. (Last
update: 23 January 2012)
The stock market, as represented by the S&P500 Index,
commenced
a secular BEAR market during the first quarter of 2000, where "secular
bear market" is defined as a long-term downward trend in valuations
(P/E ratios, etc.) and gold-denominated prices. This secular trend will bottom sometime between 2014 and 2020.
(Last update: 22 October 2007)
A secular BEAR market in the Dollar
began during the final quarter of 2000 and ended in July of 2008. This
secular bear market will be followed by a multi-year period of range
trading.
(Last
update: 09 February 2009)
Gold commenced a
secular bull market relative to all fiat currencies, the CRB Index,
bonds and most stock market indices during 1999-2001.
This secular trend will peak sometime between 2014 and 2020.
(Last update: 22 October 2007)
Commodities,
as represented by the Continuous Commodity Index (CCI), commenced a
secular BULL market in 2001 in nominal dollar terms. The first major
upward leg in this bull market ended during the first half of 2008, but
a long-term peak won't occur until 2014-2020. In real (gold) terms,
commodities commenced a secular BEAR market in 2001 that will continue
until 2014-2020.
(Last
update: 09 February 2009)
Copyright
Reminder
The commentaries that appear at TSI
may not be distributed, in full or in part, without our written permission.
In particular, please note that the posting of extracts from TSI commentaries
at other web sites or providing links to TSI commentaries at other web
sites (for example, at discussion boards) without our written permission
is prohibited.
We reserve the right to immediately
terminate the subscription of any TSI subscriber who distributes the TSI
commentaries without our written permission.
Outlook Summary
Market
|
Short-Term
(1-3 month)
|
Intermediate-Term
(6-12 month)
|
Long-Term
(2-5 Year)
|
|
Gold
|
Neutral
(10-Sep-13)
|
Bullish
(26-Mar-12)
|
Bullish
|
|
US$ (Dollar Index)
|
Neutral
(24-Dec-12)
|
Neutral
(18-Sep-13)
|
Neutral
(19-Sep-07)
|
|
Bonds (US T-Bond)
|
Bullish
(24-Jun-13)
|
Neutral
(18-Jan-12)
|
Bearish |
|
Stock Market
(DJW)
|
Bearish
(15-Jul-13)
|
Bearish
(28-Nov-11)
|
Bearish
|
|
Gold Stocks
(HUI)
|
Neutral
(10-Sep-13)
|
Bullish
(23-Jun-10)
|
Bullish
|
|
Oil |
Neutral
(30-Jul-12)
|
Neutral
(31-Jan-11)
|
Bullish
|
|
Industrial Metals
(GYX)
|
Neutral
(30-Jul-12)
|
Neutral
(29-Aug-11)
|
Neutral
(11-Jan-10)
|
Notes:
1. In those cases where we have been able to identify the commentary in
which the most recent outlook change occurred we've put the date of the
commentary below the current outlook.
2. "Neutral", in the above table, means that we either don't have a
firm opinion or that we think risk and reward are roughly in balance with respect to the timeframe in question.
3. Long-term views are determined almost completely by fundamentals,
intermediate-term views by
fundamentals, sentiment and technicals, and short-term views by sentiment and
technicals.
Another nail in the coffin
of the deflation case
For the entire history of the Federal
Reserve prior to October of 2008, the Fed was not legally able to pay interest
on bank reserves. However, the Emergency Economic Stabilization Act of 2008 gave
the Fed the power to pay interest on reserves and the Fed has since made use of
this power. We are going to explain why this change was made and why it greatly
reduces the probability of future US deflation.
Before we outline the reason for the Fed's decision to grant itself -- by adding
an item to an act that was being rushed through parliament at the time -- the
power to pay interest on reserves, it is worth reiterating some facts about bank
reserves. These facts rule out the reasons that have been put forward by some
'experts' to explain the Fed's new power.
Fact #1 is that when the Fed monetises X$ of assets it adds X$ to demand
deposits within the economy and X$ to bank reserves held at the Fed (that is,
held in Federal Reserve deposits). The demand deposits are liabilities of
commercial banks and the reserves are assets of commercial banks. In effect, the
reserves 'cover' the demand deposits.
Fact #2 is that although the reserves held at the Fed are assets of commercial
banks, the commercial banks are strictly limited in what they can do with their
reserves. The banks cannot, for example, loan their reserves into the economy or
spend their reserves, but one bank can lend reserves to another bank and
reserves will be transferred between banks as cheques are cleared (when a cheque
written by a customer of Bank A is presented at Bank B, there will be a transfer
of money and a transfer of reserves from Bank A to Bank B).
Fact #3 is that apart from a small annual drainage of reserves from the banking
system due to the public's steadily increasing demand for physical notes and
coins, all reserves held at the Fed will remain at the Fed until they are
removed by the Fed. It is fair to say that the Fed has absolute control over the
volume of reserves within the banking system.
Fact #4 is that total bank reserves can be separated into "required reserves"
and "excess reserves". The amount of reserves defined as "required" is the
amount needed to satisfy the minimum legal reserve requirement, but all reserves
have the sole function of providing cover for money in commercial bank deposits.
Fact #5 is that reserves do not (and cannot) leave the Fed as a result of an
expansion of commercial bank credit. When banks make loans and grow their
deposits it is possible that some reserves will shift from the "excess" category
to the "required" category, but an increase in bank lending cannot cause the
banking system's total reserves to change.
A hypothetical example can hopefully make Facts 4 and 5 more clear. Assume that
a) the total amount of money deposited in bank accounts is $10T, b) $2T of the
aforementioned $10T is subject to reserve requirements, c) the legal reserve
coverage is 10% (meaning that the banking system in our example is legally
obligated to hold at least $200B of reserves), and d) the banking system holds
$1T of reserves. The banks therefore have "required reserves" of $200B and
"excess reserves" of $800B. Now assume that the banks lend $5T of new money into
existence, $2T of which ends up in accounts that are subject to reserve
requirements, while the Fed makes no additions to or deletions from bank
reserves and the public's demand for physical currency remains the same. The
result is that total bank reserves will still be $1T, but the quantity of
reserves defined as "required" will now be $400B and the quantity of reserves
defined as "excess" will now be $600B.
Fact #6 is that the Fed currently pays the same rate of interest (0.25%) on all
reserves held at the Fed, regardless of whether the reserves are defined as
"required" or "excess". This means that if part of a bank's reserves shift from
the "excess" to the "required" category due to an expansion of its deposit base,
there will be no change in the amount of interest earned by the bank on its
reserves. In broader terms, the total amount of interest paid by the Fed on bank
reserves will not be affected by the amount of new loans made and new money
created by the commercial banking industry.
One implication of the above set of facts is that the payment of interest on
bank reserves provides no disincentive whatsoever to bank lending. This means
that the Fed did not start paying interest on bank reserves in order to restrict
the amount of new money loaned into existence by the commercial banks.
Rather than providing a means by which the Fed could discourage bank lending,
perhaps the Fed's decision to start paying interest on reserves was part of the
central bank's wide-ranging bailout of private banks. That is, perhaps it was
just another way to boost the assets of the private banks. This is the
explanation we favoured until recently, but the numbers don't make sense. At an
interest rate of 0.25%, even with $2.5T of reserves the annual interest payment
would only be $6B. In the context of the overall banking system and the
multi-trillion-dollar wealth transfer from the rest of the economy to the banks
that was engineered by the Fed over the past five years, this is 'chicken feed'.
It would not be worth the trouble. To put the aforementioned $6B interest
payment for the entire US banking industry into perspective, over the past two
years a single US bank called JP Morgan paid $7B in fines, suffered an $8B loss
on its "London Whale" trading fiasco, paid $10B in legal expenses and is
reportedly in the process of settling mortgage-related claims for $11B, all
without noticeably denting the bonuses of its top executives.
What, then, was the real reason that the Fed changed the rules to enable the
payment of interest on bank reserves?
The answer is linked to the massive increase in bank reserves that occurred as
part of the Fed's draconian efforts, beginning in September of 2008, to inflate
the prices of certain assets.
To understand why the change was made, first consider the ramifications if the
change had not been made. With such a huge volume of "excess" reserves in the
banking system, very few banks would ever find themselves in the position of
needing to borrow reserves from other banks, and most banks would always be
happy to lend their reserves to other banks at a miniscule rate of return.
Consequently, the Fed Funds Rate (FFR), the overnight rate at which banks lend
reserves to each other and the main interest rate directly targeted by the Fed,
would be stuck near zero. This would not be an issue as long as the Fed wanted
the FFR to be near zero, as is the case right now, but what would happen in the
future when the Fed decided that a higher FFR was appropriate?
Further to the above, if the Fed were still limited by its pre-2008 rules of
operation it would have no way of increasing the FFR in the future without
massively reducing both the quantity of money and the quantity of bank reserves.
To put it another way, as long as the banking system was inundated with "excess"
reserves, the effective FFR would be stuck near zero regardless of where the Fed
set its FFR target. Increasing the FFR would therefore necessitate a huge
monetary contraction, but this would collapse the equity and debt markets.
Just to be clear, the problem of not being able to hike the FFR without
implementing a crisis-precipitating monetary contraction stems from having a
gigantic quantity of "excess" reserves in the banking system. If reserve levels
were roughly the same today as they were at any time during the 50 years prior
to 2008, then the Fed would only need to make a small adjustment to the supplies
of money and reserves in order to hike the FFR.
Enter the new power to pay interest on bank reserves. With this simple addition
to its powers it is now possible for the Fed to increase the FFR to whatever
level it wants without contracting the quantities of money and bank reserves. It
simply has to make sure that the interest rate on bank reserves is the same as
its FFR target. For example, if the Fed sets its FFR target at 1% and the
interest rate on bank reserves at 1%, then no bank will lend reserves to another
bank at less than 1% regardless of how many "excess" reserves it has.
In summary, the ability to pay interest on bank reserves eliminates the future
need for the Fed to contract its balance sheet in order to hike its targeted
short-term interest rate. It is therefore another substantial nail in the coffin
of the deflation case.
According to the financial
markets, Europe is doing fine
The main reason that we were intermediate-term
bullish on the Dollar Index until recently was that we expected the euro-zone's
government-debt and banking-system crises to resume during the second half of
2013. These crises are eventually going to resume, because the issues that led
to the sharp decline in confidence during 2010-2012 have not been eliminated.
However, the markets are telling us that it won't happen this year.
We present three charts as evidence that, rightly or wrongly, the markets are
currently not worried about the euro-zone (EZ).
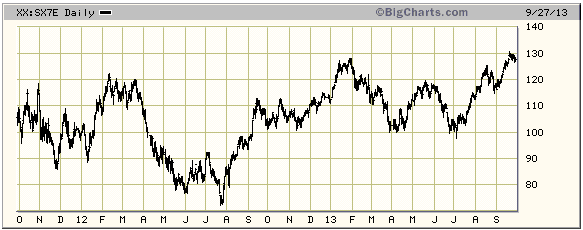
The first chart shows that the EURO STOXX Banks Index, a proxy for EZ bank
stocks, recently made a new multi-year high. EZ banks have much weaker balance
sheets, on average, than their US counterparts, but at the moment the stock
market doesn't care.
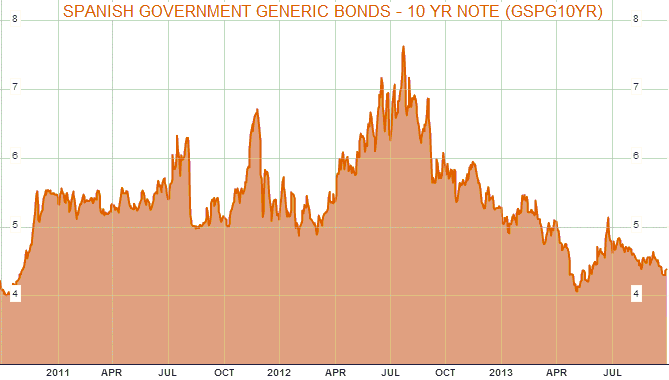
The next chart shows the yield on the Spanish 10-year government bond. Despite a
material increase during May-June, the 10-year yield remains near its lows of
the past three years. Moreover, the current yield on the 10-year bond issued by
the Spanish government is only 1.8% higher than the current yield on the 10-year
bond issued by the US government. The debt market is therefore saying that an
additional 1.8% per year compensates an investor for the higher risk of a
Spanish government default versus a US government default.
This, in our opinion, is a good example of the madness of crowds. Investors are
clearly ignoring the real risks in a scramble for yield.
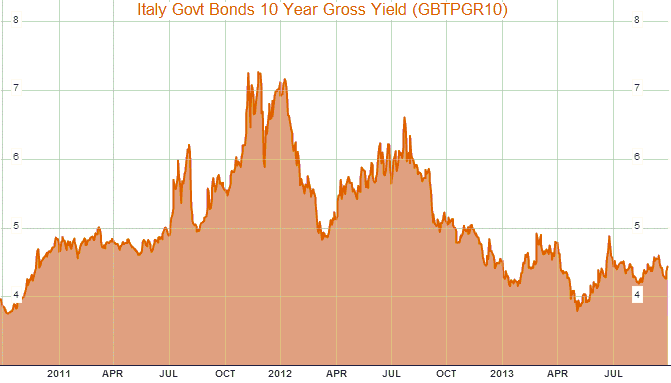
The final chart shows the yield on the Italian 10-year government bond. The
yield on Italian 10-year government bonds has risen by about 70 basis points
(0.7%) over the past 5 months, but it is still very low. This reflects
extraordinary complacency on the part of the debt market considering that a)
Italy has one of the highest government-debt/GDP ratios in the developed world,
b) Italy's economy is in a recession with no end in sight, and c) Italy is
immersed in a
political crisis precipitated by the legal problems of Silvio Berlusconi.
 The Stock
Market
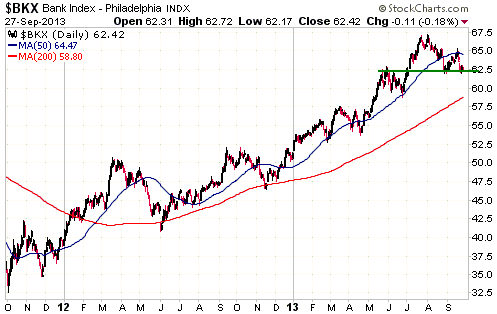
The US S&P500 Index will probably make a new
high within the coming month, but the US Bank Index (BKX) could be in the
process of completing an intermediate-term top. As illustrated below, the BKX
ended last week near a 3-month low and is testing well-defined support.
Breaching this support would suggest that the banking sector had peaked.
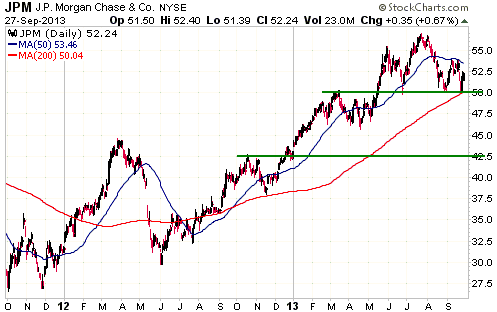
We mentioned JP Morgan (JPM) above so it seems appropriate to now show a JPM
chart. JPM's chart looks more bearish than the BKX's chart, but as is the case
with BKX there is important support just below the current price. If this
support is breached it will suggest that an intermediate-term top is in place.
Note that $42.50 would be the chart-based target for JPM following a breach of
support at $50.
This week's
important US economic events
| Date |
Description |
| Monday Sep 30 |
Chicago PMI
Dallas Fed Mfg Survey | | Tuesday
Oct 01 |
ISM Mfg Index
Motor Vehicle Sales
Construction Spending | | Wednesday
Oct 02 |
No important events scheduled | | Thursday
Oct 03 |
Factory Orders
ISM Non-Mfg Index
|
| Friday Oct 04 |
Monthly Employment Report |
Gold and
the Dollar
Gold
Last week's price action was non-committal. The gold market had a slight upward
bias, but was unable to close above its 50-day MA. The price ended the week
roughly mid-way between support at $1300 and resistance at $1376.
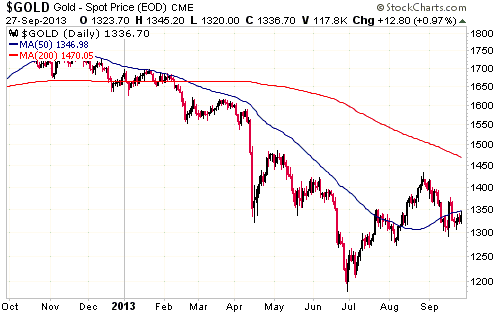
This week's price action will probably determine whether or not gold is going to
test its June low. The reason is that the next installments of the ISM
Manufacturing numbers and the Employment numbers, the two most important sets of
monthly US economic numbers, will be published this week. How the gold market
reacts to these economic data will likely be telling. For example, if gold shows
resilience in the face of strong economic data it will suggest that the path of
least resistance is to the upside and that the June low is not going to be
tested.
We emphasise that it will be how the gold market reacts to the economic numbers
rather than the numbers themselves that will tell us whether or not a test of
the June low remains a realistic possibility. The coincident and
backward-looking data could well reveal economic strength, but at some point the
gold market will begin to discount the economic weakness coming down the track.
Aside from how gold reacts to this week's US economic data, a daily close above
$1376 would rule out a test of the June low and confirm that an
intermediate-term rally was underway.
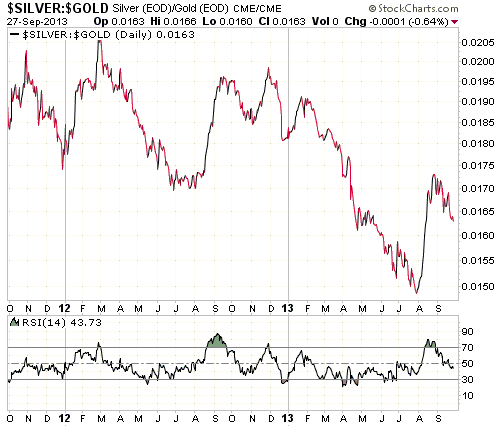
Moving on, the following chart shows that the silver/gold ratio hit an
'overbought' extreme near the end of August and that September's market action
has 'corrected' the situation. Note, though, that silver/gold is not yet
'oversold', which means that a low-risk short-term buying opportunity is not yet
at hand for silver or gold.
Gold Stocks
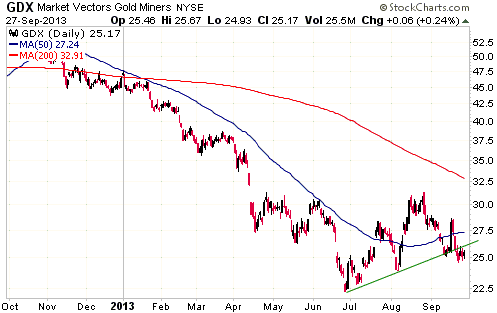
At the end of the week before last, GDX, a proxy for the stocks of large and
mid-size gold producers, broke below the upward-sloping trend-line that dates
back to the late-June bottom. However, there was no follow-through to the
downside last week. Instead, GDX essentially traded sideways.
GDXJ, a proxy for the stocks of junior gold producers and advanced-stage
explorers, has performed better than GDX since the late-June bottom. As
evidenced by the top half of the following chart, until now it has managed to
hold above the upward-sloping trend-line that GDX recently breached. And as
evidenced by the bottom half of the following chart, it is currently about 10%
higher relative to GDX than it was at the late-June bottom.
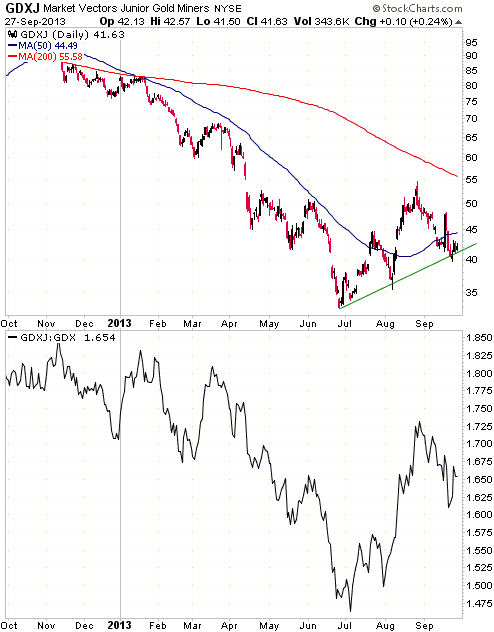
If gold bullion drops back to test its June low then the gold-stock indices and
ETFs will probably make new multi-year lows. Such a bearish short-term outcome
will remain a realistic possibility unless the mid-September spike highs ($28.64
for GDX) are exceeded on a daily closing basis.
Currency Market Update
The following chart shows that the recent weakness in the Dollar Index is linked
to weakness in large-cap US stocks (represented by the S&P500 Index) relative to
large-cap European stocks (represented by the EURO STOXX 50 Index). The
implication is that for the Dollar Index's downward trend to continue, European
equities will have to keep outperforming US equities.
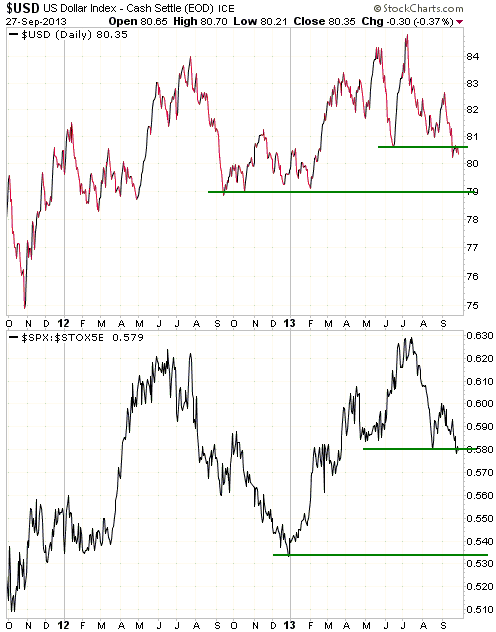
Continued outperformance by European equities is more likely to occur in
parallel with a continuing global stock market rally, and a break below support
at 79 for the Dollar Index will probably require several more months of global
stock market strength. This is not the most likely outcome, but it can't be
ruled out.
We are short- and intermediate-term neutral on the Dollar Index. We expect
support at 79 to hold over the remainder of this year, but a meaningful US$
rally will require the sort of flight away from the euro that doesn't look like
happening over the next few months.
Update
on Stock Selections
Notes: 1) To review the complete list of current TSI stock selections, logon at
http://www.speculative-investor.com/new/market_logon.asp
and then click on "Stock Selections" in the menu. When at the Stock
Selections page, click on a stock's symbol to bring-up an archive of
our comments on the stock in question. 2) The Small Stock Watch List is
located at http://www.speculative-investor.com/new/smallstockwatch.html
 Company
news/developments for the week ended Friday 27th September 2013: Company
news/developments for the week ended Friday 27th September 2013:
[Note: FS = Feasibility Study, IRR = Internal Rate of Return, MD&A =
Management Discussion and Analysis, M&I = Measured and Indicated,
NAV = Net Asset Value, NPV(X%) = Net Present Value using a discount
rate of X%, P&P = Proven and Probable, PEA = Preliminary Economic
Assessment, PFS = Pre-Feasibility Study]
*Almaden Minerals (AAU) reported results from infill drilling at
its Tuligtic gold-silver project in Mexico.
The purpose of the infill drilling was/is to upgrade resources from
Inferred to M&I and to confirm the continuity of high-grade
mineralisation in the deposit's main zone. In this respect the
drilling has been very successful to date, as exemplified by
intercepts of 41.2m averaging 11.4 g/t gold-equivalent in Hole
TU-13-309 and 89.5m averaging 2.0 g/t gold-eq in Hole TU-13-306.
*Dragon Mining (DRA.AX) announced that it had earned a 60% stake
in some exploration permits adjacent to its Svartliden gold
production centre in northern Sweden. This news is not significant.
*Energy Fuels (EFR.TO), a junior US-based uranium producer and the
owner/operator of the only conventional uranium mill currently
operating in the US, announced that it is raising $5M via a "bought
deal" equity financing. The company will be issuing 31M new shares
at C$0.16/share.
This low-priced financing reduces the overall per-share value, but
is probably necessary for risk management purposes due to the low
uranium price.
*Pilot Gold (PLG.TO) was recently discussed by Bob Moriarty at
http://www.321gold.com/editorials/moriarty/moriarty092313.html.
Bob does a good job of explaining the tangible and intangible
qualities that make PLG an excellent speculation.
*Pretium Resources (PVG) announced more results from drilling
linked to the bulk sample program and exploration drilling. The
results contained numerous narrow intercepts grading more than
1,000-g/t of gold and were generally consistent with previous
results.
In addition to reporting the results of Strathcona's bulk sample
analysis, PVG will be completing an updated resource estimate and FS
early next year.
*Sprott Inc. (SII.TO), a fund management company focused on
natural-resource-related investments, announced last Friday that it
has launched a new global mining fund with Zijin Mining, China's
largest gold miner and second-largest copper miner. The new fund
will invest in publically-listed equity and debt instruments of
gold, other precious metals and copper mining companies, and will
initially be seeded with $10M from SII and $100M from Zijin. The aim
is to grow the fund to around $500M through commitments from Chinese
investors.
This gets SII's foot in the China door and is therefore a good deal
for the company, although not a financially significant one at this
time.
 Candidates
for new buying Candidates
for new buying
From within the ranks of TSI stock selections, here are the best candidates for
new buying at this time. These stocks have been singled out because in addition
to having very attractive risk/reward ratios, they were among the strongest
rebounders following the late-June gold-sector bottom (meaning: they stand a
good chance of being among the strongest rebounders following the next bottom)
and they do not have any financing difficulties.
1) EDV.TO/EVR.AX (last Friday's closing price: C$0.68)
2) EVN.AX at around A$0.75 (last Friday's closing price: A$0.87)
3) PG.TO (last Friday's closing price: C$2.14)
4) PVG (last Friday's closing price: US$6.99)
5) RIO.TO/RIOM (last Friday's closing price: C$2.09/US$2.04)
Apart from updating the Friday closing prices, the above is a repeat of what we
wrote last week. Last week's price action supported our view that these stocks
will probably be among the strongest rebounders following the next sector-wide
bottom, because they were relatively strong on the couple of occasions last week
when the gold sector tried to rally.
Chart Sources
Charts appearing in today's commentary
are courtesy of:
http://stockcharts.com/index.html
http://bigcharts.marketwatch.com/

|

