![]()
![]()
![]()
![]()
-- Weekly Market Update for the Week Commencing 30th December 2019
Copyright
Reminder
The commentaries that appear at TSI
may not be distributed, in full or in part, without our written permission.
In particular, please note that the posting of extracts from TSI commentaries
at other web sites or providing links to TSI commentaries at other web
sites (for example, at discussion boards) without our written permission
is prohibited.
We reserve the right to immediately
terminate the subscription of any TSI subscriber who distributes the TSI
commentaries without our written permission.
True
Fundamentals Summary
[Notes:
1) The date shown next to the current True Fundamentals Model (TFM) signal is
when the most recent change occurred. 2) Charts of the Gold and Equity
TFMs are included in the "Charts and Indicators" section of the TSI web
site]
| Market | True Fundamentals Model (TFM) |
| Gold (US$ Price) | Bullish (27 Dec 2019) |
| US Equity (SPX) | Bullish (20 Dec 2019) |
| Currency (Dollar Index) | Neutral (15 Mar 2019) |
| Commodities (GNX) | Bearish (01 Jun 2018) |
Last week's posts at the TSI Blog
Accelerating Monetary Inflation
Summary of current
thinking/positioning
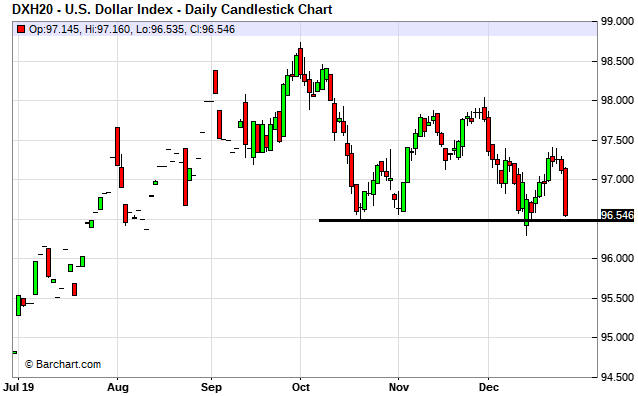
1) The Dollar Index (DX) remains
range-bound, needing a weekly close below 96.5 to signal an
intermediate-term reversal to the downside or a weekly close above 99.5 to
signal an intermediate-term rally. We are anticipating the former, but we
are uncertain as to whether it will happen in the near future or during
the first few months of next year.
2) Last week the conflict
between the gold bullion market and the gold mining sector was resolved by
the bullion market confirming the gold sector's bullish price action. We
expect a multi-month top in January.
3) The senior US stock
indices probably will make multi-month tops between late-December and
mid-January. Sentiment indicators are flashing warning signs, but breadth
indicators are saying that the coming decline will be limited to around
10%.
4) The T-Bond made a short-term bottom in early-November, but
there is still risk of downward acceleration over the coming month or two.
Regardless of what happens in the short-term, there's a good chance that
major price weakness will be seen in 2020. In other words, it looks like
higher interest rates are on the way.
5) Industrial commodities
such as oil and copper should perform well over the next 12 months, but
the stage is set for multi-month price highs early in the New Year.
6) We are holding a cash reserve of 25%-30% and are looking for
opportunities to increase this reserve.
The Fed
The Fed's interest rate
manipulations
According to the prices of Fed Funds Futures
contracts, the majority view right now is that the Fed will make no change
to its interest rate target in 2020. This means that the market currently
is in synch with Jerome Powell's characterisation of 2019's three rate
cuts as a mid-cycle correction along similar lines to the mid-cycle
corrections that happened during the economic expansion of the 1990s.
Consequently, a rate cut in 2020 would be a major event in that it would
change the way that 2019's rate cuts are perceived.
To further
explain, one more rate cut would indicate that the Fed's actions during
July-October of 2019 marked the start of a 'loosening' cycle as opposed to
a correction within a 'tightening' cycle. This shift in perception would
have big implications for all the financial markets and especially the
currency market. Specifically, it would lead to very significant weakness
in the US dollar.
A catalyst for the Fed's next rate cut could
arrive during the first quarter of 2020 in the form of a 10% decline in
the S&P500 Index. While an SPX decline of this magnitude initially could
boost the US$ and put irresistible downward pressure on the prices of
almost all equities, the Fed's reaction probably would set in motion an
intermediate-term rally in the commodity sector and an upward trend in
inflation expectations.
Monetising the government deficit
A number of temporary factors came together during September to create
the "repo crisis", but the underlying issue (the root cause) was not
temporary. That's why the Fed felt the need to continue pumping money and
reserves into the banking system after the initial crisis subsided and
order was restored. The underlying issue is that the demand for the US
Federal Government's debt is falling short of supply at current interest
rates.
The Primary Dealers (PDs) are intermediaries in the
Treasury market. When the Fed conducts its open market operations it deals
through the PDs. For example, when the Fed wants to inject money into the
banking system it buys Treasury securities from the PDs. Also, the PDs are
obligated to place bids at the regular auctions of US government debt and
they do this with the aim of quickly selling the debt at a profit. The Fed
is a potential buyer of this debt.
Prior to mid-September the Fed
was not doing any net buying of Treasuries, so Treasury debt purchased by
the PDs at government debt auctions had to be sold to hedge funds, bond
funds, pension funds, foreign central banks, etc. However, there wasn't
sufficient demand at high-enough prices (low-enough yields) to enable the
PDs to earn the desired profit, so they ended up with a much
larger-than-normal amount of unsold Treasury inventory.
A knock-on
effect was that the PDs, most of which are banks, had less ability than
normal to offer short-term money to the "repo" market. At the same time,
the demand from hedge funds for short-term money was ramping up.
During September, the elevated demand for short-term funding on the part
of hedge funds and the reduced supply of short-term funding from PDs and
the associated major banks collided with a substantial build-up of cash in
the government's account at the Fed and a corporate tax payment. The
result was a dramatic spike in the cost of short-term funding (a dramatic
interest-rate spike) that the Fed addressed by providing the "repo market"
with whatever additional 'liquidity' it needed.
By aggressively
pumping money the Fed was able to bring the cost of short-term funding
back into line with its target, but, as mentioned above, the underlying
issue of excess Treasury supply remained. This meant that the Fed couldn't
just switch on the money pumps for a short period and then turn them off.
It had to keep pumping because the government kept emitting new debt at a
rapid pace.
It's beginning to look as if the non-Fed demand for
Treasury securities will continue to fall short of Treasury supply at the
Fed's desired interest rates until/unless there is a financial shock of
sufficient magnitude to provoke a large-scale flight to safety. In other
words, in the absence of a widespread shift away from risk it seems that
the Fed will have to keep filling-in the gap between Treasury supply and
Treasury demand with its own buying of Treasury debt. This means that for
all intents and purposes, the Fed is now monetising the government
deficit.
In the 21st October Weekly Update we explained why this is
potentially very important. At that time we wrote:
"The Fed has
emphasised that the new asset monetisation program should not be called
"QE" because it does not constitute a shift in monetary policy.
Technically this is correct, but in a way it's worse than a shift towards
easier monetary policy. The Fed's new program is actually a
thinly-disguised attempt to help the Primary Dealers absorb an increasing
supply of US Treasury debt. To put it another way, the Fed is now
monetising assets for the purpose of financing the US federal government,
albeit in a surreptitious manner."
And:
"...when
the central bank is perceived to be financing the government, as opposed
to implementing monetary policy to achieve economic (non-political)
objectives such as "price stability", there is a heightened risk that a
large decline in monetary confidence will be set in motion. One effect of
this would be an increase in what most people think of as "inflation"."
As well as leading to an increase in what most people think of as
"inflation", the spreading realisation that the Fed is monetising assets
for the express purpose of financing the US federal government should lead
to weakness in the US dollar on the foreign exchange market.
Oil
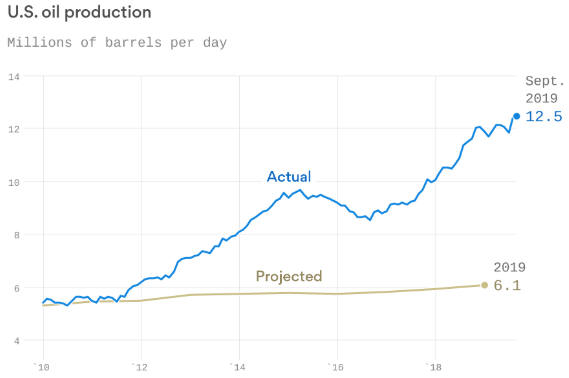
Flawed Forecasts
Most forecasts are extrapolations of the recent past and as a result
will be wildly inaccurate around major turning points or trend
accelerations. The forecasts made by the U.S. Energy Information
Administration (EIA) a decade ago are great examples, in that there are
big differences between the actual US energy situation today and what the
EIA projected 10 years ago. Some of the most important differences are
illustrated in the following charts, which were taken from the article
posted
HERE.
The first chart shows that US oil production today is
approximately double the projection that was made by the EIA in 2009.
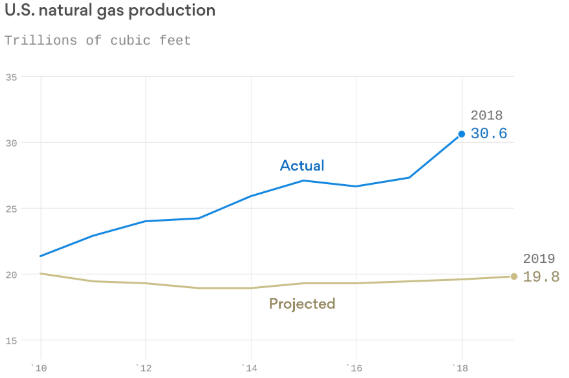
The next chart shows that it's a similar story with natural gas
production.
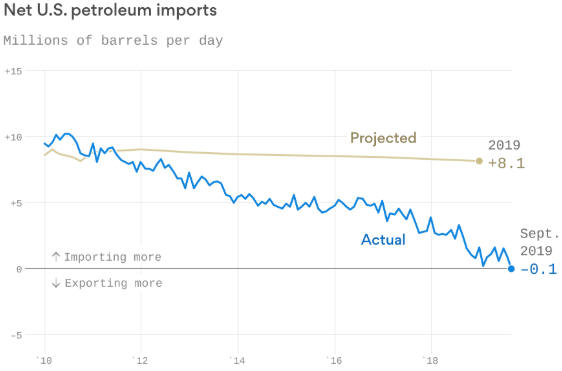
In 2009 the net amount of oil imported by the US was expected to
remain at around 8M barrels/day over the ensuing decade. Instead, the
chart displayed below shows that the US has become a net exporter of oil.
In addition to having economic consequences, this has foreign policy
implications. In particular, it removes the main excuse for US military
intervention in the Middle East.
The popular assumption now is that US production of oil and gas will
continue to trend upward, but this line of thinking could turn out to be
as 'off-the mark' as the projections made by the EIA in 2009. We don't
have the information or the expertise to have a strong opinion on the
matter, but we do know that it is dangerous to assume that the future will
be a linear extrapolation of the recent past.
Current
Market Situation
We have been expecting a
December-February (most likely January) turning point in the oil price.
Prior to the past fortnight a turn from down to up was the more likely
scenario, but that's no longer the case. Due to an extension of the stock
market's short-term upward trend and the positive correlation between the
oil and stock markets, there's a good chance of a multi-month top in the
oil price during January-2020.
A January-2020 top for the oil price
would, we think, prove to be similar to the January-2018 top, meaning that
it would be followed by a sharp multi-week pullback.
The Oil Services ETF (OIH) is consolidating after reaching its 200-day
MA. We expect big things from OIH during 2020, but the short-term
risk/reward is neutral. We won't be surprised if the ETF gains another 10%
before topping on a short-term (1-3 month) basis, but we also won't be
surprised if there is a correction of up to 10% prior to the upward trend
resuming.
The Stock Market
Sentiment Alert, Part 2
A week ago we wrote that there had just been a surge in optimism that
constituted a loud warning signal. This was evidenced by an upward spike
in the TSI Index of Bullish Sentiment (TIBS). Well, the warning signal got
even louder over the past week.
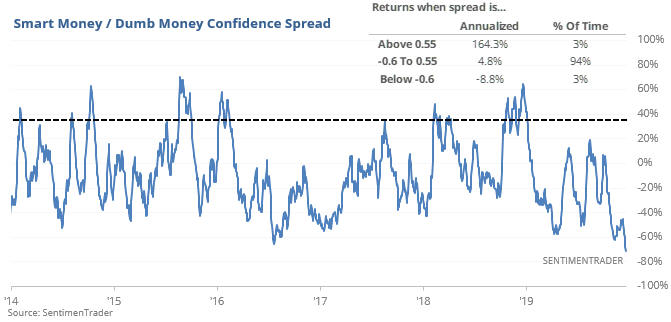
At around this time last year, the
Smart-Money/Dumb-Money Confidence Spread calculated by
Sentimentrader.com was near a
5-year high, meaning that the confidence of the Smart Money (institutional
traders) was extremely high relative to the confidence of the Dumb Money
(retail traders). This was a buy signal.
The current signal is the
opposite. As illustrated by the following chart, the
Smart-Money/Dumb-Money Confidence Spread has just reached a 6-year low.
Rarely has the Dumb Money been so confident relative to the Smart Money.
Current Market Situation
Sentiment isn't the
only reason to suspect that a sizable correction will get underway in the
near future. Another reason is the extent to which the senior US stock
indices and many other stock indices are stretched to the upside in
momentum terms. For example, the following chart shows that the daily
RSI(14) of the NASDAQ100 Index (NDX) has just risen to near a multi-year
high and that the previous two times that the NDX's RSI reached a similar
extreme there was a quick decline of around 10%.
The US stock market's saving grace is that breadth remains strong.
This suggests that while a correction of up to 10% may well be likely, a
bear market is not about to begin.
The only bearish divergence or
non-confirmation we can identify right now is the obvious lack of strength
in the Dow Transportation Average (TRAN). As illustrated below, the TRAN
remains below its early-November high.
It isn't only the US stock market that is stretched to the upside and
due for a sizable correction. On a short-term basis the Emerging Markets
ETF (EEM) is in a similar position to the NDX, having 'gone vertical' over
the past few weeks.
We expect that due to the combination of US$
weakness and relatively attractive valuations, Emerging Market equities
will outperform US equities over the coming 12 months.
It would be reasonable to accumulate new or add to existing bearish
speculations over the coming fortnight. These speculations could take the
form of put options with expiry dates of March-2020 or later that are
5%-10% out of the money, or bear funds such as QID.
At some point
over the next week we may add one or two new bearish option trades to the
TSI List. The ones we have in mind are the SPY March-2020 $290 Put Option
and the IYT (Transportation ETF) March-2020 $180 Put Option.
This week's
significant US economic events
[Notes:
1) The most important events
(to the markets) are shown
in bold. 2) A list of global economic events can be found
HERE]
| Date | Description |
| Monday Dec-30 |
Pending Home Sales Chicago PMI |
| Tuesday Dec-31 |
Case-Shiller Home Price Index Consumer Confidence Index |
| Wednesday Jan-01 | Markets closed for New Year's Day |
| Thursday Jan-02 | No important events scheduled |
| Friday Jan-03 |
ISM Mfg Index Construction Spending Motor Vehicle Sales |
Gold and the Dollar

In terms of time the gold mining sector probably isn't far from an
intermediate-term top, but there is the potential for a continuing strong
advance over the weeks immediately ahead.
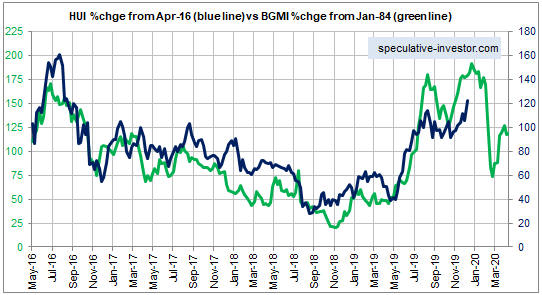
As illustrated below, a
top in January would keep the HUI on a similar path to the one traveled by
the Barrons Gold Mining Index (BGMI) in the 1980s.
Our comparison
with the 1980s points to a January-2020 high followed by a large decline
to a March-2020 low. This is just something to be aware of. The current
market eventually will deviate from our 1980s model, but as long as the
model is consistent with the recent price action we will continue to pay
heed to it.
With the gold mining indices and the broad stock market (represented
by the S&P500 Index) having just made new multi-year highs together, the
gold mining sector is far more vulnerable than usual to weakness in the
broad market. That is, don't assume that the gold mining sector will
benefit from significant stock market weakness in the near future.
Instead, due to the gold sector having just rallied with the broad market
it's more likely that gold mining stocks would be dragged down by
significant short-term stock market weakness.
The Currency
Market
The Dollar Index (DX) ended last week slightly
above important support at 96.5. A weekly close or consecutive daily
closes below this support probably would be followed by a multi-week
decline to 94.5 or lower.
As mentioned early in today's report, the
DX initially could be boosted by a 'flight to safety' during the next
sizable stock market decline. However, if the Fed's reaction to the stock
market decline involves a rate cut it would, we think, lead to persistent
weakness in the DX.
The following chart shows that gold and the Yen have diverged over the
past several weeks, with gold beginning to trend upward and the Yen
continuing to drift downward. Based on the historical relationship between
these markets it is reasonable to expect that the divergence will be
closed within the coming month via a surge in the Yen or a plunge in the
gold price. We think that the former is more likely, but it's a virtual
coin toss.
The Yen's decline since its August-2019 peak has traced out a wedge
pattern. Refer to the following daily chart for the details. A daily close
above 92 would break the Yen out of its wedge and suggest that the
gold-Yen divergence mentioned above was going to be resolved via a surge
in the Yen.
Updates
on Stock Selections
Notes: 1) To review the complete list of current TSI stock selections, logon at
http://www.speculative-investor.com/new/market_logon.asp
and then click on "Stock Selections" in the menu. When at the Stock
Selections page, click on a stock's symbol to bring-up an archive of
our comments on the stock in question. 2) The Small Stock Watch List is
located at http://www.speculative-investor.com/new/smallstockwatch.html
![]() Company
news/developments for the week ending Friday 20th December 2019:
Company
news/developments for the week ending Friday 20th December 2019:
[Note: AISC = All-In Sustaining Cost, EBITDA = Earnings Before
Interest, Tax, Depreciation and Amortisation (a measure of cash flow), EV
= Enterprise Value or Electric Vehicle, FS = Feasibility Study, FY =
Financial Year, IRR = Internal Rate of Return, ISR = In-Situ Recovery, JV
= Joint Venture, MD&A = Management Discussion and Analysis, M&I = Measured
and Indicated, NAV = Net Asset Value, NPV(X%) = Net Present Value using a
discount rate of X%, NSR = Net Smelter Return or Net Smelter Royalty, P&P
= Proven and Probable, PEA = Preliminary Economic Assessment, PFS =
Pre-Feasibility Study]
*Premier Gold (PG.TO)
advised that it is involved in a legal dispute with Centerra Gold
(CG.TO), its JV partner at the feasibility-stage Hardrock gold project in
Ontario. According to PG, the project meets the requirements defined in
the 2015 partnership agreement for mine construction to proceed. According
to CG, it does not. In other words, PG wants to begin the process of
putting the project into production, but CG wants to wait.
CG could
resolve this dispute by purchasing PG's 50% stake in the project or making
a takeover bid for PG. We doubt that it will do this in the near future,
but it's a realistic possibility.
Regardless of how the current
PG-CG dispute is resolved, we would prefer that PG was NOT involved in
moving the Hardrock project through the construction phase. The reason is
that given the US$1B estimated construction cost, doing so would entail PG
taking on a lot of debt and a lot of risk.
![]() List
of candidates for new buying
List
of candidates for new buying
From within the ranks of TSI
stock selections the best candidates for new buying at this time, listed
in alphabetical order, are:
1) ALK.AX (last Friday's closing price:
A$0.55)
2) AOI.TO (last Friday's closing price: C$1.19)
3)
PG.TO (last Friday's closing price: C$2.01)
4) PRQ.TO (last
Friday's closing price: C$0.24)
5) TGB (last Friday's closing
price: US$0.46)
The above list is limited to five stocks. It
sometimes will contain less than five, but it never will contain more than
five regardless of how many stocks are attractively priced for new buying.
![]() The
Fortuna Silver Mines (FSM) Trade
The
Fortuna Silver Mines (FSM) Trade
FSM was added to the TSI
List during the week before last with an initial daily-closing stop at
US$3.15. It was expected to either start working or get stopped out right
away.
It has started working and is up by 16% to date. As a result
it makes sense to lift the sell stop.
From now on we will use a
10% trailing stop. For example, the high to date (since the start of the
trade) is US$4.07, so the current sell stop is US$3.66.
![]() Tax
Trade Update
Tax
Trade Update
Three weeks ago we mentioned five candidates
for a tax-loss trade that we planned to track as a group, with each stock
being added to the group if/when it became available at a targeted entry
price. The aim was to average into the group over the remainder of this
year and exit at a profit during the first month of the New Year.
At the moment our tax trade group contains three stocks: AAL.V, TGB and
TK.V. The other two potential inclusions (CGT.TO and GRG.V) didn't quite
make it to their stipulated entry prices before beginning to rebound.
Consequently, they have been ruled out.
We were considering a few
other stocks for inclusion in the tax trade group, but each has enjoyed a
significant bounce over the past two weeks. Clearly, the
post-tax-loss-selling rebound started early this season.
Here is a
table showing the performance to date of our tax trade group. The entire
group will be exited within the coming three weeks and any member of the
group will be automatically removed if it trades at least 100% above its
entry price.
Chart Sources
Charts appearing in today's commentary
are courtesy of:
https://stockcharts.com/
https://www.barchart.com/