|
-- Weekly Market Update for the Week Commencing 31st May 2004
Big Picture
View (Most recent update: 12 January 2004)
Here is a summary of our big picture
view of the markets. Note that our short-term views may differ from our
big picture view.
Bond yields (long-term interest
rates) bottomed in June of 2003 at around 4.2% and will move considerably higher during
2004 and 2005.
The stock market rally that
began in October of 2002 will end during the first half of 2004. The October-2002
bottom (775 for the S&P500) will be tested during 2005.
The Dollar will make an intermediate-term
bottom during the first half of 2004 in the vicinity of its 1995 low (a Dollar Index value of around 80) and
then rally for at least 6 months, but a long-term bottom won't occur until
2008-2010.
Gold will make an intermediate-term
peak during the first half of 2004 and then consolidate for at least 6
months, but a long-term peak won't occur until 2008-2010.
Commodities, as represented
by the CRB Index, will make an intermediate-term peak during the first
half of 2004 and then consolidate for at least 6 months, but a long-term
peak won't occur until 2008-2010.
Copyright
Reminder
The commentaries that appear at TSI
may not be distributed, in full or in part, without our written permission.
In particular, please note that the posting of extracts from TSI commentaries
at other web sites or providing links to TSI commentaries at other web
sites (for example, at discussion boards) without our written permission
is prohibited.
We reserve the right to immediately
terminate the subscription of any TSI subscriber who distributes the TSI
commentaries without our written permission.
The keys to a long-term bull market in gold
In an article last week at www.mineweb.com (http://www.mineweb.net/sections/gold_silver/325328.htm)
Jeff Christian, described in the article as a veteran metals analyst at
New York's CPM Group, explains why he thinks a gold price above $400 is
unsustainable in the long run. We are sometimes interested in reading
diametrically opposing views to our own to check that we haven't missed
something important, so given our expectation that gold will exceed its
1980 high before the end of this decade we were interested to find out
why we might be wrong. After reading the article, though, we were left
with the impression that if this is the best argument a gold bear can
come up with then maybe we aren't bullish enough.
The main reason for Mr Christian's relatively bearish view is the
growth in new mine supply that might occur over the coming years.
However, there's no need to even speculate on whether Mr Christian is
right about an increase in mine supply because changes in mine supply
have such a small effect on the gold price they are not worth
considering. Think of it this way: There are about 140,000 tonnes of
gold supply in the world and this supply increases by 1.5%-2.0% per
year as a result of new mine supply, so even if new mine supply were to
increase by 10% this would alter the total aboveground gold supply by
only 0.2%. On the other hand, changes in the investment demand for gold
can have dramatic effects on the overall supply/demand situation.
How big is the investment demand for gold? Well, if the total supply of
gold is 140,000 tonnes then the total demand for gold at any time must
also be 140,000 tonnes because the current price is, by definition, the
price that brings supply and demand into balance. And it has been
estimated that investment demand constitutes at least 70% of total
demand, which means that a 10% swing in investment demand would result
in a 7% swing in total demand. In other words, the overall effect of a
10% change in investment demand is about 35-times greater than the
overall effect of a 10% change in new mine supply. This is why any
long-term forecast of the gold price should be solely based on an
assessment of the factors affecting the investment demand for gold.
Jim Sinclair (http://www.jsmineset.com/)
is someone who has correctly anticipated the major moves in the gold
market over the past 35 years so it is not surprising that he zooms in
on the factors that affect the investment demand for gold.
Specifically, he believes that "...in
order to have a long term bull market in gold certain foundational
conditions need to be fulfilled. Not every condition will be present
but when they are gold is either in or about to enter a major period of
price appreciation.
The required criteria in order of importance are:
1. A Bear Market in the US dollar.
2. A Bear Market in US Treasury instruments.
3. Deficits in the US Trade and US Current Account.
4. Declining trust in paper assets as storehouses of value.
5. On balance positive market for general commodities."
By the way, while we wholeheartedly agree that a long-term bear market
in the US$ is the single most important prerequisite for a long-term
bull market in gold we actually aren't in total agreement with the
above list. For one thing, the US trade and current account deficits
are only important to the extent that they contribute to the bear
market in the US$. Also, although it is likely that a bull market in
gold will be associated with a bull market in commodities and a bear
market in US Treasuries, these are not ESSENTIAL criteria for a bull
market in gold. For instance, it is not difficult for us to envisage an
environment where gold and bonds are strong while the US$ and
commodities are weak. In fact, such an environment existed from the
second quarter of 2001 through to the second quarter of 2003 (during
this period commodity prices were strong in US$ terms, but they weren't
strong in terms of most other major currencies). Our view is that
instead of considering a bear market in US Treasuries and a positive
market for general commodities to be foundational conditions for a gold
bull market, it makes more sense to think of a bull market in gold as
being a foundational condition for a bear market in Treasuries and a
bull market in commodities.
So, our own list of required criteria for a long-term bull market in
gold would comprise just items 1 and 4 from Mr Sinclair's list. In a
nutshell, a bear market in the US$ guarantees a bull market in gold in
US$ terms while declining trust in paper assets guarantees a bull
market in gold in terms of all fiat currencies.
In any case, the most important points are that the future gold price
will be determined by the factors that affect the investment demand for
gold and these factors do NOT involve the world 'going to hell in a
handbasket'. The long-term bullish argument for gold does not rely on
apocalyptic scenarios, it relies on a gradual loss of confidence in the
US$ in particular and paper assets in general. Who could look at the
world's current political and monetary leadership as well as the
massive imbalances in the US economy and claim, with a straight face,
that this is not a reasonable argument?
Know yourself
Are you are short-term
speculator? Or a speculator trying to profit from the intermediate-term
swings in the market? Or a long-term speculator (otherwise known as an
investor)? If you are an investor, do you have enough conviction in
your long-term outlook and the stocks you own to comfortably ride-out
the short- and intermediate-term corrections in the market, or does
your confidence plummet with every sharp price decline?
Where we think a lot of people go wrong is that they either try to be
something they are not suited to being or continually switch between an
investing approach and a trading approach in response to the most
recent price action. An example would be someone who thinks of
himself/herself as an investor and buys a stock based on valuation with
the aim of holding for 2-5 years only to agonise over every short-term
price fluctuation. Another example would be someone who thinks of
themselves as a trader and buys a stock based on technical
considerations only to use a value-oriented approach to justify holding
onto the stock after the technical picture has turned sour.
The bottom line is that investors shouldn't need the constant
validation of 'the herd' in order to have confidence in their decisions
whereas traders can't afford to spend much time moving in the opposite
direction to the herd.The Stock
Market
Current Market Situation
We've warned against paying a lot of attention to the NYSE McClellan
Oscillator (MO) because the large number of interest-rate sensitive
stocks that now trade on the NYSE was causing this indicator to move
from one extreme to the other based almost entirely on what was
happening in the bond market. However, the recent behaviour of the NYSE
MO warrants a mention because it really is quite extraordinary.
During the first week of May the NYSE MO hit its second LOWEST level
ever on the back of rate-hike fears, but last week it hit its HIGHEST
level ever. In fact, last Thursday's reading for the MO was about 30%
higher than the previous all-time high!
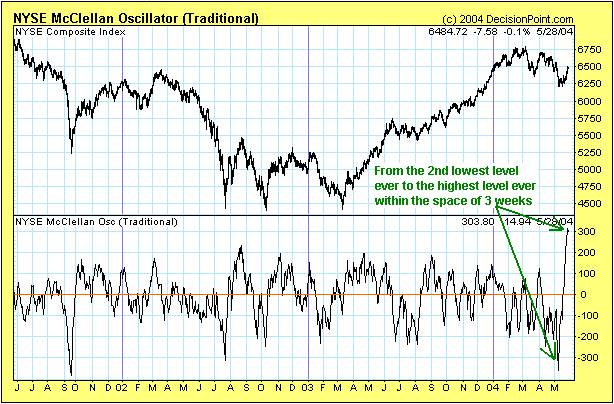
We are not sure it's
worth trying to draw any conclusions from the recent performance of the
MO, but looking back over the past several years there have only been
two other occasions when the MO moved from below -200 to above +200 in
4 weeks or less. One of those occasions was July-August of 2002 and the
other was September of 1998. In both of those prior cases the NYSE
Composite Index dropped to a new correction low over the ensuing weeks
before embarking on a large rally, so if the current market follows a
similar pattern there will be a drop below the May low within the next
month or so followed by a rally to a new high for the year.
Last week's market action certainly cast doubt on our short-term
bearish view. We've speculated that the market would drop sharply into
a late-June low, but in order for this view to remain valid a decisive
break below the March low in each of the senior stock indices would
have to occur this week. However, that now looks unlikely because the
past week's action was bullish. In particular, the Dow Utility Average
achieved an upside breakout (see chart below) and the NDX handily
out-performed the Dow. Also, weakness in the US$ combined with
significant strength in bonds and the industrial metals suggests that
the markets are returning, at least temporarily, to last year's theme.
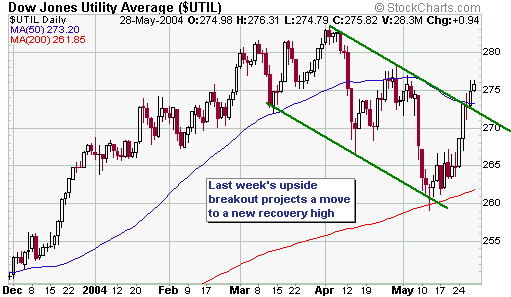
Our bearish
conviction is shaken but has not yet been shattered because the market
hasn't done quite enough to negate the possibility of a sharp near-term
decline. For example, none of the senior stock indices have yet broken
out from the downward trends that originated during the first quarter
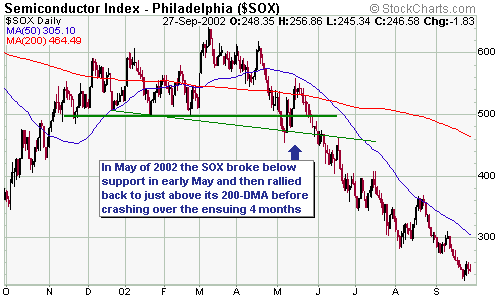
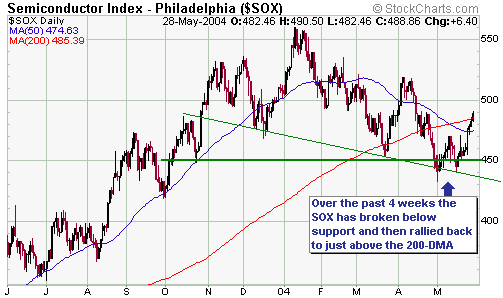
of this year. Also, take a look at the below charts of the
Semiconductor Index (SOX). The first chart, which covers the 12-month
period from September 2001 to September 2002, shows that the SOX broke
below important support in early-May of 2002 and then immediately
rebounded back to just above its 200-day moving average before
collapsing in a heap. The second chart covers the most recent 12 months
and shows that something similar might now be afoot.
For our short-term
bearish view to have any chance of coming to fruition the stock indices
must turn lower from near current levels. On the other hand, if market
moves sideways for a few days and then resumes its advance we will have
to make a hasty retreat with the aim of re-establishing our bearish
positions when the technical evidence once again supports such
positions.
We were shaken out of our USPIX positions for a small loss last month
and it would be frustrating if the same thing were to happen again now,
particularly since most of the bearish ducks appeared to be lined up
just one week ago. However, such things are 'par for the course' in the
world of speculation.
Lastly, terrorism warrants a mention. Terrorism will remain a constant
threat and there's a significant chance that a major terrorist attack
will be attempted in either the US or Europe within the next few
months. Also, just yesterday (Saturday) there was another attack in
Saudi Arabia that was focused on the oil industry and the
de-stabilisation of the current Saudi regime. This latest attack could
push the oil price higher and cause some nervousness in the stock
market this week.
A successful terrorist attack against the US would cause the stock
market to plunge, but it's unlikely that the market would behave in a
bullish manner during the weeks leading up to such an event. This is
because an 'unexpected' attack would not be unexpected by everyone.
Recall, for instance, the persistent weakness in the stock market
during the lead-up to the September-2001 attacks on the World Trade
Center. In other words, the worst things tend to happen when the
technical situation is already bearish.
This week's
important US economic events
| Date |
Description |
Monday May 31
|
US markets closed for Memorial Day
|
Tuesday Jun 01
|
ISM Index
Construction Spending
|
| Wednesday Jun 02 |
No significant events |
| Thursday Jun 03 |
Q1 Productivity and Costs
Factory Orders
ISM Non-Manufacturing Index
|
| Friday Jun 04 |
Employment Report
Future Inflation Gauge
|
Gold and
the Dollar
Gold versus the Swiss Franc
Occasionally we read an argument to the effect that gold and the US$
are going to move higher TOGETHER over the coming years. However, while
it is certainly possible that this could happen it is, in our opinion,
extremely unlikely. We say this for two reasons. First, the investment
demand for gold would be unlikely to increase if the US$ were in a
long-term upward trend (why buy gold when you can buy a strengthening
dollar?). Second, since the official link between the US$ and gold was
severed in 1971 there has been a strong inverse correlation between
these two forms of money.
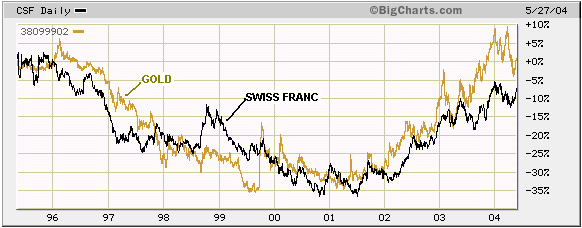
The inverse correlation between gold and the US$ results in the
positive correlation between gold and the Swiss Franc illustrated on
the below chart (the chart compares the performance of gold and the SF
since the beginning of 1995). Note that there are often enough leads,
lags and divergences in the short-term to make it look like the
relationship between gold and the SF is breaking down, but the chart
suggests that a multi-year period of gold price strength combined with
SF weakness would be highly improbable.
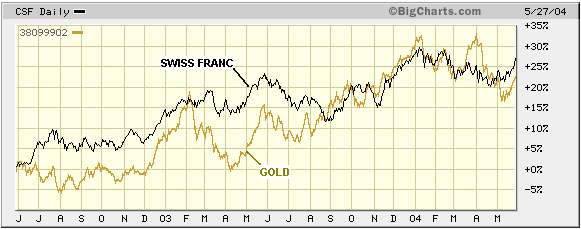
Zooming in on the
past 2 years (refer to the below chart) we see that gold and the SF
sometimes diverge quite markedly, but that they inevitably come back
into line with each other.
At some point over
the next few years we think gold will start moving higher against the
US$ at a much faster rate than the SF is moving higher against the US$,
that is, we expect gold to out-perform the SF by a wide margin over the
coming years. This will occur due to declining confidence in paper
assets throughout the world. However, we find it difficult to envisage
an extended period of gold price strength combined with SF weakness and
there is certainly no evidence at this time that such a period has
begun. As such, we would not be long-term bullish on gold unless we
were also long-term bearish on the US$.
Currency Market Update
The Japanese Yen has two big things going for it. One is that Japan
runs a large current account surplus every year. The other is that the
Japanese stock market probably made a secular low last year, which, if
true, would mean that the Nikkei225 Index was now in the early stages
of a secular bull market. Despite these major positives, though, the
Yen is the only major currency that is yet to surpass its 1998-1999
highs against the US$.
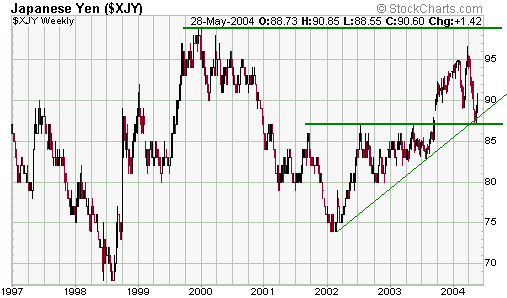
The below weekly chart shows that the Yen broke above important
resistance during the third quarter of last year but has thus far been
unable to surpass its late-1999 peak. During April it plunged to its
former resistance (now support) at 87 but has since rebounded and is
now between intermediate-term support in the 85-87 range and long-term
resistance in the 95-100 range. Our view is that the Yen will
eventually move well above 100 due to the fundamental positives
mentioned above, but the high for this year is probably in place.
Last week's action in
the currency market indicated that what we've called the 'red dollar
scenario' is in progress. In other words, we think the US$ will test
its February low within the coming 1-3 months and then embark on a
lengthy (> 6 months) rally.
A test of this year's low for the US$ would involve the Dollar Index
dropping to the 83-86 range (a successful test of a low can result in a
slightly higher low or a slightly lower low). Our thinking is that some
currencies -- almost certainly the Swiss Franc and probably the euro --
will move above their January-February highs over the coming months
while currencies such as the Yen, the Australian Dollar and the
Canadian Dollar make lower highs.
Just to recap, the main reason we are expecting the US$ to complete a
test of its low over the next few months rather than embark on a new
bear-market leg is that the price action in the currency market and
related markets points to the dollar rebound that began in February
being a correction of the entire 2002-2004 decline. At this stage,
though, the correction has only retraced about 20% of the preceding
decline in terms of price and 12% in terms of time. If the Dollar
correction has already ended then this would amount to an unusually
small retracement.
The possibility of a lengthy dollar rally will, however, need to be
re-assessed based on what is happening in other markets IF/WHEN the
dollar drops to near its February low. For example, if the US$ has just
embarked on another bear-market leg then one thing we would expect to
see over the next several weeks is substantial strength in gold stocks
in both absolute terms and relative to the gold price. To be specific,
by the time the Dollar Index dropped to the vicinity of its February
low we'd expect the HUI to be well on its way to new highs.
The Commitments of Traders (COT) Report
Over the past two years the lowest levels for the net-long position of
small traders in COMEX gold futures occurred during March and July of
2003. On both of these occasions the net-long position was around
25,000 contracts and the drops to this level coincided with important
price lows in the gold market. We therefore think it is reasonable to
assume that a small trader net-long position of around 25,000 contracts
represents the sort of negative sentiment that would generally be
apparent near the bottoms of gold-market corrections.
Now, as of last Tuesday (the date of the latest COT data) the net-long
position of small traders was 27,000 contracts, which means that from a
sentiment perspective we are currently where we would expect to be if
an important bottom had just been put in place in the gold market.
Furthermore, when the net-long position of small traders was near
current levels back in March of 2003 the gold price was $330, versus
$388 last Tuesday, so it could be said that the small traders are just
as disinterested in gold today as they were when it was trading $58
lower back in March of 2003. This is obviously bullish from a
contrarian perspective.
Small traders aren't very bullish on gold, but they are downright
bearish on bonds and notes. For example, the net-short position of
small traders in 5-year T-Note futures is at an all-time high and their
net-short position in 10-year T-Notes is also close to an all-time
high. This should help to support the bond market over the coming
weeks.
Merger Mania II
When IAMGold (IAG) and Wheaton River (WHT) announced their planned merger at the end of March our comment was: "...the
proposed IAG/WHT merger looks like a wonderful deal for WHT
shareholders and a horrible deal for IAG shareholders. It also looks
like the type of deal seen near cycle tops; although it is, of course,
nowhere near as extravagant as some of the deals that were done by tech
and internet companies in 1999-2000."
After the market closed last Thursday competing bids were launched for
IAG and WHT by Golden Star Resources (GSS) and Coeur D'Alene (CDE),
respectively. The competing bids were launched at significant premiums
to the pre-bid stock prices of IAG and WHT, but the premiums mostly
evaporated during Friday's trading due to reductions in the stock
prices of GSS and CDE.
Our guess is that the competing bids will be successful, mainly because
the newly-proposed merger of GSS and IAG makes much more sense for IAG
shareholders than the previously-proposed tie-up with WHT. The original
plan for IAG to merge with WHT made no sense at all for IAG because
there were no synergies between the two companies and because the
agreed price represented a huge growth premium for a company (Wheaton)
whose best growth was behind it. Also, IAG's management had agreed to
pay top gold-sector multiples for a 'gold company' that generates a lot
of its profits from the production of copper.
All four companies involved in the bidding process look expensive based
on current production and reserves, but the GSS/IAG combination would
be a company worth owning for the long-term because it would combine
good management, high-quality gold assets and a strong growth profile.
We think Wheaton's management has done a masterful job of promoting the
company and putting it in play at the most opportune time, but
investors who are still holding this stock should seriously consider
making their exit now. A reasonable course of action, in our opinion,
would be to sell WHT and buy GSS (we don't know how the stock prices
will perform relative to each other in the short-term, but we are
confident that GSS will out-perform WHT over the coming 12 months). CDE
is poorly managed as well as being over-priced and should therefore be
avoided.
Current Market Situation
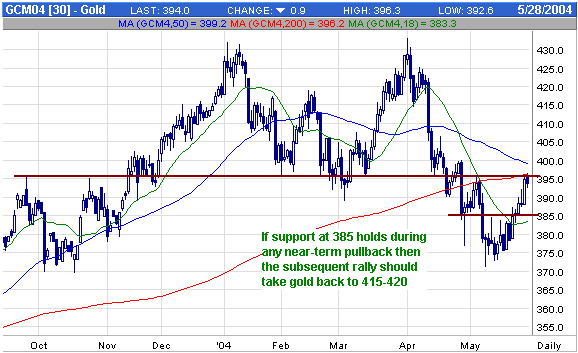
Below is a daily chart of June gold futures. Following a test of the
200-day moving average and the 395 resistance level last week it would
be normal for gold to pullback this week, but if it can hold above 385
during any near-term pullback then the subsequent rally would have a
good chance of taking the price back to 415-420.
The AMEX Gold BUGS
Index (HUI) is in a similar position to the gold price and will
probably consolidate for a week or so in the 190s before resuming its
advance.
Copper
Below is a daily chart
of July copper futures. By closing above its 'breakdown level' at the
end of last week the copper price has done enough to suggest that a
correction low was put in place during the week before last. A test of
this year's highs is possible within the next two months, but we doubt
that another major upward leg in copper's bull market is about to get
underway. A more likely outcome is that copper will spend the rest of
this year in a range bounded by its March high and its May low.
Update
on Stock Selections
 We'll send an e-mail to subscribers on Tuesday with updates on a few stocks. We'll send an e-mail to subscribers on Tuesday with updates on a few stocks.
Chart Sources
Charts appearing in today's commentary
are courtesy of:
http://stockcharts.com/index.html
http://www.futuresource.com/
http://www.decisionpoint.com/
http://bigcharts.marketwatch.com/

|

