


--
Weekly Market Update for the Week Commencing
31st October 2016
Big Picture
View
Here is a summary of our big picture
view of the markets. Note that our short-term views may differ from our
big picture view.
The BULL market in US Treasury Bonds
that began in the early 1980s ended in early-2015, but there will be many years
of topping action in bond prices and bottoming action in bond yields before
major new trends get underway. (Last update: 29 June 2015)
The stock market, as represented by the S&P500 Index,
commenced
a secular BEAR market during the first quarter of 2000, where "secular
bear market" is defined as a long-term downward trend in valuations
(P/E ratios, etc.) and gold-denominated prices. This secular trend will bottom sometime between 2018 and 2020.
(Last update: 29 June 2015)
A secular BEAR market in the
US
Dollar
began during the final quarter of 2000 and ended in July of 2008. This
secular bear market will be followed by a multi-year period of range
trading.
(Last
update: 09 February 2009)
Gold commenced a
secular bull market relative to all fiat currencies, the CRB Index,
bonds and most stock market indices during 1999-2001.
This secular trend will peak sometime between 2018 and 2020.
(Last update: 29 June 2015)
Commodities,
as represented by the CRB Index, commenced a
secular BULL market in 2001 in nominal dollar terms. The first major
upward leg in this bull market ended during the first half of 2008, but
a long-term peak won't occur until 2018-2020.
(Last
update: 29 June 2015)
Copyright
Reminder
The commentaries that appear at TSI
may not be distributed, in full or in part, without our written permission.
In particular, please note that the posting of extracts from TSI commentaries
at other web sites or providing links to TSI commentaries at other web
sites (for example, at discussion boards) without our written permission
is prohibited.
We reserve the right to immediately
terminate the subscription of any TSI subscriber who distributes the TSI
commentaries without our written permission.
Outlook Summary
Market
|
Short-Term
(1-3 month)
|
Intermediate-Term
(6-18 month)
|
Long-Term
(2-5 Year)
|
|
Gold
|
N/A |
Bullish
(10-Oct-16) |
Bullish
|
|
US$ (Dollar Index)
|
N/A |
Neutral
(17-Aug-16) |
Neutral
(19-Sep-07) |
|
US Treasury Bonds (TLT)
|
N/A |
Bearish
(19-Oct-15)
|
Bearish |
|
Stock Market (DJW)
|
N/A |
Bearish
(19-Sep-16)
|
Bearish |
|
Gold Stocks
(HUI)
|
N/A |
Bullish
(10-Oct-16) |
Bullish
|
|
Oil |
N/A |
Neutral
(26-Oct-15) |
Bullish
|
|
Industrial Metals
(GYX)
|
N/A |
Neutral
(10-Oct-16) |
Bullish |
Notes:
1. Our short-term expectations are discussed in the commentaries, but except in
special circumstances we won't attempt to assign a "bullish", "bearish" or
"neutral" label to these expectations.
2. The date shown below the current outlook is when the most recent outlook change occurred.
3. "Neutral" means that we think risk and reward are roughly in balance with respect to the timeframe in question.
4. Long-term views are determined almost completely by fundamentals and intermediate-term views
are determined by a combination of fundamentals, sentiment and technicals.
Last week's posts at the TSI Blog
Chanting "it's a bull market" won't make it so
Summary of current
thinking/positioning
1) Thinking that short-term
bottoms are in place for gold and the associated mining indices, but
expecting that the overall corrections will extend into Q1-2017 and that
multi-week rebounds from the recent lows will be followed by tests of the
lows.
2) Expecting that 2017-2018 will be a very bullish period for
commodities, but acknowledging that the early-2016 lows could be tested
prior to the start of the aforementioned bullish period. Gradually
building up long-term exposure to non-gold commodities and simultaneously
hedging against short-term weakness via EEM and USO put options.
3)
Thinking that the US stock market has commenced a meaningful 1-2 month
decline and positioned for such an outcome via QID call options.
4)
Thinking that the Dollar Index made a multi-week top last week, but
concerned that following some consolidation it will resume its advance and
break upward from its 20-month horizontal range.
5) Maintaining a
large cash reserve in recognition of the downside risk in almost all
equities (current cash percentage is around 50%), but looking for
opportunities to reduce cash and add to gold plus commodity exposure.
Government bond
yields are on the rise
Due to rising inflation
expectations, government bond yields turned upward almost four months ago.
At this stage there is no way of knowing whether the upturn is just
another correction within a continuing secular decline or the start of a
major new trend, but it could certainly be the latter.
It's
important to note that the recent upward reversal in government bond
yields has not been confined to the US. It has, instead, been a global
phenomenon. As evidence we present charts showing that the yields on the
10-year US Treasury Note and the 10-year German Bund have both risen by
around 0.40% since early-July.
The sustainability of the bond-yield reversal would be tested by a
serious stock market decline. In the past, government bonds have generally
benefited from the increasing risk aversion that goes hand-in-hand with
substantial stock-market weakness. Consequently, if we don't get the
normal decline in government bond yields during the next bout of
significant stock-market weakness it will be like the dog that didn't bark.
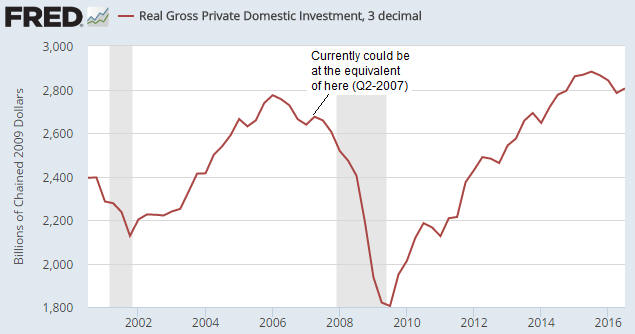
US Recession
Watch
Real Gross Private Domestic
Investment (RGPDI), the most reliable long-term leading indicator of US
economic recession, ticked upward in the third quarter of this year (the
Q3 data was published last Friday). This up-tick looks similar to the
up-tick that happened during the second quarter of 2007 -- two quarters
prior to the start of the last recession. Refer to the following chart for
details.
RGPDI's message remains unchanged. The message is that the
US economy will enter its next recession by the second quarter of 2017.
The US yield curve has just joined RGPDI in warning that a recession
will begin within the next few quarters.
As explained in the past,
the recession signal generated by the yield curve is the reversal in the
curve from 'flattening' (long-term interest rates falling relative to
short-term interest rates) to 'steepening' (long-term interest rates
rising relative to short-term interest rates) after an extreme is reached.
Such a reversal was confirmed last week when the 10yr-2yr yield spread
moved above its September high. Here's the relevant chart.
As well as being a recession warning, the reversal in the yield curve
is bearish for the stock market and bullish for gold.
The Real Interest Rate
How should the real
interest rate be measured?
Despite the popularity of doing
so, subtracting the percentage change in the CPI or some other price index
from the current nominal interest rate will not result in a realistic or
reasonable estimate of the current 'real' interest rate.
The
method of real interest rate calculation summarised above is wrong in two
different ways, each of which is sufficient to render the result invalid.
The first and most obvious way it is wrong is that the CPI does not
reflect the change in the purchasing power of money. This is not just
because it has been re-jigged over the decades as part of an effort to
minimise its value, but also because the entire concept of a "general
price level" is nonsense. There is no such thing as a general price level
because disparate items cannot be averaged. To explain by way of a simple
example, averaging the prices of a car, a potato and a visit to the
dentist makes no more sense than averaging the goods/services themselves.
Clearly, a car, a potato and a visit to the dentist cannot be averaged.
However, even if, for the sake of argument, we assume that the CPI
makes sense at a conceptual level and is a satisfactory estimate of the
change in the purchasing power of money, we still couldn't use it to
determine the current real interest rate. The reason is that the real rate
of return obtained from an interest-producing investment has nothing to do
with the historical change in the purchasing power of money and everything
to do with the amount by which the purchasing power of money will change
in the future. For example, if you buy a 1-year bond today your real
return will be determined by how much the purchasing power of money
changes over the next 12 months; not by how much it changed over the
previous 12 months.
So, when you see a chart showing the nominal
interest rate minus the 12-month percentage change in the CPI, what you
are looking at is NOT a chart of the real interest rate.
How, then,
should the real interest rate be calculated and charted?
The hard
reality is that there are some things worth measuring that simply can't be
measured. The real interest rate falls into this category. By taking into
account money-supply growth and population growth and by making a guess
regarding productivity growth it is possible to come up with a realistic,
albeit very rough, estimate of how the purchasing power of money shifted
over a long historical period, but it will never be possible to calculate
the current real interest rate.
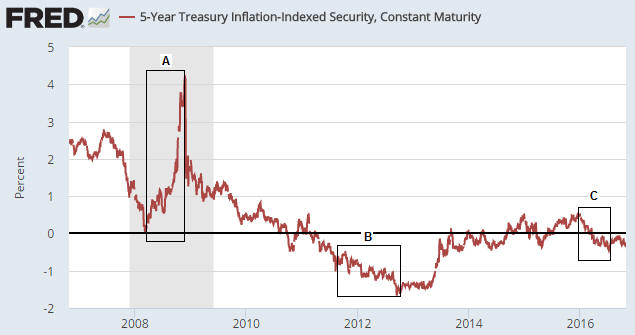
The best we can do is use the
financial market's average forecast regarding the future CPI in our
calculations. In other words, the best we can do is use the TIPS (Treasury
Inflation Protected Security) yield as a proxy for the real interest rate,
since the TIPS yield is effectively the nominal yield minus the expected
CPI. A chart of the 5-year TIPS yield is displayed below and discussed in
the next section.
The TIPS yield is not an accurate reflection of
the real interest rate because it is based on the CPI and because the
market's expectations are sometimes wrong, but for practical speculation
purposes it seems to be good enough.
The relationship between gold and the real interest rate
The real interest rate is one of gold's true fundamentals, with a
rising real interest rate exerting downward pressure on the gold price and
a falling real interest rate exerting upward pressure on the gold price.
However, it is important to keep in mind that the real interest rate is
just one of several fundamental drivers of the gold price.
Due to
the relationship between gold and the real interest rate, the gold price
will often trend in the opposite direction to the 5-year TIPS yield. For
example, the sharp rise in the TIPS yield between March and November of
2008 (Period A on the above chart) coincided with a substantial downward
correction in the gold price, and the multi-year decline in the TIPS yield
from its November-2008 peak coincided with a powerful upward trend in the
gold price.
Note, though, that the downward trend in the TIPS yield
(our proxy for the real interest rate) continued until September of 2012
whereas the gold price peaked in September of 2011. The period of
divergence is labeled "B" on the above chart.
That the gold price
stopped trending with the real interest rate for 12 months beginning in
September of 2011 is related to the real interest rate being only one of
several (six, to be specific) fundamental drivers of the gold price. Other
fundamental price drivers turned bearish during the second half of 2011 or
the first half of 2012, thus counteracting the bullish influence of the
declining real interest rate. That being said, substantial weakness in the
gold price didn't materialise until after the real interest rate began to
trend upward.
The real interest rate reached its post-2011 peak in
December of 2015 -- at around the same time that the Fed made its initial
rate hike. The December-2015 downward reversal in the real interest rate
marked the start of an intermediate-term rally in the gold price.
The most recent low in the real interest rate occurred in early-July and
coincided almost to the day with gold's price top. Since there is no way
of knowing whether the choppy sideways move in the real interest rate
since early-July is a 'pause for breath' within a continuing downward
trend or the start of a new upward trend, this particular gold-market
fundamental should currently be viewed as neutral.
The Stock Market
The Battle For 2120
The S&P500 Index (SPX) again tested support at 2120 last Friday and
again managed to hold the support. Furthermore, it managed to hold above
support despite rising interest rates and weak corporate earnings.
The fact that support at 2120 has now been tested on three separate
occasions over the past two months increases the probability that it will
be breached. As previously advised, taking out this support would
potentially lead to a quick (meaning: 2-4 week) decline to the vicinity of
the "Brexit" sell-off low in the 1990s.
The most bullish thing that
the SPX could do now is to plunge well below 2120 and then move back above
2120. This would flush out a lot of 'stops' and cause short-term sentiment
to become far more constructive, thus setting the stage for a multi-week
rally to new highs.
At the moment, short-term sentiment is
precarious in that there is too much complacency given the 'toppy' price
action, the rising interest rates, the lack of earnings growth and the
absurd political situation.
This week's
significant US economic events
[Notes:
1) The most important events
(to the markets) are shown
in bold. 2) A list of global economic events can be found
HERE]
| Date |
Description |
|
Monday October 31 |
Personal Income and Spending
Chicago PMI |
| Tuesday
November 01 |
Motor Vehicle Sales
ISM Mfg Index
Construction Spending |
|
Wednesday November 02 |
FOMC Announcement |
|
Thursday November 03 |
Q3 Productivity and Costs
Factory Orders
ISM Non-Mfg |
|
Friday November 04 |
Monthly Employment
Report |
Gold and the Dollar
Gold
Since reaching some sort of bottom three weeks ago the US$ gold price has been
oscillating in a narrow range around its rising 200-day MA. The price action
leaves open the possibility of a quick decline to support in the low-$1200s
prior to a short-term bottom (a bottom that holds for more than a couple of
months), but we suspect that such a bottom was put in place when the gold price
spiked down to $1243 on 7th October and that the worst that will happen over the
weeks immediately ahead is a test of the 7th October low.
We have a few
reasons for suspecting that a short-term bottom is in place for the US$ gold
price. One is the performance of the gold-mining sector, although it should be
understood that the gold-mining indices are yet to conclusively signal a bottom.
Another is time, in that regardless of whether we are dealing with a new bull
market or an on-going bear market it would be normal for a short-term bottom to
be in place by now. A third is that while the Commitments of Traders (COT)
situation cannot yet be classed as gold-bullish, it is no longer a threat. A
fourth is that the Dollar Index is probably close to a multi-week top and is
therefore likely to stop putting downward pressure on the gold market for a
couple of weeks at least. And a fifth is that short-term momentum indicators for
gold and the HUI have turned upward from 'oversold' extremes.
At the same
time, we don't expect gold to do much more on the upside over the remainder of
this year than test resistance in the low-$1300s. This, again, is regardless of
whether we are dealing with a new bull market or an on-going bear market.
In summary, we are expecting that gold will spend the bulk of the next two
months in the $1250-$1300 range. Moves above the top or below the bottom of this
range could certainly occur, but they are likely to be short-lived.
Last week's most significant development for the gold market was the
confirmation of a reversal in the US yield curve from 'flattening' to
'steepening'. This shifts the overall fundamental backdrop from slightly bearish
to neutral for gold.
Silver
Silver is in a
similar situation to gold. It has probably made a short-term price bottom and
will potentially rebound to at least $18.50 within the coming month, but the
overall correction is probably not complete.
It's likely that silver will
trade at $16 or lower before the intermediate-term decline that began in July
comes to an end, with the most likely fundamental driver of the price weakness
being US$ strength and/or stock-market weakness.
Gold Stocks
During the week before last there were three
big up-days that elevated the HUI to near resistance at 220. During the
subsequent seven trading days the HUI consolidated, in the process retracing
about two-thirds of its big 3-day gain.
Downward corrections within
short-term upward trends typically last 5-8 trading days, so the HUI is now very
close to a short-term decision point. If the price action of the past 7 trading
days was a routine correction then during the first half of this week the HUI
should reverse upward. The lower-probability, but still plausible, alternative
is that a short-term bottom is not yet in place. In this case there will likely
be a short-lived break below support at 195 in the near future, after which the
anticipated multi-week rebound will get underway.
As advised in an
earlier commentary, the HUI has short-term upside potential to around 250.
Even if the HUI hasn't bottomed in dollar terms, the following weekly chart
of the HUI/SPX ratio suggests that it has bottomed relative to the SPX. The
reason is that corrections in the HUI/SPX ratio tend to end near the 50-week MA
and over the past two weeks the ratio rebounded after touching this MA.
The Currency Market
The Dollar Index traded as high
as 99 last week before pulling back a little. It has possibly just made a top
that will hold for a few weeks, although we won't be surprised if it moves up to
major resistance near 100 before experiencing a significant correction.
Regardless of whether a top was put in place at 99 last week or will be put in
place at around 100 in the near future, a multi-week top should soon be in place
for the Dollar Index. The big question is: Will this top a) be nothing more than
a pit-stop on the road to significantly higher levels over the months ahead, or
b) mark the end of the intermediate-term rally that began at the May-2016 low?
If the answer is "a" then the downside in the Dollar Index over the next few
weeks will probably be limited by support near 97.5, but if the answer is "b"
then a decline to the low-90s is about to begin.
We suspect that the
answer is "a", because this answer is the best fit with our assessment of the
fundamental backdrop. However, our opinion on the matter is not strong.
If the right answer is "a" then most of the equities we own and follow will come
under significant downward pressure over the next few months, but we already
have more than enough cash and are therefore not interested in reducing our
overall equity exposure. Furthermore, we want to be covered in case the right
answer turns out to be "b".
Fortunately, there is no need or good reason
to 'go out on a limb' and bet heavily on any specific short-term US$ outcome.
Instead, we will remain positioned for long-term weakness in all
central-bank-sponsored currencies and at the same time insure against disruptive
short-term US$ strength via various options (in addition to our large cash
reserve).
Updates
on Stock Selections
Notes: 1) To review the complete list of current TSI stock selections, logon at
http://www.speculative-investor.com/new/market_logon.asp
and then click on "Stock Selections" in the menu. When at the Stock
Selections page, click on a stock's symbol to bring-up an archive of
our comments on the stock in question. 2) The Small Stock Watch List is
located at http://www.speculative-investor.com/new/smallstockwatch.html
 Company
news/developments for the week ending Friday 28th October 2016:
Company
news/developments for the week ending Friday 28th October 2016:
[Note: AISC = All-In Sustaining Cost, FS = Feasibility Study, FY = Financial
Year, IRR = Internal Rate of Return, ISR = In-Situ Recovery, MD&A = Management
Discussion and Analysis, M&I = Measured and Indicated, NAV = Net Asset Value,
NPV(X%) = Net Present Value using a discount rate of X%, P&P = Proven and
Probable, PEA = Preliminary Economic Assessment, PFS = Pre-Feasibility Study]
*Alkane Resources (ALK.AX) had three noteworthy
announcements last week.
First, the company announced that it has signed
a memorandum of understanding (MOU) with Siemens regarding the potential future
purchase by Siemens of some rare-earth and specialty metals produced at ALK's
Dubbo Zirconia Project (DZP) and the purchase by ALK of some Siemens equipment
and systems that would be used at the DZP.
The MOU doesn't imply any
commitment by either company. As far as we can tell, it does no more than
document that the two companies are in discussions about how they could work
together in the future. However, it's an unquantifiable plus that a global
industrial conglomerate is interested in discussing potential deals with the
relatively miniscule ALK. It is further evidence that the DZP is commercially
viable.
Second, ALK issued its quarterly report for the September
quarter. The report quantified the adverse effects of unusually heavy rainfall
over the past few months in the area of the company's Tomingley gold mine. Gold
production during the quarter was about 10K ounces, which was about 6K ounces
below plan. As a result, costs were much higher than planned and the mine was
cash-flow negative by around A$5M. The company still expects to meet its FY2017
production guidance of 65K-72K ounces of gold, but the average cost of
production will probably be about A$100/oz higher than originally expected.
Third, ALK advised that by using a modular construction method, with much of
the construction happening off site, it should be possible to reduce the total
capital cost of the DZP from US$930M to US$840M and to reduce the up-front
capital cost from US$930M to US$480M. This is very good news.
Between now
and the end of March-2017 a revised financial model for the project will be
prepared on the basis of the aforementioned modular construction methodology.
This will help us quantify the value of the DZP.
*Energy
Fuels (EFR.TO, UUUU) announced that holes drilled to define/expand the
high-grade underground uranium resource at its Canyon mine in Arizona had
discovered an extensive system of high-grade copper mineralisation. The best
intercept was 5 feet of averaging 31.7% copper. This suggests the potential for
copper to be recovered as a byproduct of uranium production, thus significantly
lowering the cost of producing the uranium.
*Pilot Gold
(PLG.TO) was last mentioned in the 15th August Weekly Update. At that
time we wrote that a) PLG's management would probably do an equity financing to
top up the treasury within the next few months and b) the sharp move upward in
the stock price to the mid-C$0.90s had created a short-term selling opportunity.
The anticipated equity financing was announced last week. Specifically, PLG
announced that it was raising C$12.5M by issuing 21M units at a price of
C$0.60/unit, with each unit comprising one common share and half of one 2.5-year
share purchase warrant with an exercise price of C$0.90. The equity financing
removes a short-term risk, but we do not view PLG as a short-term buy at this
time.
PLG is the only pure exploration play in the TSI List, that is, PLG
is the only company we follow that needs exploration success to increase its
value.
*Premier Gold (PG.TO) announced that it
has done deals with Kinross Gold (KGC) and Goldcorp (GG) regarding
exploration-stage gold-silver projects in Nevada and Mexico. PG can earn 50% of
KGC's Goldbanks project in Nevada by spending US$20M on exploring the project
over the coming 5 years and 100% of GG's Alto-Cristina poly-metallic project in
Mexico by making US$4.5M in staged payments.
Although both projects
appear to have considerable potential, they are at early stages of development
and have unquantifiable value at this time. Moreover, for a company of its size
PG already has enough high-potential exploration-stage projects in its
portfolio, so we wonder why it is diverting management time and financial
resources to new projects. Our concern is that the company is either losing
focus (spreading itself too thin) or is becoming less enthusiastic about one or
more of its existing projects.
Judging by the stock's recent performance,
we aren't alone in having this concern.
*Sprott Resource
Corp. (SCP.TO) advised that it has purchased 10M Corsa Coal (CSA.V)
shares at C$0.10/share as part of CSA's recent private placement. SCP now owns
325M CSA shares, or about 17.2% of CSA. Given that SCP owned about 330M CSA
shares at 30th June, this means that SCP sold about 15M CSA shares and then
replaced 10M shares via the private placement.
At the current price of
CSA shares (C$0.12), SCP's stake in CSA is worth about C$39M. This amounts to
C$0.40 per SCP share, so about 80% of SCP's current market cap is justified by
its holding of CSA shares.
*Taseko Mines (TGB)
reported its operating and financial results for the September quarter. The
company reported improvements in production and production costs, but these
operational improvements didn't translate into better financial performance. Of
particular importance, TGB experienced a balance sheet deterioration of C$17M
during the quarter, with net debt (long-term debt minus working capital)
increasing from C$285M to C$302M.
TGB is a highly leveraged play on the
copper price. It is likely to achieve additional improvements in production
costs over the next few quarters, but as long as the copper price is in the
low-$2 area or lower it will lose money during most quarters. We expect that it
would be significantly profitable at a copper price of US$2.50/pound and very
profitable at a copper price of US$3.00/pound. We expect that copper will trade
at $3/pound before the end of next year, but we are not bullish on copper with
regard to the next few months.
A few more months of weakness in the US$
copper price will not present a major financial problem for TGB, partly because
the company is hedged via put options (the bulk of TGB's production over the
coming three months is protected by copper put options with a US$2.10 strike
price) and partly because 80% of the company's costs are C$-denominated.
However, the stock is not going to perform well until there is some evidence
that the copper price has commenced an upward trend.
New
TSI Stock Selection
We wouldn't be interested in gold-mining
stocks if we weren't long-term bullish on gold, but the gold-mining stocks that
usually interest us the most offer substantial upside potential assuming no
change in the gold price. It's the same story with non-gold mining stocks. We
sometimes make exceptions in order to obtain greater leverage, but we generally
want commodity-related equities that aren't totally reliant on a higher
commodity price.
Just to be clear, even when a commodity
producer/explorer is under-valued based on the current commodity price it will
usually be an uphill battle for the stock if the price of the underlying
commodity doesn't rise. However, when the stock being bought is under-valued
based on the current commodity price the risk of loss will be lower and there
will be a realistic chance of stock-price gains that are independent of the
commodity's performance.
Australia-listed Blackham Resources
(BLK.AX), today's addition to the TSI Stocks List, is a gold-mining
stock that is sufficiently under-valued at last Friday's closing price of A$0.69
to make possible a doubling of its stock price over the next 12 months assuming
no change in the gold price. Here's the BLK story in point form:
1) The
company has 285M shares outstanding and 322M shares on a fully diluted basis.
This means that the current market cap is A$200M or US$152M (assuming an A$/US$
exchange rate of 0.76).
2) The company's flagship asset is the Matilda
Gold Project in Western Australia. This project has a total in-ground resource
of 5.1M ounces, with 2.4M of these ounces in the M&I category.
3) All of
the aforementioned in-ground ounces are within a 20km radius of the company's
fully-operational Wiluna gold processing plant.
4) Initial production
will be from the Matilda open-pit mine, which has a total resource of about 720K
ounces (460K ounces M&I) and is located 19km from the Wiluna plant. The first
gold pour happened about two weeks ago.
5) The plan is to ramp up
production from the Matilda mine to around 100K ounces/year at an AISC of
A$1120/oz (US$850/oz). We think that IF this plan is achieved over the months
ahead then fair value for BLK will be roughly double the current stock price
assuming no change in the gold price. The reason is that a market cap of at
least US$300M (double the current market cap) would be fair or even conservative
for a profitable 100K-oz/year gold producer in a politically-secure location.
6) Mining of the Matilda project is currently focused on oxide ore. However,
it might be possible to expand the production rate to 200K ounces/year by mining
the sulphide resource that sits below the oxide resource. A study is underway to
determine the economic viability of doing so.
7) Just 10 weeks ago, BLK
raised A$25M via an over-subscribed equity financing at A$1.00/share (with no
warrant). Since that time there have been no company-specific negative
developments, only a change in market sentiment. The shares are now available at
a 30% discount to this recent financing price.
8) We estimate that the
company has $30M of debt and $30M of cash, for a net-debt position of
approximately zero.
9) A bit less than half of next year's production
has been forward sold at A$1749/oz (about A$80/oz above the current gold price).
This should ensure that BLK is strongly cash-flow positive next year as long as
it achieves its production forecast.
10) The main risk is with execution
of the production plan. The transition from developer to producer can result in
a large upward re-rating of a company's stock price, but this transition period
is also when there is a higher probability of something going wrong. It's a
high-risk/high-reward period in the evolution of a mining company.
11) We
are prepared to accept the transition-to-production risk with BLK due to the
fact that great expectations are obviously NOT factored into the current stock
price.
At this time, a reasonable accumulation plan for BLK and almost
any other gold-mining stock would entail averaging-in on weakness over a few
months. It's possible that BLK is close to a correction low, but there is a risk
that bearish market sentiment will drag its price down to lower levels even if
the company's production ramp-up happens with only minor teething problems.
List
of candidates for new buying
From within the ranks of TSI stock
selections the best candidates for new buying at this time, listed in
alphabetical order, are:
1) AAU near US$1.00 (last Friday's closing
price: US$1.30)
2) EVN.AX near A$2.00 (last Friday's closing price:
A$2.17)
3) PG.TO (last Friday's closing price: C$2.87)
4) PRQ.TO
(last Friday's closing price: C$1.92)
5) RMS.AX (last Friday's closing
price: A$0.47)
Note that the above list is limited to five stocks. It
will sometimes contain less than five, but it will never contain more than five
regardless of how many stocks are attractively priced for new buying.
Chart Sources
Charts appearing in today's commentary
are courtesy of:
http://stockcharts.com/index.html
http://bigcharts.marketwatch.com/
http://research.stlouisfed.org/
