Platinum versus
Gold / Considerable Slack
The following is an extract from
commentary that was posted at www.speculative-investor.com on 14th April
2002.
Platinum versus Gold
Although they are both precious metals
the prices of platinum and gold respond in very different ways to different
economic and monetary environments.
Below is a long-term chart of the platinum/gold
ratio. The chart was taken from http://www.cairns.net.au/~sharefin/Markets/Master.htm,
an excellent resource for financial market data. We've added notes and
lines to the chart to illustrate (labour?) the point we are about to make.
Platinum tends to out-perform gold
during prolonged periods of economic growth or perceived monetary stability
and to under-perform gold during prolonged periods when confidence in the
economy and the financial system is deteriorating. This relationship occurs
due to gold's status, a status that has developed over thousands of years,
as the ultimate form of money outside the financial system.
With reference to the above chart we
can see that the platinum/gold ratio plunged (the gold price rocketed higher
relative to the platinum price) during the early-1970s and bottomed, in
late-1974, at around the same time that the stock market was hitting its
major low. It is also apparent that the platinum/gold ratio trended higher
from 1982 through to 2000, reaching what looks like a bubble peak in late-2000
at around the same time that the stock market bubble began to lose air
at a rapid rate.
If the decline in the stock market
and real economic growth over the past 18 months represents nothing more
significant than an interruption to the 1990s' boom then the platinum/gold
ratio will move above its 2000 peak over the coming 2 years. However, if
we have just witnessed the end of an era characterised by, amongst other
things, growing confidence in government, central banks and the fiat money
system, then the year 2000 gave us a multi-decade peak in the platinum/gold
ratio.
Our analyses of all the financial markets
over the past few years strongly suggest that the level of confidence in
government and government-sponsored money made a secular peak in 2000 and
is now in a secular downtrend. As such, the downturn in the platinum/gold
ratio in late-2000 represents a major trend reversal.
The above chart shows that trends in
the platinum/gold ratio, once set in motion, tend to continue for at least
4 years. In other words, we should expect the gold price to trend higher
relative to the platinum price until at least the second half of 2004.
This means that although some exposure to platinum (via the stocks of platinum/palladium
producers) is desirable we should, based on the evidence at hand, continue
to substantially overweight gold relative to platinum in our investment
portfolios.
There are certainly going to be extended
periods over the next few years - periods when the prospects for economic
growth temporarily take a turn for the better - when platinum will out-perform
gold. However, the trend in the ratio is now DOWN and we will not be surprised
if gold trades higher than platinum at some point over the next 2-3 years.
Considerable Slack
"Inflation declined during the recession
and seems poised to decline further as growth accelerates in an economy
with considerable slack," he [Dallas Federal Reserve Bank President
Robert McTeer] said in the Dallas Fed's annual report.
The above really is an incredible statement
from the president of the Dallas Federal Reserve Bank. There was apparently
so little slack in the economy during 1999 that the Fed felt compelled
to raise short-term interest rates a number of times, yet today, with consumer
spending and the overall level of indebtedness having grown considerably
over the past 3 years, the economy supposedly has "considerable slack".
We wouldn't argue that there is considerable slack in those few sectors
of the economy where capacity was expanded at a phenomenal rate during
the Fed-sponsored NASDAQ bubble (eg, the telecom industry), but the absence
of "slack" that led to an energy crisis during 2000-2001 has certainly
not been addressed.
The 'lack of slack' in the US economy
is evidenced by the surge in energy prices over the past 5 months despite
the continuing strength of the US$ (only the recent gains were Middle East
related). It is also evidenced by the behaviour of the bond market.
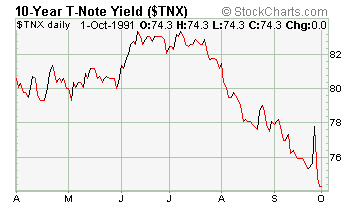
Below is a chart showing the yield
on the 10-year T-Note during the 6-month period following the 1990-1991
recession. At the end of a recession there is typically a lot of 'slack'
in the economy and this 'slack' enables long-term interest rates to fall
during the initial stages of recovery. This is what happened after the
early-90s recession.
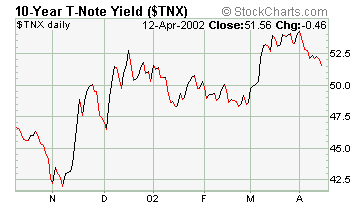
Below is a chart showing the yield
on the 10-year T-Note over the past 6 months. If there really was "considerable
slack" in the economy and inflation really was "poised to decline further"
then interest rates would still be trending lower. That is clearly not
the case.
When McTeer uses the word inflation
he is incorrectly referring to an increase in the CPI. If we define inflation
correctly (as an increase in the supply of money) then the current US inflation
rate is 9.1%. This inflation will eventually put upward pressure on some
prices, although anyone who truly believes that the CPI accurately represents
cost of living changes, or is even an honest attempt to accurately represent
cost of living changes, deserves a gullibility award. Ironically, if we
define our terms correctly then McTeer's statement that inflation is "poised
to decline further" is actually true since the money supply growth rate
is
poised to decline further.
Regular financial market forecasts
and
analyses are provided at our web site:
http://www.speculative-investor.com/new/index.html
One-month free trial available.

|