Manipulation
Versus Natural Market Forces
Introduction
The evidence that the gold market has
been manipulated by governments, central banks and private bullion banks
over the past several years is overwhelming. There is nothing unusual here
- governments have attempted to manipulate the price of gold in one way
or another for centuries. The difference, this time around, is that the
manipulation has occurred primarily via loans, swaps and derivatives rather
than via straightforward sales. This has meant that a large portion of
the flow of official-sector gold to the market has not been reported and
has, therefore, been invisible to the vast majority of market participants.
We accept that the gold market was
and still is being manipulated by governments and private bullion banks,
but we have not devoted much space in our gold market commentary to this
manipulation. This is due to our belief that the manipulation would fail
once the underlying trends in the financial markets turned positive for
gold. In fact, if we did believe that manipulation was the dominant force
in the gold market and was likely to remain so, we would not be interested
in gold and gold stocks as investments. After all, it makes no sense to
call "tails" in a coin toss when you know the coin has two heads.
Over the past 12 months we've looked
at a number of relationships involving gold, gold stocks, real interest
rates, yield spreads and currency exchange rates, the most important of
which are outlined below. Taken together, these relationships establish
that the underlying trends in the financial markets turned unambiguously
positive for gold during the final quarter of last year.
Financial Market Trends
1. Gold Stocks versus Real Interest
Rates
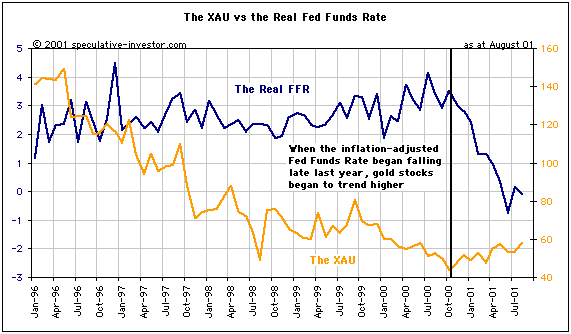
The below chart shows the real (inflation-adjusted)
Fed Funds Rate (FFR) and the XAU. Historically, falling real interest rates
have been positive for gold-related investments and, in this respect, the
past year has not been an exception. Note that the XAU commenced its up-trend
around the same time that the real FFR began to dive.

There have been several short-lived
rallies in gold stocks since the XAU peaked in early-1996, but the current
rally (the one that began in November 2000) is the only one that has been
preceded by, and supported by, a meaningful reduction in the real Fed Funds
Rate. When the real FFR is declining it means that short-term interest
rates are falling relative to the CPI (in our calculations we use the median
CPI reported by the Cleveland Fed), thus increasing the attractiveness
of gold relative to interest-earning securities. Another way of saying
this is that the investment demand for gold increases as the real return
on US$ securities approaches zero.
2. Gold Stocks versus the Yield
Spread
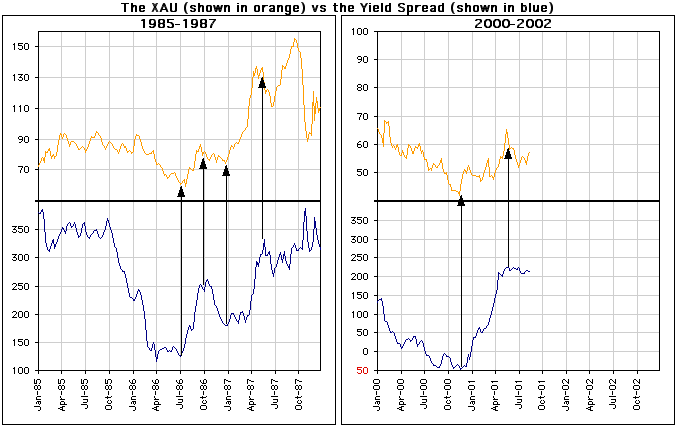
The below chart shows comparisons of
the yield spread (the yield on the 30-year T-Bond minus the yield on the
13-week T-Bill) and the XAU during the 1985-1987 and current periods. A
rising yield spread tends to coincide with higher gold and gold stock prices
because it often indicates that an increasing inflation premium is being
built into long-term interest rates.

During the mid-1980s gold bull market
the XAU and the yield spread moved in synch with each other. For example,
both turned higher in mid-1986, made short-term peaks in late-September
of 1986, corrected into January of 1987, and then moved sharply higher.
A similar pattern is unfolding at the present time with the XAU turning
higher with the yield spread in November of last year and then making a
short-term peak in May this year in parallel with a peak in the yield spread.
3. Gold and the Dollar
The inverse correlation between the
Dollar and gold is very powerful, but this doesn't mean that every day
the Dollar drops the gold price is going to rise and every day the Dollar
rises the gold price is going to fall. The Dollar's trend is, however,
the dominant influence on the gold price trend. The gold price is going
to eventually move higher in response to Dollar weakness, but the path
to much higher gold prices will not be smooth.
To illustrate the strong relationship
between the gold and currency markets we prefer to use the Swiss Franc
rather than the Dollar Index. This is because the Dollar Index includes
some currencies, such as the Yen, that do not have a strong positive correlation
to the gold price, whereas the Swiss Franc and the gold price have exhibited
a strong positive correlation for many years.
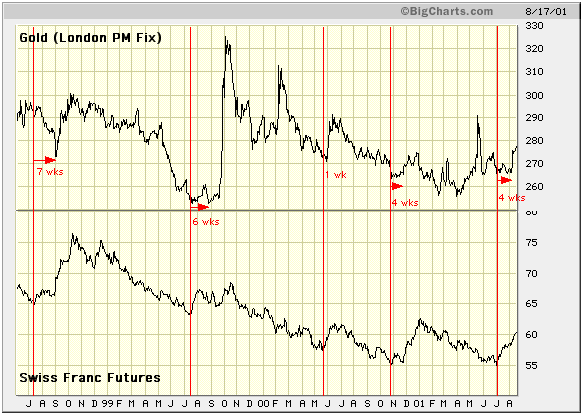
The following chart compares the gold
price with the Swiss Franc since mid-1998. The vertical red lines indicate
the points at which the SF made a medium-term low. On the gold chart we've
noted the number of weeks that elapsed from the time the SF bottomed and
turned higher to the time the gold price turned higher.

The chart shows that significant upward
reversals in the SF have led upward reversals in the gold price by as few
as one and as many as seven weeks. The gold price also bounced in February
2000 without any assistance from the currency market.
Conclusion
We accept most of GATA's assertions
regarding gold market manipulation, but we do not believe that this manipulation
is the 'be all and end all' of the gold market. We certainly do not think
it is coincidental that the XAU commenced a nine-month (and counting) up-trend
at the same time that the European currencies, the yield spread and the
inflation-adjusted Fed Funds rate experienced important trend reversals.
Although we have not yet seen an explosive rally in the gold price, it
does seem that natural market forces have begun to get the upper hand over
the manipulation that no doubt continues behind the scenes.
Regular financial market forecasts
and
analyses are provided at our web site:
http://www.speculative-investor.com/new/index.html
One-month free trial available.

|

