Stocks, Bonds
and the Dollar
Stocks and Bonds - the
Big Picture
A secular uptrend in stock prices and
a secular downtrend in interest rates began in the early-1980s. Despite
what we, or anyone else, might think about where stocks and bonds are headed
over the next few years, it is an indisputable fact that these secular
trends remain in place at this time.
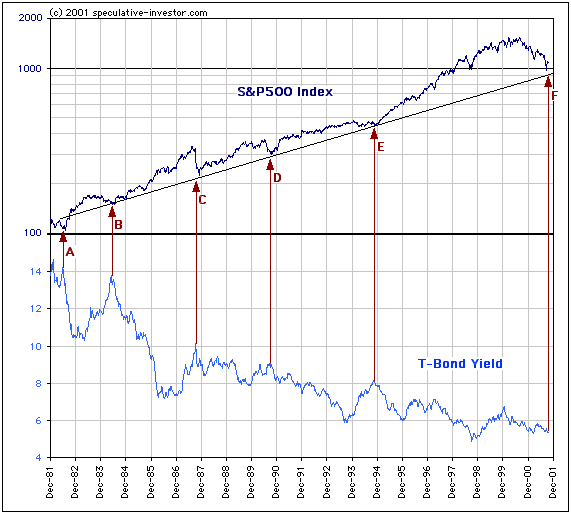
Below is a chart showing the long-term
upward trend in the S&P500 Index (using a log scale) and the long-term
downward trend in the US Treasury Bond yield. As severe as the decline
in the stock market has been over the past 2 years, looked at from a long-term
perspective it has, up until now, simply been a pullback to the secular
uptrend line. Such a substantial decline was needed in order to bring the
market back to its long-term trend because prices had moved so far above
trend during the second half of the 1990s.

Point A on the chart marks the bottom
in 1982 from which the secular bull market in stocks was launched. Points
B, C, D, and E show the prior occasions on which the major trend was tested
(1983, the 1987 stock market crash, the recession of 1990, and 1994). Point
F marks the test that occurred in the aftermath of last month's terrorist
attacks. From the time the secular bull market began in 1982, each test
of the major uptrend has been followed by a cyclical bull market that has
lasted from 2 to 5 years. So, should we expect that another bull market
lasting at least 2 years and possibly as long as 5 years is about to begin?
We certainly can't eliminate that possibility,
but the chart highlights one very important difference between this year's
test of the major uptrend and the previous tests. That difference is the
behaviour of the bond market. When the stock market was in the process
of bottoming in 1982, and during the months leading up to each of the successful
tests of the secular uptrend, interest rates climbed as stock prices
fell.
In each case interest rates peaked at the same time as, or just before,
stock prices bottomed. The trend reversal in interest rates from up to
down then provided the fuel for the next multi-year uptrend in the stock
market (falling interest rates: a) increase the attractiveness of equities
relative to bonds, b) enable P/E multiples to expand even if earnings growth
remains unchanged, and c) reduce the cost of doing business). However,
the recent test of the stock market's major bull trend has occurred with
interest rates having already fallen to very low levels.
With massive inflation in the pipeline
we do not expect long-term interest rates to trend lower over the next
2 years. We do, in fact, expect exactly the opposite to occur. With the
P/E multiples of many large-cap stocks already at elevated levels any shift
towards higher market interest rates will, in the absence of a spectacular
improvement in corporate earnings growth, cause P/E multiples to contract
and stock prices to fall.
While we expect a strong stock market
during the final 2 months of this year (following a short-term pullback),
we are cognisant of the fact that the latest test of the secular uptrend
really is different from the previous tests and could well have a different
outcome over the next year.
The US Dollar
The fundamentals for the US Dollar
were lousy prior to Sep-11 and have worsened as a result of the past month's
explosion in the US money supply. Since today's conventional wisdom seems
to be that no amount of Dollar-supply increase is a problem unless the
CPI is rocketing skyward, there will be no pressure on the Fed to deviate
from its inflationary policies over at least the next few months. This
means that the US' inflation problem is going to get much worse and will
eventually result in a much lower Dollar. However, this doesn't mean that
a Dollar collapse is imminent. Recall that the US stock market peaked on
Mar-24 last year, but that by the end of August last year the S&P500
had returned to near its peak. It wasn't until almost 6 months after the
March 2000 peak that the stock market began to accelerate lower. It is
possible that a similar scenario could be developing with the Dollar.
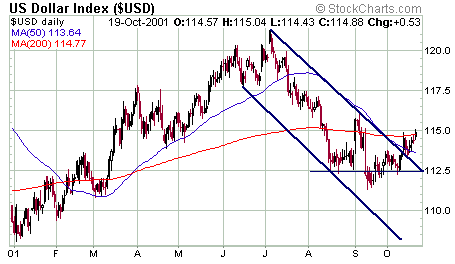
It is likely that the Dollar Index
made a long-term peak in early July this year and is presently immersed
in a bear market that will last well into next year, but the Dollar's recent
trading action could be signaling that an extended rebound is in progress.
In an e-mail to subscribers on Oct-12 we noted that the Dollar Index had
broken upwards out of its downward-sloping channel, thus providing some
evidence that a substantial recovery was afoot. By working higher over
the past week, despite being overbought, the Dollar Index consolidated
its upside breakout. We expect the Dollar Index to weaken when the stock
market's pullback picks up steam over the next two weeks, but if it can
hold above 112.50 during this pullback then a Dollar rally into year-end
becomes likely.

Regular financial market forecasts
and
analyses are provided at our web site:
http://www.speculative-investor.com/new/index.html
One-month free trial available.

|

