|
- Interim Update 7th May 2008
Copyright
Reminder
The commentaries that appear at TSI
may not be distributed, in full or in part, without our written permission.
In particular, please note that the posting of extracts from TSI commentaries
at other web sites or providing links to TSI commentaries at other web
sites (for example, at discussion boards) without our written permission
is prohibited.
We reserve the right to immediately
terminate the subscription of any TSI subscriber who distributes the TSI
commentaries without our written permission.
Administrative Note
Ever since TSI became a subscription-based web site (way back in
October of 2000) we've offered a 1-month free trial subscription. The
idea, of course, was to give people the opportunity to check out the
TSI service before parting with any money.
This shouldn't directly affect any our current subscribers, but we
wanted to let you know that we have decided to suspend our trial
subscription offer. We may reinstate it in the future, but for at least
the next few months we will not be offering any new free trial
subscriptions. Current trial subscribers will, however, be able to
complete their one-month free trials.
Two main factors contributed to the above-mentioned decision. First, we
think the markets are entering a critical multi-month time window and
we want to ensure that only paying subscribers have access to our
analysis during this period. Second, eliminating the free trial will
reduce our administration work (we hate administration work).
Most people won't pay for a subscription "site unseen", so in place of
the free trial subscription we are going to provide excerpts from TSI
commentaries at http://www.speculative-investor.com/new/freesamples.html.
These free samples will be brief and will usually not include any
time-sensitive information or specific investing/trading suggestions.
Their only purpose will be to give people who are unfamiliar with the
TSI service a taste of the sort of stuff we do.
Commodities
Uranium
At the beginning of this year most experts on uranium supply/demand
predicted strengthening of the uranium price during 2008, but it hasn't
worked out that way as the spot uranium price has fallen from around
$90/pound in early January to its current level of $63. On the positive
side of the ledger, the long-term contract price -- perhaps a better
indication of the true supply/demand situation -- has remained at
$90/pound.
The contract price may well be a better representation of the true
supply/demand picture, but the decline in the spot price has certainly
had an adverse effect on sentiment within the uranium sector of the
stock market. Also, most listed uranium miners fall into the category
of "speculative junior", so the general disinterest in junior resource
stocks has also taken a substantial toll on the uranium sector. In
fact, the decline in the spot uranium price, combined with the
market-wide lack of interest in small/speculative resource stocks, has
overridden positive seasonal influences -- uranium stocks have tended
to be strong during the first few months of the year -- and led to
uranium being one of the worst-performing sectors of the stock market
since the beginning of the year.
When it comes to the junior gold/silver stocks we have our reasons for
believing that price lows are already in place or will be put in place
within the next few weeks, but when it comes to the junior uranium
stocks we don't have any specific timeframe in mind for a turnaround.
Some of these stocks, including the three we follow at TSI (EFR.TO,
KRI.TO and UUU.TO), are very oversold and very under-valued. A trend
reversal could therefore occur in the very near future -- perhaps
concurrently with an upward reversal in the gold sector given that the
junior 'uraniums' and the junior 'golds' have a lot of shareholders in
common -- but right now we can't identify a likely catalyst for such a
turnaround. An upturn in the spot uranium price will potentially be the
catalyst, but we have no way of predicting when the spot price will
begin to move back into line with the long-term contract price.
A sign that things were turning for the better within the uranium
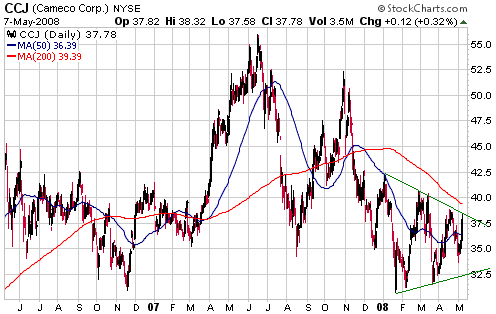
sector would be an upside breakout by Cameco (NYSE: CCJ), the world's
largest uranium miner. With reference to the following chart, CCJ has
resistance at US$38.50-$40.00. A solid break above this resistance
would suggest that the world's most important uranium mining stock was
on its way back to at least $50, which would be a plus for the entire
sector.
Meat
This article
deals with the factors that have put considerable downward pressure on
the price of meat (chicken, pork and beef) over the past year and
should lead to much higher prices within the next 12 months. We
recently added the Livestock ETN (NYSE: COW) to the TSI Stocks List
with the aim of profiting from the expected rise in cattle and hog
prices, and will look for an opportunity to add Tyson Foods (NYSE: TSN)
as a way of profiting from the expected rise in the price of chicken.
The Stock Market
Moving Average (MA) Crossovers
In the 6th February 2008 Interim Update we wrote:
"A move by the 50-day
moving average from above to below the 200-day MA is often called a
"bearish crossover", and a move by the 50-day moving average from below
to above the 200-day MA is often referred to as a "bullish crossover";
however, in a lot of cases "bearish crossovers" aren't bearish and
"bullish crossovers" aren't bullish. The reason is that downward
corrections in bull markets often end shortly after a bearish crossover
has occurred while upward corrections in bear markets often end shortly
after a bullish crossover has occurred. As a result, people who blindly
sell following bearish crossovers and buy following bullish crossovers
will often find themselves in the position where they have sold near
the bottom or bought near the top."
The upshot is that the meaning of a 50day/200day MA crossover depends
on whether a bull or bear market is in progress; or, to put it another
way, before you can come to a reasonable conclusion as to whether a MA
crossover is bullish or bearish you first need to form an opinion as to
whether the market in question is in bull or bear mode. The MA
crossover doesn't, in and of itself, tell you anything about the
intermediate-term trend.
The reason we are now dredging-up our long-standing opinion on the
significance -- or lack thereof -- of MA crossovers is that it is
relevant to the present situation. Here's why.
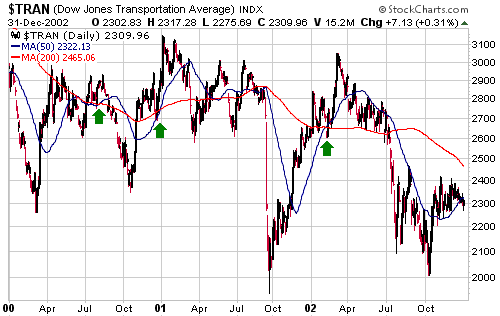
First, the following chart illustrates the performance of the Dow
Transportation Average (TRAN) during the 2000-2003 bear market.
Included on the chart are the 50-day MA (the blue line) and the 200-day
MA (the red line), as well as green arrows indicating the three
occasions on which there were 'bullish' MA crossovers. Notice that
these supposedly bullish crossovers occurred near the PEAKS of
multi-month rebounds, meaning that anyone who bought the TRAN following
these 'bullish' crossovers was stopped out very quickly or lost a lot
of money.
We won't illustrate
it via a chart, but it was a totally different story during the
2003-2007 bull market in that during this later period the bullish MA
crossovers were genuinely bullish and the 'bearish' crossovers occurred
near the BOTTOMS of multi-month corrections. That is, during the course
of the bull market anyone who short-sold following a 'bearish'
crossover was stopped out very quickly or lost a lot of money.
One reason why this is relevant to the present situation is that the
TRAN's 50-day and 200-day moving averages recently completed a
'bullish' crossover. Refer to the following chart for details.
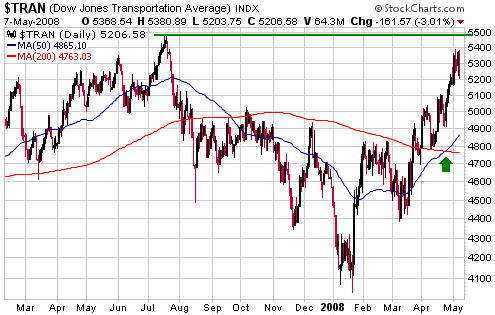
Now, regardless of
whether or not the TRAN commenced a bear market last July the rebound
from the January low was always likely to continue until the 50-day MA
crossed above the 200-day MA. In isolation this so-called bullish
crossover therefore tells us nothing about the market's longer-term
trend. The price action is consistent with the view that the cyclical
bull market resumed in January AND it is consistent with the view that
a cyclical bear market commenced last July. It's what happens next that
determines whether the bull-market or the bear-market hypothesis is
correct. If the bear-market hypothesis (our view) is correct then the
TRAN should now be close to an intermediate-term peak, but if the
bull-market hypothesis is correct then there won't be anything more
serious than a routine pullback anytime soon.
Although the TRAN's price action, in isolation, could reasonably be
interpreted either way, one aspect that skews the odds in favour of the
longer-term bearish outlook is the simple fact that last September's
bearish MA crossover did not mark a low. As noted above, 'bearish'
crossovers during bull markets typically occur near correction lows.
Another reason why our MA crossover analysis is relevant at this time
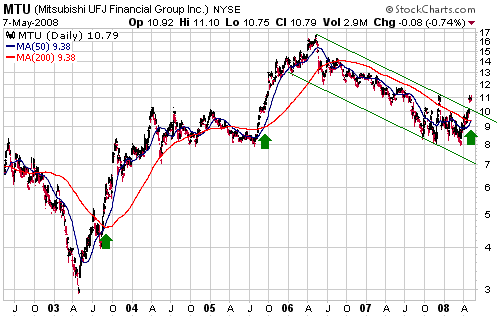
has to do with the following chart of Mitsubishi Financial Group (MTU),
Japan's largest bank. The chart shows that MTU's 50-day MA is just
about to move above its 200-day MA, which suggests that MTU is either
poised to move much higher over the coming several months or is close
to resuming its intermediate-term decline. Obviously, there's all the
difference in the world between these alternatives.
In MTU's case we are
on the bullish side of the fence, for two reasons. First, we think that
MTU, along with the overall Japanese stock market, commenced a
long-term bull market in 2003, the initial leg of which ended in May of
2006. Second, at no time since the beginning, in May of 2006, of its
lengthy downward correction has MTU's 50-day MA come close to crossing
above its 200-day MA...until now. In other words, in this case the MA
crossover appears to be confirming a change of character within the
market.
MTU's 2003 and 2005 bullish crossovers -- marked by the green arrows on
the above chart -- were followed by gains of 65% and 90%, respectively,
over the ensuing 8 months. If there's a similar outcome this time round
then MTU will trade at $17-$20 by early next year.
We suggest that traders with a 6-12 month timeframe take a position in MTU following a pullback to the low-$10 area.
Current Market Situation
On an intermediate-term basis the biggest obstacle facing the stock
market will, we think, prove to be the resumption of the debt crisis
and the resultant additional large capital-destroying write-offs within
the banking sector. With regard to the short-term, however, most market
participants appear to be operating under the assumption that the worst
of the credit-related news is in the past, or, if not, is fully
discounted in current stock prices. In the short-term the biggest
obstacle facing the stock market isn't the likelihood of more
credit-related issues within the banking sector, it's the relentless
advance of the oil price.
When the oil market is strong and the broad stock market is weak, the
large-cap oil stocks tend to be flat at best. Putting it another way,
the oil sector of the stock market generally doesn't benefit from
oil-price strength unless the broad stock market is firm or stable.
This interesting tendency of the oil sector goes a long way towards
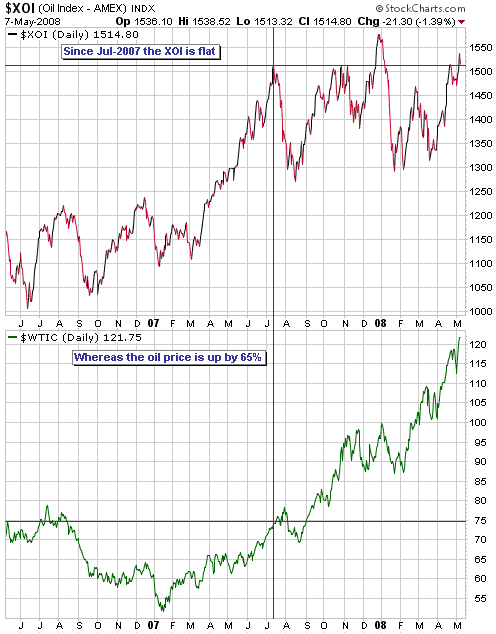
explaining the following chart, which shows that the AMEX Oil Index
(XOI) is at roughly the same level now as it was in July of 2007 --
when oil was at $75/barrel.
The XOI usually peaks many months after oil has peaked, so the fact
that oil has just made a new high bodes well for the XOI. When oil's
intermediate-term trend reverses from up to down, the normal pattern is
for the XOI to fall during the initial phase of oil's intermediate-term
decline and to then rally to new highs.
The US stock market
made a marginal new multi-month high on Tuesday and then pulled back
sharply on Wednesday. If this pullback continues for a few more days it
will probably have the effect of extending the overall rebound from the
January-March 'double bottom' because it will re-energise the bears and
dishearten the bulls. Increased negativity at this time would be a plus
because the upward trend should continue until bullish sentiment
dominates.
Gold and
the Dollar
Gold Stocks
Current Market Situation
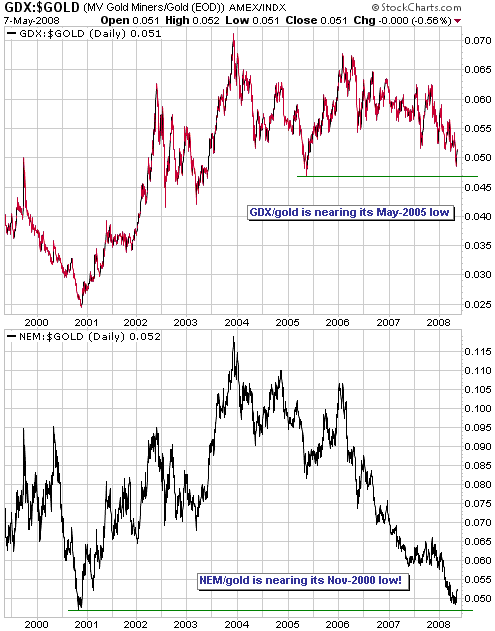
To get an idea of how cheap the gold sector has become, refer to the
following charts of the GDX/gold and NEM/gold ratios. These charts show
that relative to gold bullion GDX is now almost as cheap as it was in
May of 2005 and NEM is almost as cheap as it was at the secular bear
market bottom of November-2000.
Despite the relative
cheapness of most gold stocks we wouldn't immediately 'jump in with
both feet' because there's a significant chance of a final sharp
decline prior to the start of the next multi-month advance.
Furthermore, the coming fortnight is the most likely timeframe for such
a decline. We therefore think it makes sense to 'keep some powder dry'
in anticipation of an even better buying opportunity in the near
future.
As noted in the latest Weekly Update, we will turn short-term bullish
on the gold sector following a drop by the HUI to the 350s OR following
an upward reversal in the HUI's MACD, whichever happens first.
IF there is a final plunge over the next two weeks then we will
probably add some January-2009 GDX and NEM call options to the TSI
Stocks List to increase our leverage to the ensuing sector-wide
rebound. However, if a rally begins without a preceding plunge to the
mid-300s then we will probably focus solely on the junior and mid-tier
mining stocks.
The lack of M&A
A question we've been asked a few times of late goes something like
this: if there is so much value within the ranks of junior gold stocks
then why aren't the larger companies taking advantage of the situation
by going on acquisition sprees?
One reason there isn't much M&A (merger and acquisition) activity
right now, despite the low stock prices, is that company CEOs are
subject to the same sentiment swings as the investing public. What
usually occurs, therefore, is that M&A activity follows price; that
is, the frequency and aggressiveness of takeovers tends to increase as
stock prices rise and decrease as stock prices fall. Recall, for
example, the huge volume of deals that were done in the tech sector at
around the time of the NASDAQ's bubble peak, and the almost total
absence of M&A activity after the average NASDAQ stock had fallen
by more than 80% from its peak.
The point is: near stock market tops the future invariably looks bright
to most people (including those who run companies) and buying feels
comfortable/natural even though stocks are obviously expensive, whereas
near stock market bottoms the future looks uncertain or bleak and
buying seems less justifiable even though stocks are obviously cheap.
Another reason that applies primarily to grossly under-valued junior
gold stocks is that it would currently be impossible to entice the
major shareholders of many of these small companies to sell at anywhere
near a normal takeover premium. Most managers of large or mid-tier gold
producers would not want to offer more than 30-40% above the current
market price for a junior mining company because if they did they'd be
accused of over-paying, but many of the juniors we follow would still
be very under-valued if their prices were to DOUBLE from current
levels. While the average small shareholder may well leap at the chance
to exit at 30% above today's prices, the well-heeled investors that
speak for large chunks of stock will, in general, want to be paid
prices that reflect full value. The thing is, takeover bids that
reflect full value will not be feasible until after stock prices have
already made big upward moves.
What we expect to happen is that prices will double, and then double again, and THEN there'll be a rash of takeovers.
Currency Market Update
From the 28th April Weekly Update:
"In our opinion, the
Dollar Index is 5-6 weeks into a rebound that will last 3-6 months. One
way for speculators to 'play' this potential outcome would be to
average into FXE Sep-2008 $150 put options (FXE is an ETF that tracks
the euro), preferably on days when the euro is bouncing. A protective
'stop' could be placed just above the recent high, the idea being to
exit if the euro closes at a new high.
The major currency with
the most downside potential over the coming months is the Australian
Dollar...so speculators could also consider averaging into FXA Sep-2008
$90 put options (FXA tracks the A$). Note, though, that FXA puts are
quite illiquid. Note also that the A$ has not yet signaled a peak,
which means that a final surge could still be in store and that there
is no obvious chart-based level at which to place a 'stop'. In other
words, a bet against the A$ is more risky than a bet against the euro,
but if offers greater profit potential."
The A$ has still not signaled a peak relative to the US$, making it the
only major currency not to have done so. However, we see no reason to
expect the A$ to buck the new currency-market trend and therefore
continue to believe that FXA puts are a worthwhile speculation.
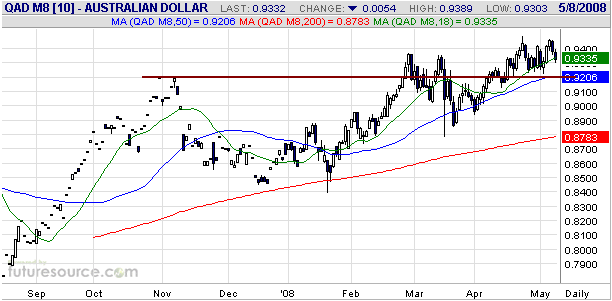
With reference to the following daily chart, a close below 0.92 by the
June A$ futures contract would be preliminary evidence that a peak was
in place, so it would be reasonable to take an initial position in
September-2008 FXA $90 put options now with the aim of 'doubling up'
following a daily close below 0.92.
Update
on Stock Selections
(Note: To review the complete list of current TSI stock selections, logon at http://www.speculative-investor.com/new/market_logon.asp
and then click on "Stock Selections" in the menu. When at the Stock
Selections page, click on a stock's symbol to bring-up an archive of our comments on the stock in question)
 Brief
comments on our natural gas stocks (Fairborne Energy and the 'gassy'
trusts), Patriot Coal (NYSE: PCX), and Gold-Ore Resources (TSXV: GOZ)
were emailed to subscribers on 6th May. The email (Stock Selection
Update #50) has been archived at: http://www.speculative-investor.com/new/stockemail.asp. Brief
comments on our natural gas stocks (Fairborne Energy and the 'gassy'
trusts), Patriot Coal (NYSE: PCX), and Gold-Ore Resources (TSXV: GOZ)
were emailed to subscribers on 6th May. The email (Stock Selection
Update #50) has been archived at: http://www.speculative-investor.com/new/stockemail.asp.
Chart Sources
Charts appearing in today's commentary
are courtesy of:
http://stockcharts.com/index.html
http://www.futuresource.com/

|

