|
-- Weekly Market Update for the Week Commencing 1st December 2003
Big Picture
View
Here is a summary of our big picture
view of the markets. Note that our short-term views may differ from our
big picture view.
Bond yields (long-term interest
rates) reached a major low in June of 2003 and will trend higher until
at least mid 2004.
The US stock market will reach
a major bottom (well below the October-2002 low) during 2004.
The Dollar commenced a bear
market in July 2001 and will continue its decline during 2003 and 2004.
A bull market in gold stocks
commenced in November 2000 and will continue during 2003 and 2004.
Commodity prices, as represented
by the CRB Index, will rally during 2003 and 2004 with most of the upside
occurring in 2004.
Copyright
Reminder
The commentaries that appear at TSI
may not be distributed, in full or in part, without our written permission.
In particular, please note that the posting of extracts from TSI commentaries
at other web sites or providing links to TSI commentaries at other web
sites (for example, at discussion boards) without our written permission
is prohibited.
We reserve the right to immediately
terminate the subscription of any TSI subscriber who distributes the TSI
commentaries without our written permission.
Interest
Rates and Oil
We expect the Fed to hike short-term
interest rates aggressively during 2004; not as part of a well thought-out
plan or because Fed Chairman Alan Greenspan is not politically astute (he
is most definitely a political animal), but rather because the bond market
will force the Fed's hand. In a nut-shell, we think the Fed governors mean
what they say when they talk about leaving the Fed Funds Rate near its
current low levels for the foreseeable future and we are well aware that
the Fed will not want to hike rates during the months leading up to the
November-2004 Presidential election. However, once long-term interest rates
begin to move sharply higher in response to growing inflation fears the
Fed will have no choice other than to hike short-term rates with
some urgency in order to rein-in the inflation fears. Not to do so, in
such a situation, would invite a collapse in the value of the dollar and
all dollar-denominated debt.
In other words, our forecast of a substantially
higher Fed Funds Rate by this time next year is inextricably linked to
our forecast of a large decline in bond prices (a large rise in long-term
interest rates) over the next 6-12 months. In the absence of a large fall
in long-term bond prices, though, the Fed will have the freedom to do whatever
it wants with short-term rates. And Fed representatives have made it crystal
clear that what they want is for short-term rates to remain near multi-decade
lows over the coming year.
The upshot of the above is that if
something happens to prevent long-term US interest rates from rising then
the Fed will almost certainly NOT hike short-term rates. The question is;
what could prevent long-term rates from rising or even cause them to fall?
As discussed in previous commentaries,
the Fed could not prevent long-term rates from rising by directly intervening
in the market (for example, by buying bonds). Such an action on the part
of the Fed in an environment in which inflation fears were already rising
would be counter-productive because it would heighten the inflation
fears.
In fact, the only forces that would
appear to be capable of holding-down long-term US interest rates are forces
over which the Fed has no direct control.
Foreign central bank buying of US bonds
is probably the most obvious and also the most benign (from a short-term
US perspective) of these forces. In their efforts to prevent their currencies
from appreciating against the US$ some foreign central banks have made enormous
purchases of US bonds over the past year, thus helping to perpetuate the
'low-inflation illusion' and the low interest rate environment in the US.
However, while it is reasonable to assume that foreign central banks will
continue to provide significant support to US bond prices during periods
of US$ weakness it is doubtful that they could stem the tide in an environment
in which inflation fears were rising at a rapid rate. In particular, the
buying of US bonds by foreign central banks would likely be insufficient
to prevent long-term US interest rates from rising if private investors,
as a group, began to reduce their exposure to dollar-denominated
debt (over the past year non-US private investors have increased their
combined exposure to US debt securities, albeit at a slower rate than in
previous years).
Foreign central banks are likely to
play a part in supporting US bond prices over the coming year, but in isolation
we don't think they represent a major threat to our forecast for a substantial
rise in US interest rates.
We think the biggest risk to our current
interest rate forecast revolves around the relationship between oil and
bonds discussed in the 24th November Weekly Update. Just to recap; in the
aforementioned commentary we showed that the US T-Bond price has followed
the oil price with remarkable consistency over the past 2 years, a relationship
that makes some sense if we assume that the oil price has been driven primarily
by geopolitics over this period. This suggests that an upheaval somewhere
in the world that threatens to disrupt the oil supply has the potential
to cause capital to come flooding into US Government debt.
As well as giving a substantial boost
to US bond prices an 'oil supply shock' would prompt a sharp sell-off in
the US stock market and in non-energy commodities. Therefore, even if such
a supply shock turned out to be short-lived it would effectively remove
any pressure on the Fed to hike short-term interest rates. In other words,
in such an environment Greenspan and Co. would be able to follow-through
on their promise to leave the Fed Funds Rate at multi-decade lows for the
next year, although we doubt that an oil-related crisis is something which
is currently at the forefront of their minds.
By the way, an oil crisis would not
necessarily originate in the Middle East. For example, a substantial portion
of the oil imported by the US comes from Venezuela, so a problem in Venezuela
could turn out to be the catalyst for such a crisis.
At this stage our forecast is for the
oil price to experience a normal bull-market correction to the low-20s
over the next several months so we are obviously not anticipating an oil
crisis. However, we don't know what is going to happen in the future and
if the situation starts to evolve in a way that does not mesh with our
expectations then it will be important to revise our expectations. After
all, we don't make forecasts for the sake of making forecasts. Our goal
is to make money and any forecasts we make along the way are just roadmaps
that are always subject to change as the facts change and/or as more evidence
becomes available.
Below is a weekly chart of oil futures.
A weekly close above $32.50 in the nearest futures contract would warn
us that an oil crisis might be brewing and prompt us to re-assess our interest
rate forecasts.

The US
Stock Market
Stocks, bonds, and the liquidity
cycle
Over the past 6 years the US stock
market has been locked in a liquidity cycle. The cycle, which has occurred
three times since 1998, goes something like this:
1. Stock prices decline and bond prices
rally (interest rates fall)
2. The lower interest rates cause credit
to expand at a faster pace
3. The increased rate of credit expansion
creates liquidity in the financial markets and this liquidity eventually
reverses the decline in stock prices
4. Stock prices start to rally and
bond prices start to decline (interest rates begin to rise)
5. Rising long-term interest rates
slow the rate of credit expansion and the level of liquidity begins to
drop
6. Eventually, reduced liquidity takes
its toll on the stock market and stock prices begin to decline
7. The bond market benefits from the
stock market decline, causing credit to expand at a faster rate and so
on.
Currently, we appear to be somewhere
between step 5 and step 6 in the cycle.
This cycle can probably continue until
the bond market stops benefiting from falling stock prices or until rising
bond prices (falling long-term interest rates) are no longer able to stimulate
faster credit growth. However, as long as this cycle does continue a major
stock market bottom will not be possible. Rather, we will continue to get
large declines in the stock market that end prematurely -- before valuations
become low by historical standards -- followed by powerful rallies.
Our current stock market forecast is
for a major low next year, but further to the above a major low will only
be possible if the above-described cycle is broken. If not, there will
still likely be a large decline, but rising bond prices and the resultant
sea of liquidity created by the US financial establishment will cause another
powerful stock-market rally to get underway before stocks have a chance
of reaching the valuation levels normally seen near bear-market bottoms.
Current Market Situation
At this stage there aren't many signs
of weakness in the US stock market. Three of our bearish early warning
signals were triggered during the week before last, but two of those signals
were negated last week as a result of the NDX/Dow ratio moving back above
its 70-day moving average and the NASDAQ Composite Index moving back into
its upward-sloping channel.
By the same token, the senior stock
indices failed to make new highs during last week's rally and we are now
entering a time of the year when important peaks have often occurred in
the past. For example, major peaks in the Dow Industrials Index occurred
on 18th January 1966, 2nd December 1968, 11th January 1973, 31st January
1994, and 14th January 2000. Also, a very important NASDAQ100 peak occurred
on 6th December 2001.
Last week's failure to break-out to
the upside opens up the possibility that the market has just completed
a successful test of the early November peak and will now move sharply
lower. If this is the case then the long-term support for the S&P500
Index that exists at around 960 (see chart below) could come into play
within the next month.
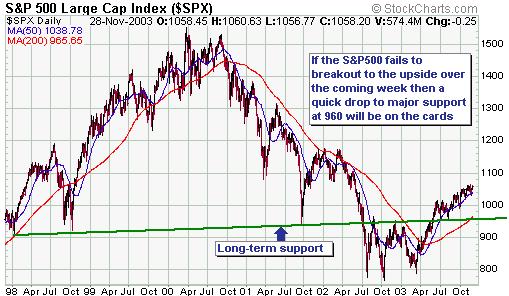
A quick drop to test support at 960
would become our favoured scenario if the S&P500 Index were unable
to breakout to the upside during the coming week and, instead, moved back
below 1050. However, by far the more likely scenario is that the market
works its way higher to what will potentially be a very important peak
during the first half of January.
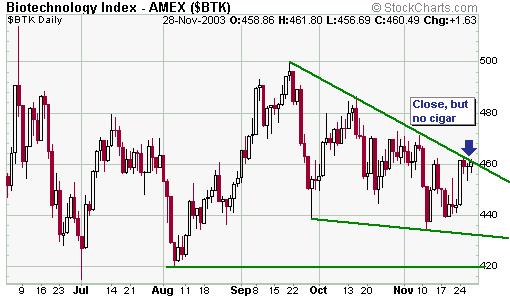
We highlighted the Biotech Index (BTK)
in last week's commentary and we'll look at it again now.
In last week's commentary we mentioned
that the BTK had pulled back, over the past 2 months, in what looked a
lot more like a bullish consolidation than the early stages of a major
decline. As the below chart shows, the consolidation is still in progress
but any additional strength over the coming week would create an upside
breakout. An upside breakout by the BTK would have short-term bullish implications
for the overall market.
This week's important economic events
| Date |
Description |
| Monday Dec 01 |
ISM Index
Construction Spending |
| Tuesday Dec 02 |
No significant events |
| Wednesday Dec 03 |
ISM Non-Manufacturing Index
Q3 Productivity and Costs |
| Thursday Dec 04 |
ECRI Future Inflation Gauge |
| Friday Dec 05 |
Employment Report
Consumer Credit |
 Click
here to read the rest of today's commentary Click
here to read the rest of today's commentary

|
