|
-- for the Week Commencing 2nd December 2002
Forecast
Summary
 The
Latest Forecast Summary (no change from last week) The
Latest Forecast Summary (no change from last week)
Big Picture
View
Here is a summary of our big picture
view of the markets. Note that our short-term views may differ from our
big picture view.
Bond yields (long-term interest
rates) will bottom during the final quarter of 2002 then move sharply higher
during 2003.
The US stock market will reach
a major bottom (well below the July-2002 lows) during the second half of
2003.
The Dollar commenced a bear
market in July 2001 and will continue its decline into 2003.
A bull market in gold stocks
commenced in November 2000 and will extend into 2003.
Commodity prices, as represented
by the CRB Index, will rally during 2002 and 2003.
Overview
We've reached a point where all the
major markets are finely balanced and ready to move sharply in one direction
or the other. Gold stocks are very close to important support and if that
support gives way it is likely that both gold and gold-stocks will plunge.
The US$ has rallied over the past 3 weeks, but has just reached a level
where the rally is likely to fail (if it is going to fail). Bonds are testing
important support and will probably fall much further if this support gives
way. The CRB Index is positioned just below major resistance, needing to
gain only 3% or so to break out to a 4-year high. And the major stock indices
are all situated just below important resistance (defined by the August
highs for the S&P500 and the Dow Industrials and the 200-day moving
averages for the NASDAQ100 and NASDAQ Composite). It would make the most
sense, based on the current fundamental backdrop, if gold stocks held support
and began to rally, thus signaling the end of the Dollar's counter-trend
rebound and projecting an upside breakout by the CRB Index and a downside
breakout by bonds. But whatever happens we expect gold stocks to provide
the early warning signal because gold is likely to move in advance of breakouts
in the CRB Index and the Dollar, and gold stocks are likely to move in
advance of gold.
Friday's holiday-shortened trading
session was notable for what didn't happen rather than what did happen.
First, bond futures didn't accelerate lower. This means that the probability
of a bond crash in the near future has been greatly reduced. Second, the
Dollar Index had moved up to near its 50-day moving average on Wednesday,
but failed to move above this milestone on Friday and actually closed lower
on the day. This means that the Dollar's recent strength still looks more
like a counter-trend move than the first leg of a rally to new recovery
highs. Third, the HUI, the XAU and most major gold stocks didn't fall below
trend-line support, which means that the benefit of the doubt should still
be given to the gold bulls.
The US
Stock Market
Credit Bubble Update
From Doug Noland's latest Credit Bubble
Bulletin at http://www.prudentbear.com/creditbubblebulletin.asp:
"But despite the gross debt overhang
and acute financial fragility, market dynamics will necessitate intermittent
reversals of these hedging programs. During these periods, the semblance
of abundant liquidity will return almost as if by divine intervention.
Surging stocks and the return of liquidity to the corporate bond market
are reinforcing, especially in over-liquefied financial markets. And most
will interpret market action as a confirmation of rapidly improving fundamentals,
when in fact rising financial asset prices have almost everything to do
with market dynamics. The performance chasing money managers and speculators
will jump on board."
[Emphasis ours]
And...
"Let's not forget that it takes
enormous amounts of unrelenting Credit creation and leveraged speculation
to sustain the Great Credit Bubble. And we certainly don't expect rampant
excess to all of the sudden turn stabilizing. In fact, we are expecting
a rather wild ride from here on out as a confluence of unprecedented monetary
and speculative excess - along with an unstable Bubble-impaired economy
- creates an especially unpredictable and volatile mix."
After appearing to be running out of
steam a couple of months ago the great US credit expansion has shifted
back into top gear. During the latest week the total US money supply (M3)
increased by $96B and over the past 6 weeks M3 has grown by $217B, an annualised
growth rate of 22.6%. The money supply increases when new debts are created
at a faster pace than existing debts are paid off, so the massive recent
additions to the money supply are indicative of aggressive new lending/borrowing.
Just when it looked as though US consumers and businesses were close to
reaching their limits of indebtedness, they went on another borrowing binge.
The on-going eagerness to borrow is
linked to the on-going eagerness to speculate in tech stocks. Both are
related to a belief that everything is going to be just fine as soon as
the nation moves through the current soft patch. This belief does, of course,
receive support on almost a daily basis from those responsible for setting
US monetary and exchange rate policies.
In the stock market, as was the case
during much of 1998-2000 and at around this time last year, traders are
presently chasing any stock that is moving and ignoring any stock that
isn't. The price of a company relative to the value of its business is
never considered. Our LightPath Technologies (LPTH), a stock that went
nowhere over the past 2 months while other stocks in the telecom equipment
sector were going ballistic, has just gained almost 100% in 2 days. There
was no news to account for the rise and, as far as we can tell, there has
not been any improvement in the company's prospects. It's just that the
stock price edged above some magical point on the chart, causing the stock
to shift from the 'non-mover' category to the 'mover' category and prompting
the movement-chasing traders to jump on board.
The ridiculous price action in tiny
stocks such as LPTH is not, however, the problem. Many small debt-free
tech companies had been sold down to the point where their market capitalisations
were less than their cash in the bank, so the businesses were being valued
at less than zero. LPTH has been dirt-cheap for a long time and if the
stock price doubled again over the coming week the stock would still be
reasonable value. The problem is that many of the large companies never
got remotely close to being fairly valued by the stock market before the
latest bear-market rally was born. All of these companies will be
fairly valued or under-valued before the bear market ends, so for the stocks
that have the greatest influence on the stock indices the valuation risk
is still substantial.
When the credit-induced stock market
mania was in full swing during the late-1990s, business momentum was strongly
positive. This meant that most surprises, as far as the profits and sales
of the market leaders (the tech stocks) were concerned, were of the pleasant
variety. Earnings pre-announcements and the earnings announcements themselves
were filled with upward revisions and glowing reports on companies' future
prospects, so although valuations were absurdly-high the phenomenal growth
provided some support. Now, however, we have the high valuations while
business, for many of the large-cap tech stocks, is stagnant or shrinking.
This is a recipe for another major decline in the stock market during the
first half of next year. The US credit-generating machine can combine with
movement-chasing speculators to create bullish price action in the stock
market for a while, but the fundamental problems that led to the stock
market's downtrend over the past 2.5 years have not gone away. They are
just being ignored for the moment.
The S&P500 in terms of gold
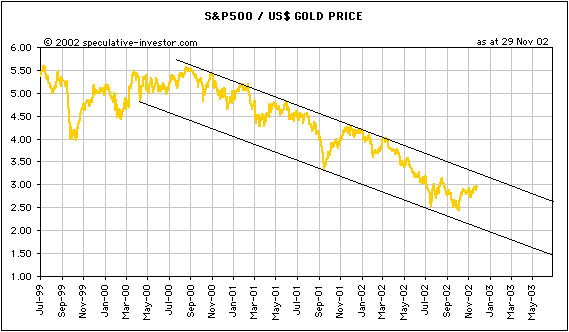
Below is a chart showing the S&P500/gold
ratio (the number of ounces of gold it takes to buy the S&P500 Index).
Over the past 2.5 years the ratio has moved in a well-defined downward-sloping
channel. Every significant rally in the ratio since April of 2000 has ended
right at the channel top, except for the rally that commenced in July of
this year (which failed well below the channel top). It is therefore reasonable
to assume that the current rally will fail at, or below, the channel top.
If the current rally makes it to the top of the channel at some point over
the coming 2 months then the ratio would peak at around 3.2:1. With the
gold price at $300 this would require the S&P500 to move up to 960
(about 3% above its current level). With the gold price at $320 the S&P500
would need to reach 1024 (about 9% above its current level) to bring the
ratio up to 3.2.

The S&P500/gold ratio tends to
peak when the S&P500 is near a high and when the gold price
is near a low, so if we are going to get a peak in the ratio during the
next 2 months then the gold price should soon start moving lower and the
S&P500 should continue to work its way higher. The other possibility
worth considering is that the ratio will immediately turn lower as gold
starts to rally and the S&P500 starts to decline (note that the ratio
peaked at around this time last year).
As discussed in the "Overview" at the
top of today's commentary, all the markets are finely balanced right now
and gold stocks are expected, by us, to point the way as far as the next
2 months of financial-market action are concerned. If gold stocks start
to rally over the next few days then the odds would shift in favour of
the S&P500/gold ratio falling back to the bottom of its channel over
the next 2 months rather than moving up to the top of its channel. In 2
months time the channel bottom will be hit if, for example, the S&P500
is at 700 and the gold price is at $350.
Current Market Situation
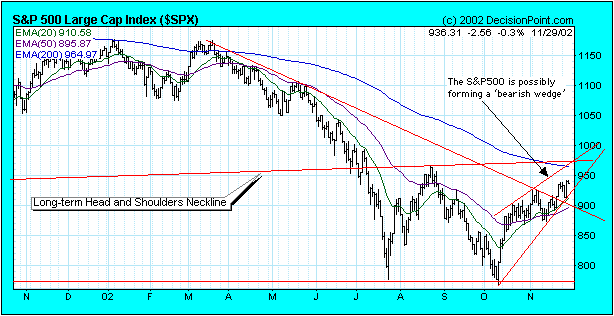
Below is a chart of the S&P500
Index. The index's short-term uptrend would be broken with a daily close
below 920 during the coming week.

In last week's Interim Update we explained
that market sentiment and the market's 'internals' had recently improved
enough to suggest that the rally off the 10th October bottom could continue
until January. The sentiment situation actually took another turn for the
better on Friday when a less than 1% fall in the NASDAQ100 Index was accompanied
by a 4% increase in the NASDAQ100 Volatility Index, meaning that the level
of fear rose by a disproportionately-large amount.
One thing we will be watching closely
is how sentiment indicators respond to a pullback. If this rally is going
to extend into January then any modest pullback during the first half of
December should be greeted with a sharp increase in fear.
The other thing we will be watching,
as discussed above, is the performance of gold stocks. It is certainly
possible that gold stocks will rally with the overall market, particularly
if market participants begin to recognise that inflation presents a much
greater and more immediate threat to the US economy than deflation. However,
in an environment where gold stocks are rallying with the market, leadership
in the market would most likely reside with the stocks of the commodity
producers and other companies that benefit directly from dollar depreciation.
In this type of environment the interest-rate sensitive sectors, such as
the banks, would probably be declining even as
the overall market were edging higher. We never like to make a big deal
out of a single day's trading action, particular the action during a light-volume
holiday-shortened day such as last Friday, but strength in some of the
commodity stocks was very noticeable at the end of last week. For example,
on Friday BHP Billiton, Anglo American and Phelps Dodge all gained about
5% while most interest-rate sensitive stocks were slightly lower.
Adding to all the crosscurrents in
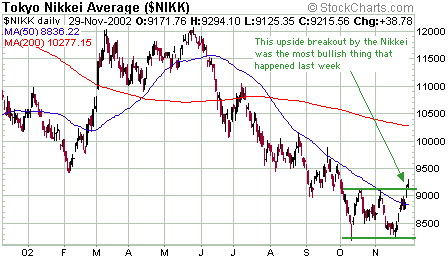
the stock market at the present time, the Japanese stock market finally
made a definitive up-move last week. As the following chart shows, the
Nikkei225 Index surged above its 50-day moving average last Thursday. The
current rally in the Nikkei has therefore differentiated itself from all
the other failed rally attempts of the past 6 months and has provided some
belated confirmation of the rally in the US stock market.

This week's important economic/market
events
| Date |
Description |
| Monday December 02 |
Construction Spending
ISM Index (formerly NAPM) |
| Tuesday December 03 |
No significant events |
| Wednesday December 04 |
Productivity and Costs (for Q3)
ISM Non-Manufacturing Index |
| Thursday December 05 |
No significant events |
| Friday December 06 |
ECRI Future Inflation Gauge
Consumer Credit
Employment Report |
 Click
here to read the rest of today's commentary Click
here to read the rest of today's commentary

|

