|
-- for the Week Commencing 6th August 2001
Forecast
Summary
 The
Latest Forecast Summary (no change from last week) The
Latest Forecast Summary (no change from last week)
Big Picture
View
Here is a summary of our big picture
view of the markets. Note that our short-term views may differ from our
big picture view.
Bond yields (long-term interest
rates) will move higher into 2002.
The US stock market is in a
cyclical bull market that began in late-March/early-April and is likely
to end during the final quarter of this year.
The Dollar will head lower into
2002.
A bull market in gold stocks
commenced in November 2000 and is likely to extend into 2002.
Commodity prices, as represented
by the CRB Index, are in the process of bottoming. The CRB Index will reverse
higher during the second half of 2001 and rally into 2002.
The oil price will resume its
major uptrend during the second half of 2001 and rally into 2002.
Money Matters
Focus on tomorrow's headlines, not
yesterday's headlines
As far as leading indicators of the
economy go the inflation-adjusted money supply growth rate is head, shoulders
and bootlaces above anything else. And yet, time and time again we see
analysts ignoring changes in money supply and, instead, choosing to focus
on coincident indicators or even lagging indicators. Lagging indicators
such as the employment data and the GDP numbers tell us what the economy
was doing a few months ago. Coincident indicators such as the consumer
sentiment surveys and the National Association of Purchasing Managers survey
tell us what the economy is doing right now. Even the future-expectations
component of the Conference Board's consumer sentiment survey is a coincident
indicator since it moves with, not in advance of, the current component.
All these lagging and coincident indicators are useful to know since they
help paint a picture of where we've been and where we are. Unfortunately,
they don't help us make any money because the financial markets are always
adjusting prices based on an assessment of where we are going, not where
we are or where we've been. In other words, in order to make money we needn't
worry too much about yesterday's or today's headlines. What we need to
do is figure out what tomorrow's headlines are going to be.
Below is a chart comparing the inflation-adjusted
year-over-year growth in M2 (using the median CPI as the measure of inflation)
with the growth rate of real GDP. M2 growth has been advanced by 6 months
to account for the fact that 6 months is the typical lead-time between
changes in money supply and changes in economic growth.
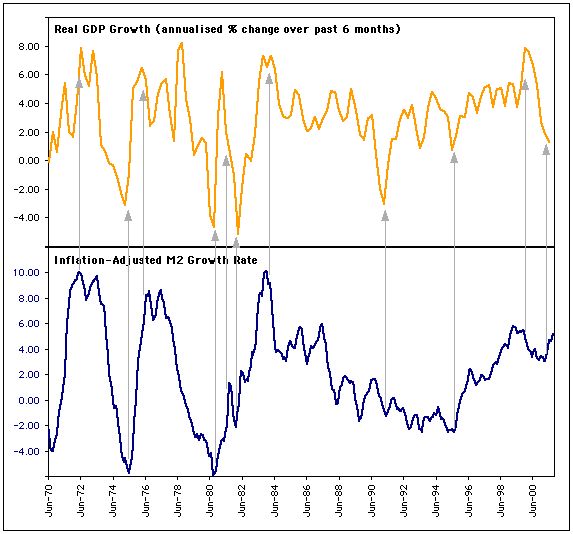
The above chart reveals a strong positive
correlation between inflation-adjusted money supply growth and economic
growth. The correlation is not perfect, mainly because the lag between
money supply changes and economic growth changes is not always the same
(it is often about 6 months, but can be as much as 12 months). The most
recent trough in the inflation-adjusted M2 growth rate occurred in November
of last year, meaning that the second quarter of this year was the most
likely time for an economic trough. The strong recovery in the money supply
growth rate since November of last year points towards a period of healthy
economic growth commencing by the fourth quarter of this year. Real GDP
growth during this year's final quarter will probably be in excess of 3%.
The bond market is also a good leading
indicator, although the signal given by the bond market usually contains
a lot of noise since bond prices are adjusted daily based on emotional
responses to the news of the day and technically-based trading in addition
to objective assessments of the future. However, when we see definite changes
in the bond price trend such as occurred during the first quarter of last
year and the first 5 months of this year, and particularly when the trend
changes seem to be completely at odds with conventional wisdom and the
latest economic news, it is usually a valid warning that the economic backdrop
is about to change.
In April last year, based on a clear
trend reversal in long-term interest rates from up to down (that most analysts
wrongly attributed to the US Government's debt buybacks) and a decline
in the money supply growth rate over the preceding months, we forecast
that US economic growth would slow substantially during the second half
of the year. The best leading indicators were signaling that an economic
slowdown, perhaps even a recession, was going to occur regardless of what
actions were taken by the Fed.
For the past few months the best leading
indicators have been warning us to expect a reasonably strong economy by
the fourth quarter of this year. Fortunately, most analysts don't agree
with us because they are fixating on yesterday's headlines (we say "fortunately"
because opportunities arise when there is a mismatch between what most
people think is going to happen and what is actually going to happen).
Assuming our economic forecast becomes a reality (there are no guarantees
since even the best leading indicators can't account for such things as
unexpected wars or natural disasters), the prices of stocks and bonds will
have factored-in an economic recovery long before the coincident indicators
start showing indisputable signs of strength.
Turning Japanese?
Is the huge growth in the amount of
money invested in money-market funds over the past 8 months a sign that
Americans are following the lead of their Japanese counterparts and starting
to hoard cash? In a word, no.
The total supply of money in the US
has ballooned since November of last year. Since an increase in the money
supply is caused by an increase in debt, the flood of money into money-market
funds is not the result of a growing propensity to hoard cash or to save,
it is the result of a borrowing binge.
A big factor in this build-up of money
has been the mortgage refinancing boom that began late last year. People
have borrowed against the equity in their homes and are using money-market
funds as temporary parking places for this money. The money is, no doubt,
earmarked for spending or investment or the repayment of other debts (most
likely spending and/or investment since consumer credit has been growing
in parallel with money-market fund assets).
The US
Stock Market
Zooming out
As we've noted on numerous occasions
over the past 4 months, we expect the major stock indices to reach much
higher levels during the second half of this year. We are not, however,
bullish beyond the final quarter of this year.
Our forecast has been, and continues
to be, based on the extremely positive monetary environment that has developed
since late last year. As discussed earlier in today's commentary, the lagged
effect of this monetary stimulation will ensure a strong economy during
this year's final quarter and probably during the first several months
of next year. It will also boost asset prices when part of the additional
liquidity that has stemmed from the accelerated expansion of credit is
channeled into stock and real estate investments.
The reason we are not longer-term bullish
is that if our bond market forecast comes to fruition (we expect long-term
interest rates to move higher over the next 12 months) then the positive
effect of the monetary stimulation will be short-lived. Rising long-term
interest rates will slow the pace of credit expansion and any significant
slowdown in money-supply growth (less credit growth means less money-supply
growth) will be anathema to the stock market, the real estate market and
to the economy. In fact, if things develop the way we currently expect
then a large decline in asset prices and a severe recession are going to
occur during the coming 18 months.
One more piece of the puzzle may
be falling into place
In the July-25 Interim Update, with
Japan's Nikkei Index having fallen to around 11,600 (within 2% of its March-2001
low), we wrote: "Our opinion is that the recent decline [in the
Japanese stock market] will turn out to be one of those consolidations
that retraces 100% of the preceding advance, but does not make new lows
and is followed by a substantial rally to new recovery highs (in this case,
above the early-May peak). One reason we think this is because of the capitulation
that led to the March bottom (the Nikkei dropped in almost a straight line
between September 2000 and March 2001). It is unlikely that a bottom reached
following such a severe and relentless decline would be exceeded only 4
months later."
So far so good as the Nikkei held above
its March-2001 low of 11433 and has since moved back above 12,000. Based
on the pattern of the past six months an upward reversal in the Nikkei,
which may or may not have happened over the past week (still too early
to tell with any certainty), is something we expect to occur prior to the
commencement of a sustainable rally in the US stock market. The recent
action in the Nikkei provides further evidence that the US market has probably
seen its correction lows.
Current Market Situation
The evidence has gradually been building
that the correction lows are in place. Firstly, as mentioned above, the
Nikkei's recent action has been constructive. Secondly, the recent strength
in the oil price supports the notion that a new short-term up-trend has
begun in the stock market (refer to the Jul-23 WMU for a discussion of
how the oil price and the S&P500 have been moving with each other since
the beginning of this year). Thirdly, the Dollar is now headed lower (an
excessively-strong Dollar was becoming a big problem for the stock market).
Fourthly, at the correction lows on Jul-24 there was almost universal agreement
that the market was about to plunge at least as far as the early-April
bottom and probably much further (in other words, the sentiment backdrop
was well-suited to an upward reversal). Fifthly, market internals did not
confirm the recent declines in the major indices. So, is it onward and
upward from here?
No. We are still expecting one more
significant pullback before a substantial rally gets underway, primarily
due to short-term sentiment indicators such as the 5-day moving-average
of the equity put/call ratio (see chart below).
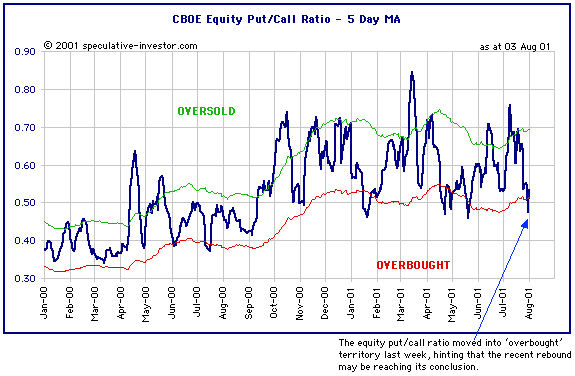
A bit more upside is likely in the
very short-term (the next few days), after which we should see a 1-2 week
pullback that acts to rebuild the "wall of worry" that all bull markets
climb. If everything goes according to plan we will recommend a trading
position in QQQ shares and/or QQQ call options during this pullback in
preparation for a potential 2-3 month surge. We are also immediately going
to add two tech stocks to the Portfolio as described below under "Changes
to the TSI Portfolio".
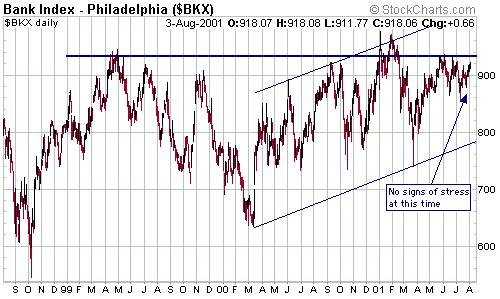
The Argentine Crisis
We've mentioned the Argentine financial
crisis a couple of times but haven't been overly concerned about its global
implications. The following chart explains why. If the crisis was going
to become global then the major US banks would have a big problem on their
hands and the market would be quick to discount the worst case in the prices
of bank stocks. The stability of the PSE Bank Stock Index over the past
2 months is a clear sign that the crisis that has enveloped large parts
of South America will not have dire implications for the world's
major economies.
This week's important economic/market
events
| Date |
Description |
| Tuesday August 7 |
Q2 Productivity Report (prelim)
Consumer Credit
Cisco earnings report |
| Thursday August 9 |
Import/Export Prices |
| Friday August 10 |
PPI |
Gold and
the Dollar
Click
here to view the remainder of this week's commentary

|
