|
-- for the Week Commencing 8th April 2002
Forecast
Summary
 The
Latest Forecast Summary The
Latest Forecast Summary
Big Picture
View
Here is a summary of our big picture
view of the markets. Note that our short-term views may differ from our
big picture view.
Bond yields (long-term interest
rates) will move higher during 2002.
The US stock market will make
new bear market lows in 2002.
The Dollar commenced a bear
market in July 2001, but will rally to a secondary peak during the first
quarter of 2002 before beginning a major descent.
A bull market in gold stocks
commenced in November 2000 and is likely to extend into 2003.
Commodity prices, as represented
by the CRB Index, will rally during 2002 and 2003.
The oil price will resume its
major uptrend during the first half of 2002.
Bonds and
Stocks
Although we never trade bonds for our
own account we spend a lot of time analysing the bond market. We do this
because interest rates exert such a strong influence on all the other financial
markets.
We turned long-term bearish on bonds
during the first week of 2001 - at the very beginning of the Fed's rate-cutting
campaign. Throughout 2001 the relentless slashing of short-term rates by
a panicked Fed was generally portrayed as bullish for bonds, but we certainly
didn't see it that way. Our view was that the Fed's aggressive rate-cutting
in the face of massive inflation (a surging money-supply growth rate) would
eventually cause bond prices to move much lower. As it turned out, the
US Treasury managed to engineer a rally in bonds in October that pushed
bond prices to new highs for the year (pushed long-term interest rates
to new lows), but the government's market-meddling simply laid the groundwork
for a crash in bond prices during November and December.
The early-December low in the bond
price (basis the June bond contract) is now a 'line in the sand' that represents
last-ditch support for bonds. A drop below this support, when it occurs,
will signal that a decline to the January-2000 low is underway (such a
decline in the T-Bond price would cause the T-Bond yield to rise to around
6.75% versus its current level of 5.67%).
We expect bonds to break below the
above-mentioned major support at some point during the next 2 months. However,
for a number of reasons we have forecast an intervening rebound in the
bond price prior to the start of the next substantial decline. In particular,
sentiment towards bonds had become exceedingly bearish over the past few
weeks and a situation had arisen where the 'smart money' (the large traders)
was betting on an upward reversal in bonds while the 'dumb money' (the
small traders) was betting on a continuation of the decline. There are,
of course, smart small-traders and dumb large-traders, but the large traders
as a group tend to be better-informed and more often on the right side
of the market than the group defined as small traders.
Following on from the above comment
regarding 'smart money' and 'dumb money', we consider large speculators
and
large commercials to be 'smart money'. Often these two 'smart money' groups
are at loggerheads with each other with the commercials usually ending-up
being right at important turning points (trend reversals) while the large
specs tend to be right as long as the market is trending. We take particular
notice, therefore, when the large specs and the large commercials are lined-up
on one side of the trade while the small traders, as a group, are taking
the other side of the trade. This has been the case with T-Note futures
over the past several weeks. For example, as at the 2nd of April (the date
of the latest COT Report) the large speculators and the large commercials
were net-long and the combined net-long position of these two groups was
around 60,000 contracts. The small traders were correspondingly net-short.
By the way, a similar situation exists in the S&P500 futures market
in that both the large speculators and the large commercials are net-short
(their combined net-short position was a hefty 106,000 contracts as at
2nd April). This is one reason that a substantial stock market rally appears
to be out of the question at this time.
Getting back on track, a bear-market
rally in bonds has been a high probability over the past few weeks and
is now underway. Furthermore and as explained many times in previous commentary,
such a rally in the bond market was absolutely essential if the stock market
was to have any chance of mounting a meaningful rally of its own over the
next 3 months.
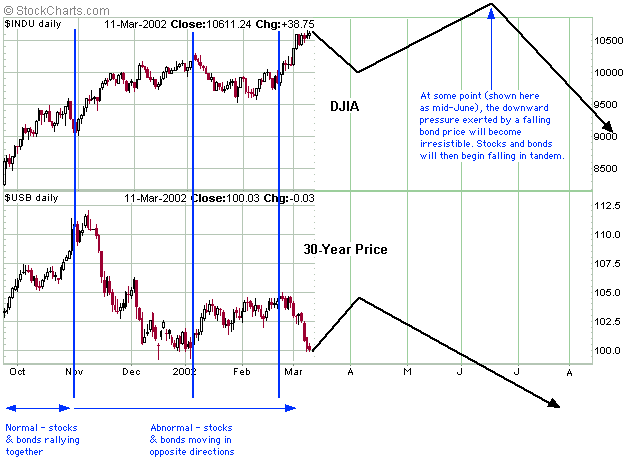
Below is the chart comparison of the
Dow Industrials and the 30-year T-Bond that was originally part of our
13th March Interim Update. The chart includes rough projections of what
we expected stocks and bonds to do over the ensuing 5 months. We haven't
needed to do an updated version of the chart because the markets have thus
far followed these projections quite closely.

At the time the above chart was prepared
we were anticipating a stock market decline and a bond market rally into
the first half of April, followed by reversals in both markets. It is possible
that the current moves (higher for bonds, lower for stocks) could extend
into the second half of April, but our forecast remains essentially the
same as that shown on the chart.
Financial markets never get where they
are going in a straight line, meaning that there are always counter-trend
moves along the way. The current rally in bonds is of the counter-trend
variety and will almost certainly be followed by a plunge to new lows.
The main problem for bonds is that some of the effects of the past
2 years' massive inflation, such as rising commodity prices, are only just
beginning
to emerge. As such we are confident that the bond bear-market is still
in its infancy and that interest rates will move much higher over the coming
12 months. As explained in previous commentary rising interest rates will,
in turn, become an insurmountable problem for an over-priced stock market.
Commodities
Forecasting commodity prices
You cannot forecast commodity prices
by looking at supply/demand information such as inventory levels, current
and expected mine production, industry and economic data, etc. This is
because, at any given time, the market has discounted all the available
data in the current price. It is possible, however, to correctly forecast
commodity price trends if you understand what is happening to bonds and
to the money-supply growth rate (trends in bond prices and money-supply
growth lead the general commodity-price trend). It also helps to know that
the Australian Dollar often leads commodity prices (and, by the way, US
bond prices).
By the time the fundamentals for any
commodity (or anything, for that matter) become unequivocally-bullish the
price has most likely already peaked and anyone buying in response to the
bullish fundamentals will lose money. Similarly, it is common for prices
to bottom and turn higher just when the fundamentals appear to offer no
hope of a price recovery.
The palladium market over the past
18 months provides a good example of the dangers of reacting to the current
fundamentals. At the top of the market in early-2001, with the palladium
price at around $1000, the supply/demand situation looked extremely bullish.
Russian suppliers appeared to have the ability to drive prices much higher
through small reductions in their exports and the major auto manufacturers
were scrambling to secure additional supply before the price moved even
higher. However, the palladium price dropped by 70% over the ensuing 9
months. The fundamentals for palladium now look terrible as the brilliant
traders at Ford - people who had been aggressive buyers of the commodity
at $800-$1000 per ounce - desperately try to unload their company's huge
excess supply at the current market price of around $360. Furthermore,
the Russians now appear to be powerless to halt the decline in the palladium
price.
Has the palladium price already bottomed?
We don't know, but we seriously doubt that there will be substantial further
downside because today's massive over-supply has already been discounted
in the current price.
Copper
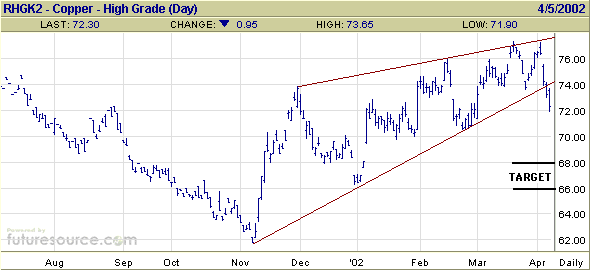
We've held a positive view on copper
over the past several months, but in the 25th March Weekly Update noted
that a bull-market correction in copper would likely occur in parallel
with the anticipated bear-market rally in bonds. By breaking its post-November
up-trend last week the copper price has signaled that a correction is underway.

The Australian Dollar
A medium-term bullish view on commodities
and bearish view on bonds goes hand-in-hand with a bullish view on the
A$ (due to Australia's reliance on commodity exports the A$ tends to move
in the same direction as commodity prices and in the opposite direction
to bond prices). We expect the A$ to move much higher relative to the US$
over the next 12 months, but it looks vulnerable to a sharp fall in the
short-term.
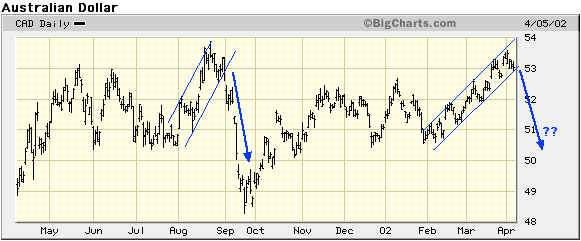
Despite edging lower last week the
Oz Dollar's short-term up-trend remains intact. There are, however, a few
reasons to expect a break of this up-trend in the near future. One obvious
reason is the current counter-trend moves in commodities and bonds (lower
for commodities, higher for bonds). One not so obvious but potentially
very important reason is the A$'s tendency, since the beginning of 2001,
to move in the same direction as the US stock market.
Over the past few weeks the A$ has
continued on its upward path as the major stock indices have fallen. The
only other period over the past year when the A$ moved higher as the stock
market ground lower occurred last August. This divergence was subsequently
removed via a plunge in the A$ during September.
The below chart of the A$ shows the
developing similarity between the current period and last August. It may
not be a coincidence that this price action is occurring just as the situation
in the Middle East appears to be approaching its boiling point.

The US
Stock Market
The Big Picture
We are short-term bearish on the stock
market but could turn short-term bullish at some point over the next few
weeks if certain conditions are met (as outlined in previous commentary).
However, we are very bearish on the market taking a 6-12 month view and
would almost certainly look at any sizable rally over the next 2-3 months
as a wonderful opportunity to bet against the market.
The main reason for our longer-term
bearish view is valuation. Our concern is not so much that price/earnings
ratios are high since these can be distorted by collapsing earnings, but
that price/sales ratios were much higher at last September's bottom than
they should have been if a long-term bottom had been put in place.
The stock market can remain over-valued
or under-valued for a very long time. The reasons we expect the valuation
problem to be addressed this year are a) rising interest rates and b) a
falling money-supply growth rate. Rising interest rates are important because,
as previously discussed in detail, they reduce the present value of future
cashflows. In fact, the basis for the secular bull market in stocks that
began in 1982 was a secular downtrend in interest rates. The money-supply
growth rate is important because if stock prices are not supported by the
fundamentals then they can only remain elevated through currency depreciation.
It was rapid money-supply growth that kept the major stock indices moving
higher between the fourth quarter of 1998 and the first quarter of 2000.
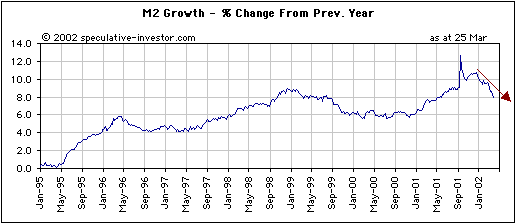
The year-over-year M2 growth rate (see
chart below) began trending lower in December of last year. Trends in money-supply
growth usually last for at least 12 months so we can expect the money-supply
growth rate to remain on a downward path throughout 2002. This is going
to create a big problem for the stock market by the third quarter of this
year and a big problem for the economy by the first quarter of 2003.

Current Market Situation
We continue to expect the stock indices
to reach lower levels before the current pullback is complete. Up until
now the decline has been orderly, but before it ends we expect to see one
or two days of panic selling (as indicated, for example, by an equity put/call
ratio above 0.9). We assess the likely downside over the next 2 weeks for
both the NASDAQ100 and the S&P500 to be around 5% from Friday's closing
levels. However, events in the Middle East have the potential to convert
a nervous pullback into a rout.
A few weeks ago we suggested that short-term
traders buy QQQ June $30 put options. As noted in the latest Interim Update
we would take profits on these options if the NASDAQ100 drops to near 1300
(it closed at 1377 on Friday).
In last week's Weekly Update we suggested
that longer-term traders/investors purchase an initial bearish position
immediately (via, for example, a bearish mutual fund or LEAPS) with the
aim of adding to the position during periods of general market strength
over the next 3 months. This longer-term bearish trade is being recommended
in anticipation of a substantial stock market decline during the second
half of this year.
The Japanese stock market, which has
been leading the US market since the beginning of last year, remains within
a short-term downtrend that looks, at this stage, like a normal breakout
pullback. It must continue to hold at support in the 10800-11000 range
for this to remain the case.
This week's important economic/market
events
| Date |
Description |
| Monday April 08 |
No significant events |
| Tuesday April 09 |
No significant events |
| Wednesday April 10 |
No significant events |
| Thursday April 11 |
Import and Export Prices |
| Friday April 12 |
PPI
Retail Sales |
 Click
here to read the rest of today's commentary Click
here to read the rest of today's commentary

|

